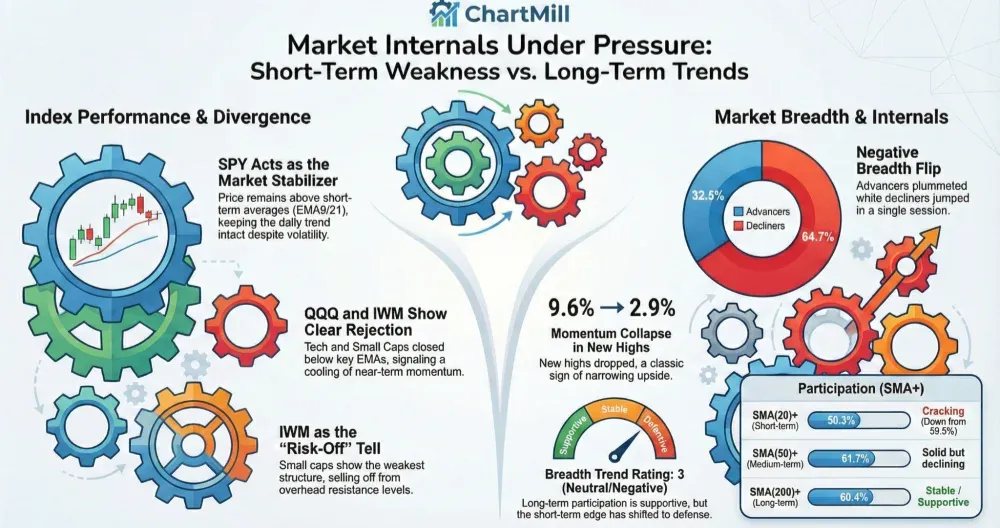
Friday’s tape looked “fine” at the index level, but the internals weren’t. Breadth flipped sharply negative again (32.5% advancers vs. 64.7% decliners) while downside >4% movers expanded. SPY is still holding above its short-term averages, but QQQ and especially IWM show clearer rejection at overhead levels, suggesting ongoing rotation and a market that’s increasingly selective.
Index overview (SPY, QQQ, IWM)
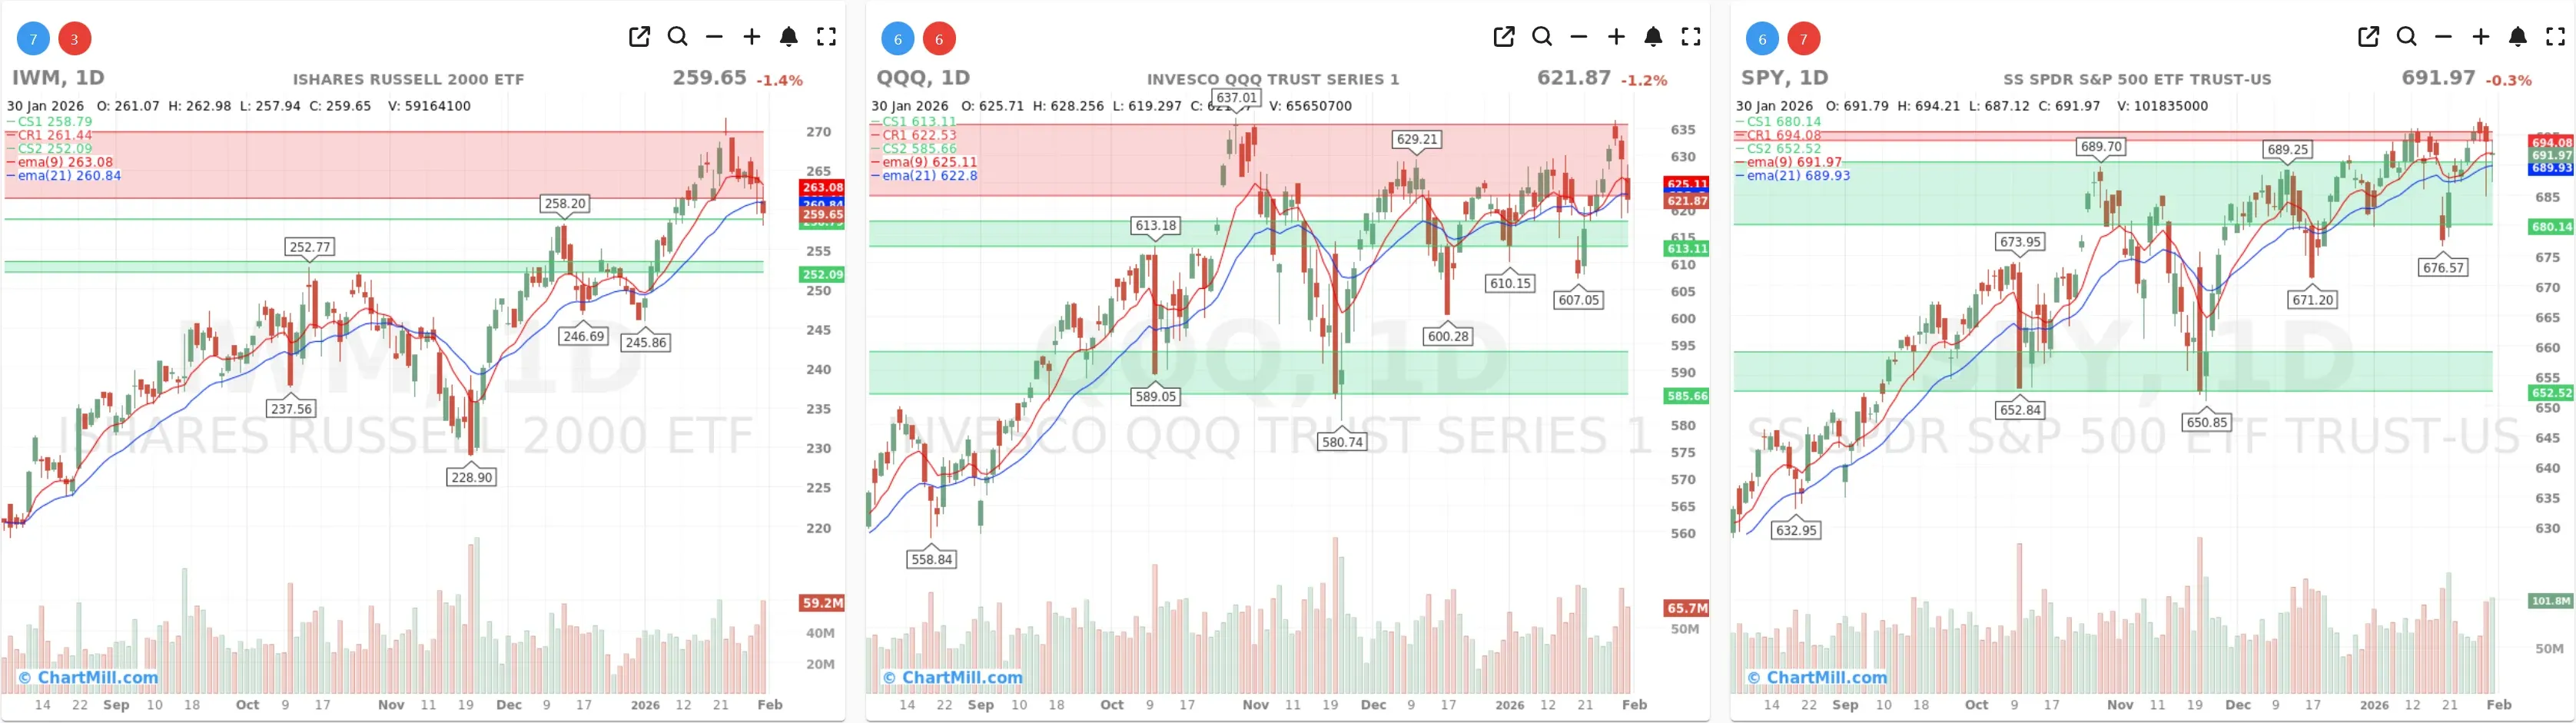
Short Term (Daily)
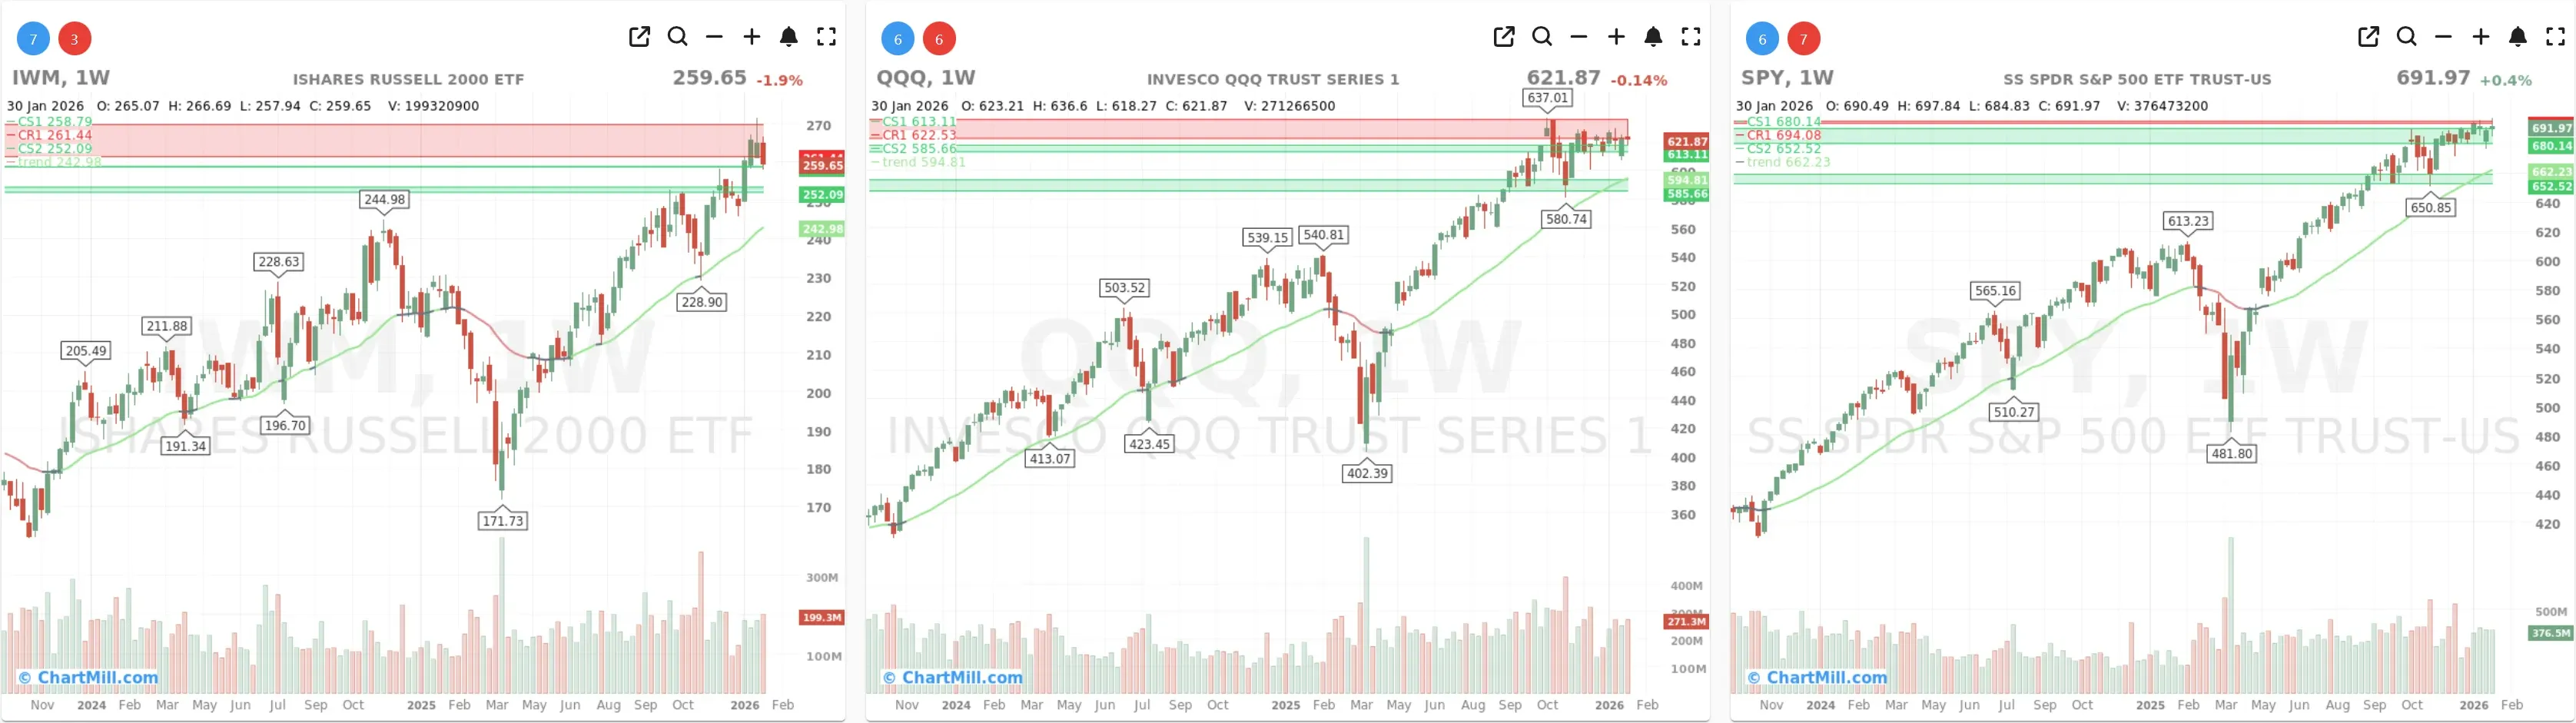
Long Term (Weekly)

SPY
Daily: SPY closed near 691.97 after a very wide intraday range (notable wicks/tails), which fits a “volatile churn” day rather than clean trend continuation. Importantly, SPY is still above EMA9/EMA21 (~689 area), so the index trend remains intact on the daily timeframe.
Weekly: The weekly chart remains constructive (price well above the 30-week trend line), and SPY still trades near the top of its range, relative strength vs. the broader list remains strong.
Read-through: Large intraday swings + closing relatively well while staying above short-term EMAs = buyers still present, but less confident / more two-sided trade.
QQQ
Daily: QQQ closed around 621.87 and finished below EMA9 (~625) and slightly below EMA21 (~623). That’s a meaningful shift versus a “hold-the-EMAs” posture. Price also appears to be failing near the upper band/resistance area (~629–637).
Weekly: Weekly trend remains positive, but the last couple of weeks look more like consolidation/distribution near highs than effortless upside.
Read-through: Tech leadership is still there longer-term, but near-term momentum is cooling, and the index is less supportive of aggressive breakout chasing.
IWM
Daily: IWM closed around 259.65, clearly below EMA9 (~263) and also under EMA21 (~260.8). It also sold off from the upper area (resistance overhead), showing the weakest short-term structure of the three.
Weekly: Still above the rising longer-term trend line, but it’s also pressing into a well-defined overhead zone and showing supply on the way up.
Read-through: Small caps are the clearest “risk-off tell” here: trend still up on weekly, but daily breadth/price action says caution.
Market breadth (what changed vs. Thursday)
Daily participation: a clear risk-off flip
-
Advancers: 32.5% (down from 49.2%)
-
Decliners: 64.7% (up from 47.6%)
-
Big movers: Decliners >4% jumped to 8.1% (from 7.4%) while advancers >4% fell to 2.2% (from 3.2%)
That combination - fewer advancers + more heavy downside - is typical of distribution/defensive rotation, not a “healthy dip.”
Moving-average breadth: short-term damage, longer-term still OK
-
SMA(20)+: 50.3% (down sharply from 59.5%) → big short-term participation hit in one session.
-
SMA(50)+: 61.7% (still solid, but off from 65.3%)
-
SMA(200)+: 60.4% (stable, long-term trend participation remains supportive)
Interpretation: the market’s backbone (50/200-day participation) is still holding up, but the tradable swing layer (20-day) is cracking, which often translates into fewer clean setups and more failed breakouts.
New highs/new lows: momentum cooled fast
-
New highs: 2.9% (down hard from 9.6%)
-
New lows: 2.4% (up from 3.0% on Thursday but generally elevated vs. earlier in the week’s best sessions)
The standout is the collapse in new highs, a classic sign that upside momentum is narrowing.
Multi-day trend: still positive, but momentum is fading
-
Adv Month: 67.6% vs Decl Month 31.8% → longer-term thrust still positive.
-
Adv 3 Month: 56.8% vs Decl 3 Month 42.1% → still net-positive, but not overwhelming.
-
Adv 25% (3M): 10.3% vs Decl 25% (3M): 12.4% → more deep losers than big winners over 3 months, which supports the “selective/uneven” narrative.
Bottom line: structurally bullish longer-term, but the near-term “breadth wind” turned against the tape again.
Putting it together
-
Indexes are near highs, but Friday’s internals weren’t compatible with a broad, healthy advance.
-
SPY holding above its EMAs is the stabilizer, but QQQ and IWM losing their short-term supports while >4% decliners expand suggests risk appetite is being rationed.
-
The big intraday ranges/wicks reinforce that this is currently a two-sided, headline-sensitive tape (common during earnings-heavy stretches and macro-data crosscurrents) rather than a smooth trend day.
Breadth trend rating (1–7)
3 — neutral, negative bias.
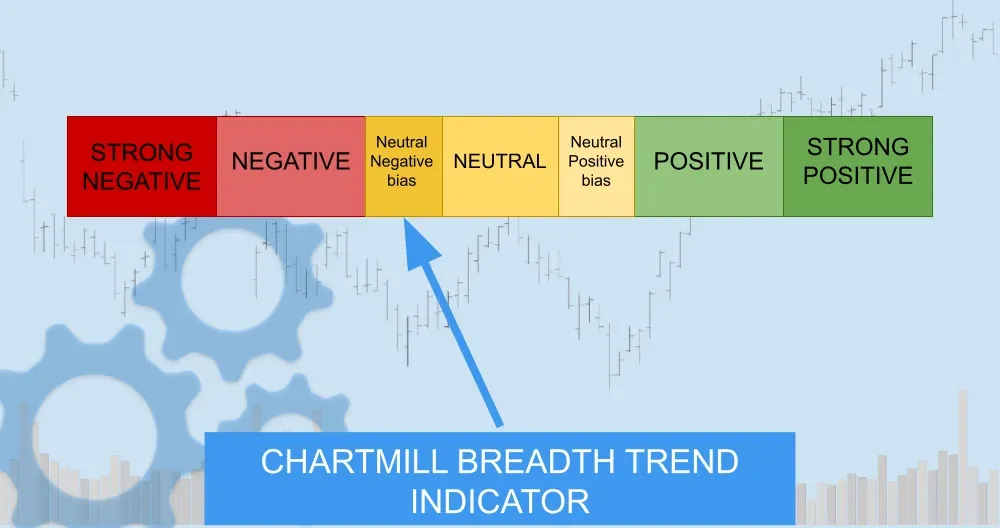
Longer-term participation (50/200-day) remains constructive and SPY is still acting well, but the sharp drop in daily breadth, the hit to SMA(20)+, the collapse in new highs, and the elevated downside >4% movers shift the near-term edge to defense.
What I’ll be watching next
-
Can SMA(20)+ stabilize back above ~55–60%? If it keeps bleeding, rallies are more likely to be narrow and fragile.
-
Do new highs rebuild (back toward ~7–10%)? Without that, breakouts will struggle.
-
Price action vs. EMA21: SPY holding above is key; QQQ/IWM reclaiming it would be the first “risk-on repair” signal.
Kristoff
Next to read: Warsh’s Fed Pick Triggers a Metals Faceplant