Today felt less like a “risk-off” session and more like a leadership swap. The headline indexes mostly stalled near resistance, but the internal tape improved meaningfully versus yesterday, helped by a strong bid in small caps and a clear pickup in participation.
Index overview (SPY, QQQ, IWM)
Short Term (Daily)
Long Term (Weekly)

SPY
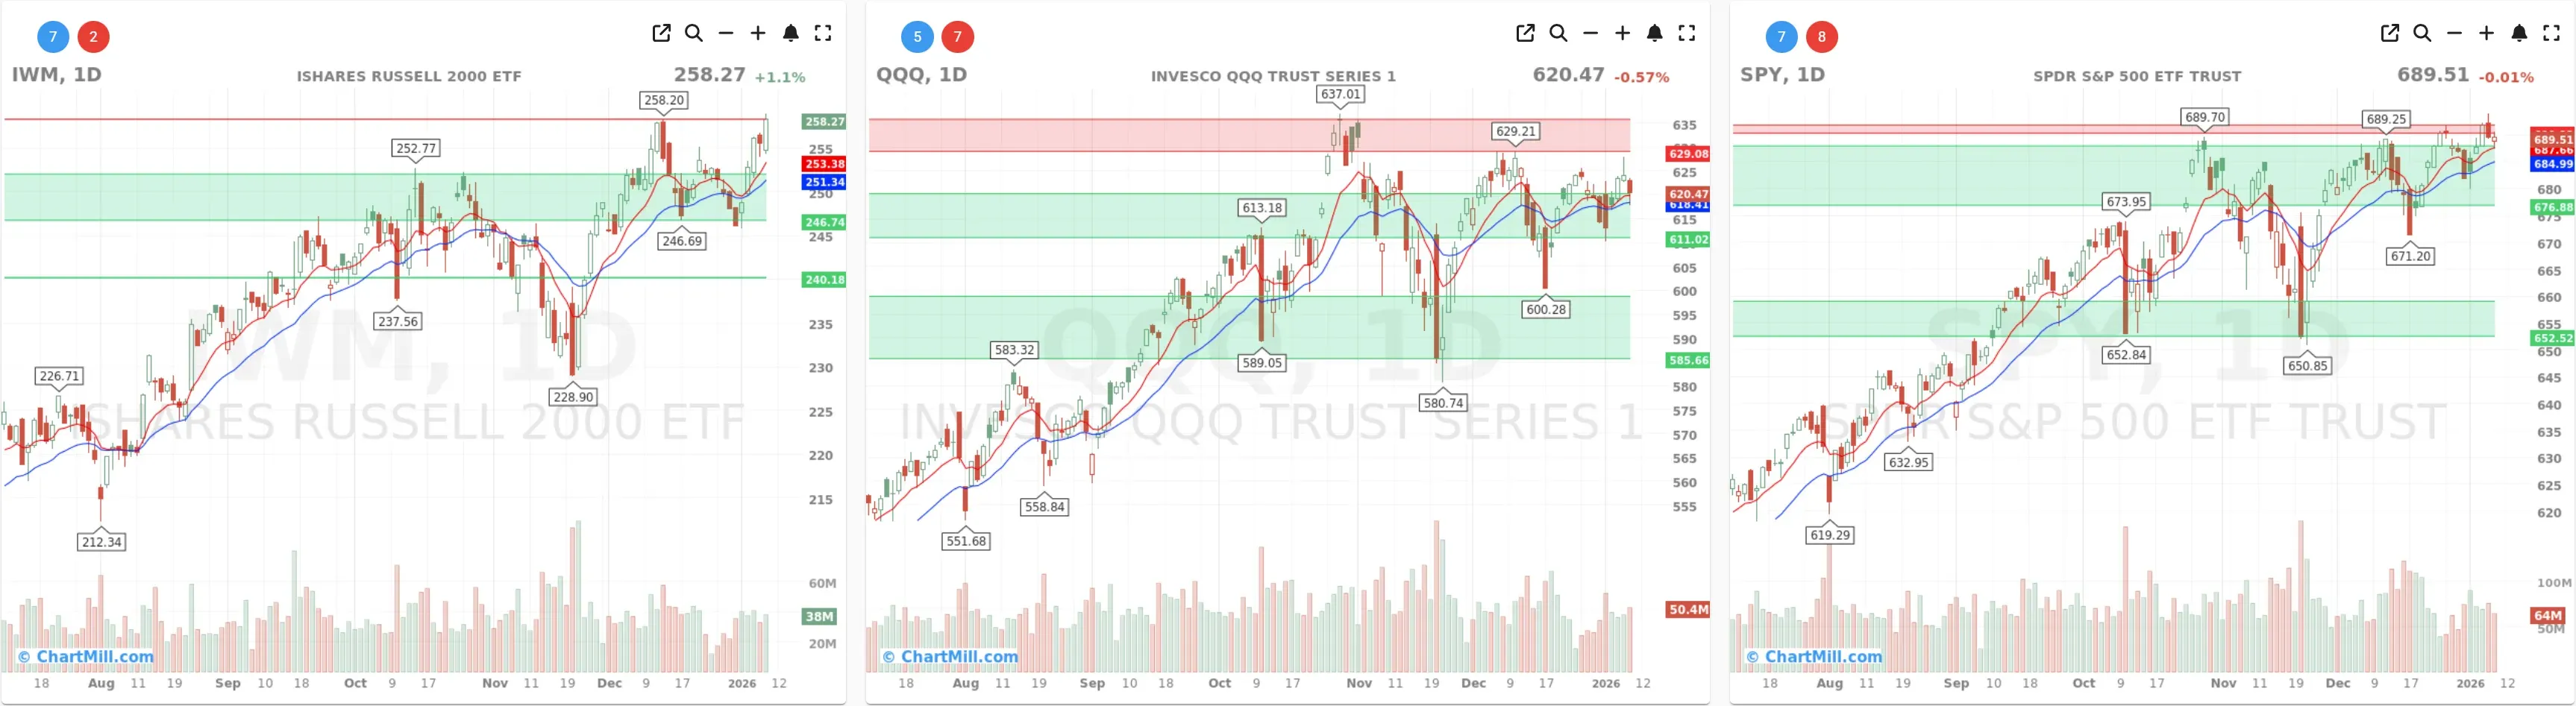
SPY essentially finished flat (689.51, -0.01%), and the chart still reads like a market digesting gains just under resistance around the prior highs. On the daily timeframe, price is holding above the rising short-term averages (EMA9/EMA21), which tells me this is still consolidation in an uptrend - not damage - unless we start losing the recent support zone near the mid/upper-670s.
On the weekly chart, the longer-term picture remains constructive: the 30-week trend indicator is green, and price is sitting at the top end of its range. The message is simple: trend is intact, but there’s overhead supply to chew through.
QQQ
QQQ slipped (620.47, -0.57%) and continues to struggle to reclaim the upper resistance band (roughly the 629–635 area on the daily chart). The important part: it’s not breaking down either. It’s still hovering above nearby support (low 610s) and the short-term moving averages are acting like a “balance beam.”
Weekly trend is still green as well, but QQQ is the one index here that looks most range-bound at the moment, important context if we see breadth improve without immediate index follow-through.
IWM
IWM was the standout (258.27, +1.1%) and, on the daily chart, it’s pressing into/through a key resistance zone around the mid-250s. That matters because when small caps lead while mega-cap tech pauses, it often shows up as better breadth under the surface, which is exactly what today’s table printed.
Weekly IWM remains firmly in a positive long-term trend (green ChartMill Trend indicator), and price is working at the top end of its structure.
Breadth dashboard: a clear improvement from Jan 7
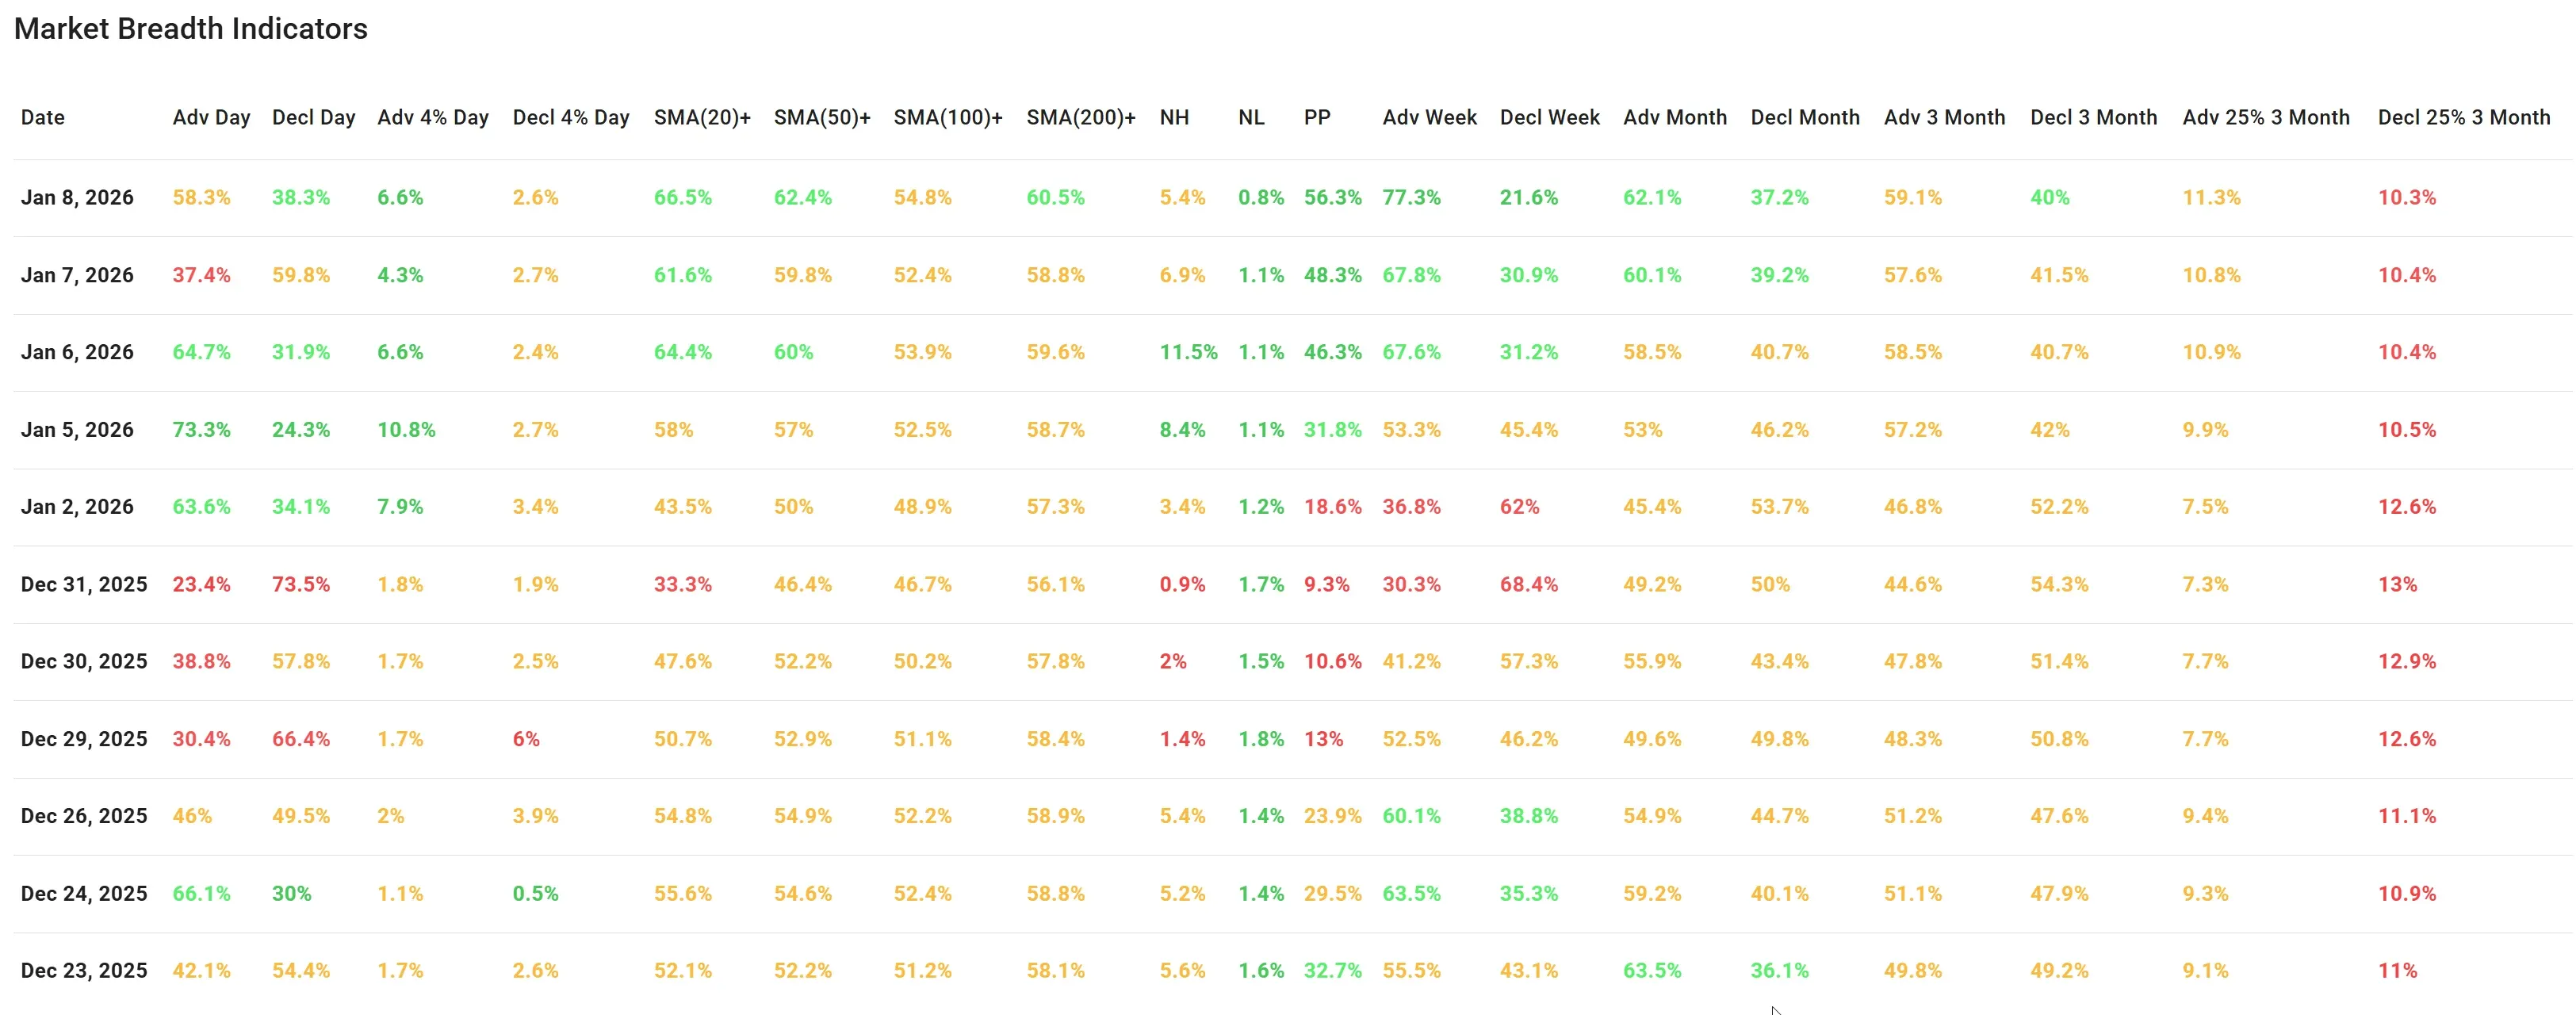
Yesterday (Jan 7) breadth looked like a classic “pause near resistance”: weak daily advancers and choppy leadership. Today reversed that tone.
-
Advancers improved to 58.3% (from 37.4% yesterday), while decliners fell to 38.3% (from 59.8%). That’s a meaningful swing in internal momentum.
-
The bigger-move skew leaned bullish: 6.6% of stocks were up more than 4%, versus 2.6% down more than 4%. That’s not euphoric, but it’s a healthy “upside edge.”
Pocket Pivots (PP) jumped to 56.3%, up from 48.3%. This is the kind of change I want to see when indexes are near resistance—more stocks joining the move instead of the rally narrowing.
New highs/new lows stayed constructive without looking like a blow-off:
- NH: 5.4%, NL: 0.8%. Lows remain contained, and highs are present (even if they cooled versus yesterday’s 6.9%).
Trend structure: improving short-term internals, steady longer-term base
The moving-average breadth confirms the “firming” narrative:
-
66.5% above the 20-day and 62.4% above the 50-day suggests intermediate momentum is broadening.
-
54.8% above the 100-day and 60.5% above the 200-day tells me the market isn’t just bouncing—there’s a decent foundation of longer-term trend support still in place.
Zooming out:
-
Adv Week: 77.3% vs Decl Week: 21.6% is a strong weekly skew, even though we just had a rough day yesterday.
-
Month and 3-month readings are also net positive (Adv Month 62.1%, Adv 3-Month 59.1%), but the “extremes” remain balanced: Adv 25% (3M) 11.3% vs Decl 25% (3M) 10.3%. That tells me the market is improving, but it’s not a runaway trend where everything is trending cleanly in one direction.
This lines up well with what I flagged yesterday: we were near resistance and vulnerable to chop. Today’s data says the market chose rotation over breakdown.
What I’m watching next
If this is going to turn from “constructive consolidation” into a cleaner advance, I want to see:
-
SMA50+ hold above ~60% and ideally push higher (it’s 62.4% now),
-
and new lows stay muted while new highs expand.
The main risk is still visible on the index tape: SPY/QQQ are under/near resistance, and QQQ is lagging. If breadth slips back toward the mid-40s on advancers while the indexes remain pinned, that’s when “rotation” can turn back into “stall.”
Breadth trend rating
Rating: neutral, with a positive bias.

The weekly backdrop and moving-average breadth are improving, and today’s participation rebound is exactly what I want to see after yesterday’s soft internals. But with SPY/QQQ still negotiating resistance (and QQQ notably weaker today), I’m not ready to call it outright “positive” until price confirms with a cleaner breakout.
Kristoff
Next to read: Defense Took the Lead While Chips Cooled Off