A Broad-Based Decline Ends Wall Street's Rally
U.S. equity markets pulled back on Tuesday, extending Monday’s losses and snapping a recent streak of gains for major indexes.
The Dow Jones Industrial Average fell 0.95%, while the S&P 500 and Nasdaq dropped 0.8% and 0.9%, respectively.
The decline was broad-based, driven largely by a sell-off in pharmaceutical and biotech stocks, concerns over global trade tensions, and investor unease surrounding the Federal Reserve’s next move.
Pharma Sector Hit Hard by Regulatory Shift
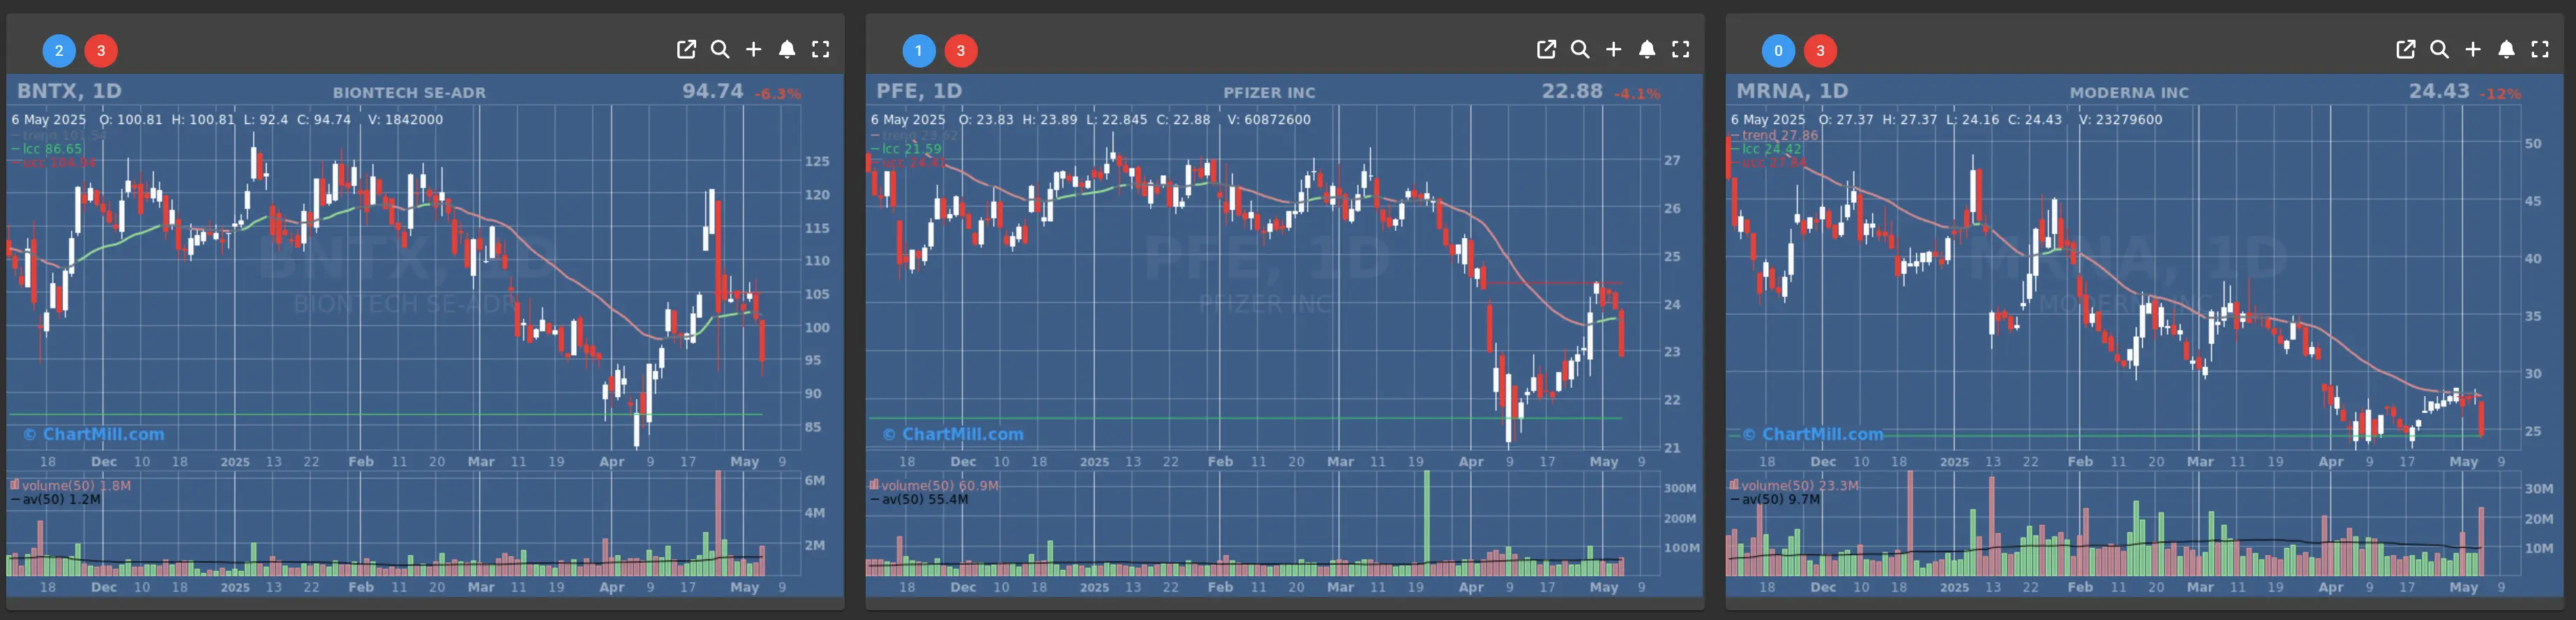
A major catalyst for the market downturn came from the healthcare sector. Vaccine manufacturers saw significant losses following news that the U.S. Food and Drug Administration (FDA) had appointed Dr. Vinay Prasad to lead the Center for Biologics Evaluation and Research. Prasad is known for his vocal criticism of the FDA and skepticism toward COVID-19 vaccines.
Investors interpreted his appointment as a signal of potentially tighter scrutiny and regulatory hurdles for drugmakers.
The impact was immediate. Moderna (MRNA | -12.25%) shares plunged over 12%, while Pfizer (PFE | -4.15%) and BioNTech (BNTX | -6.25%) lost more than 4% and 6%, respectively.
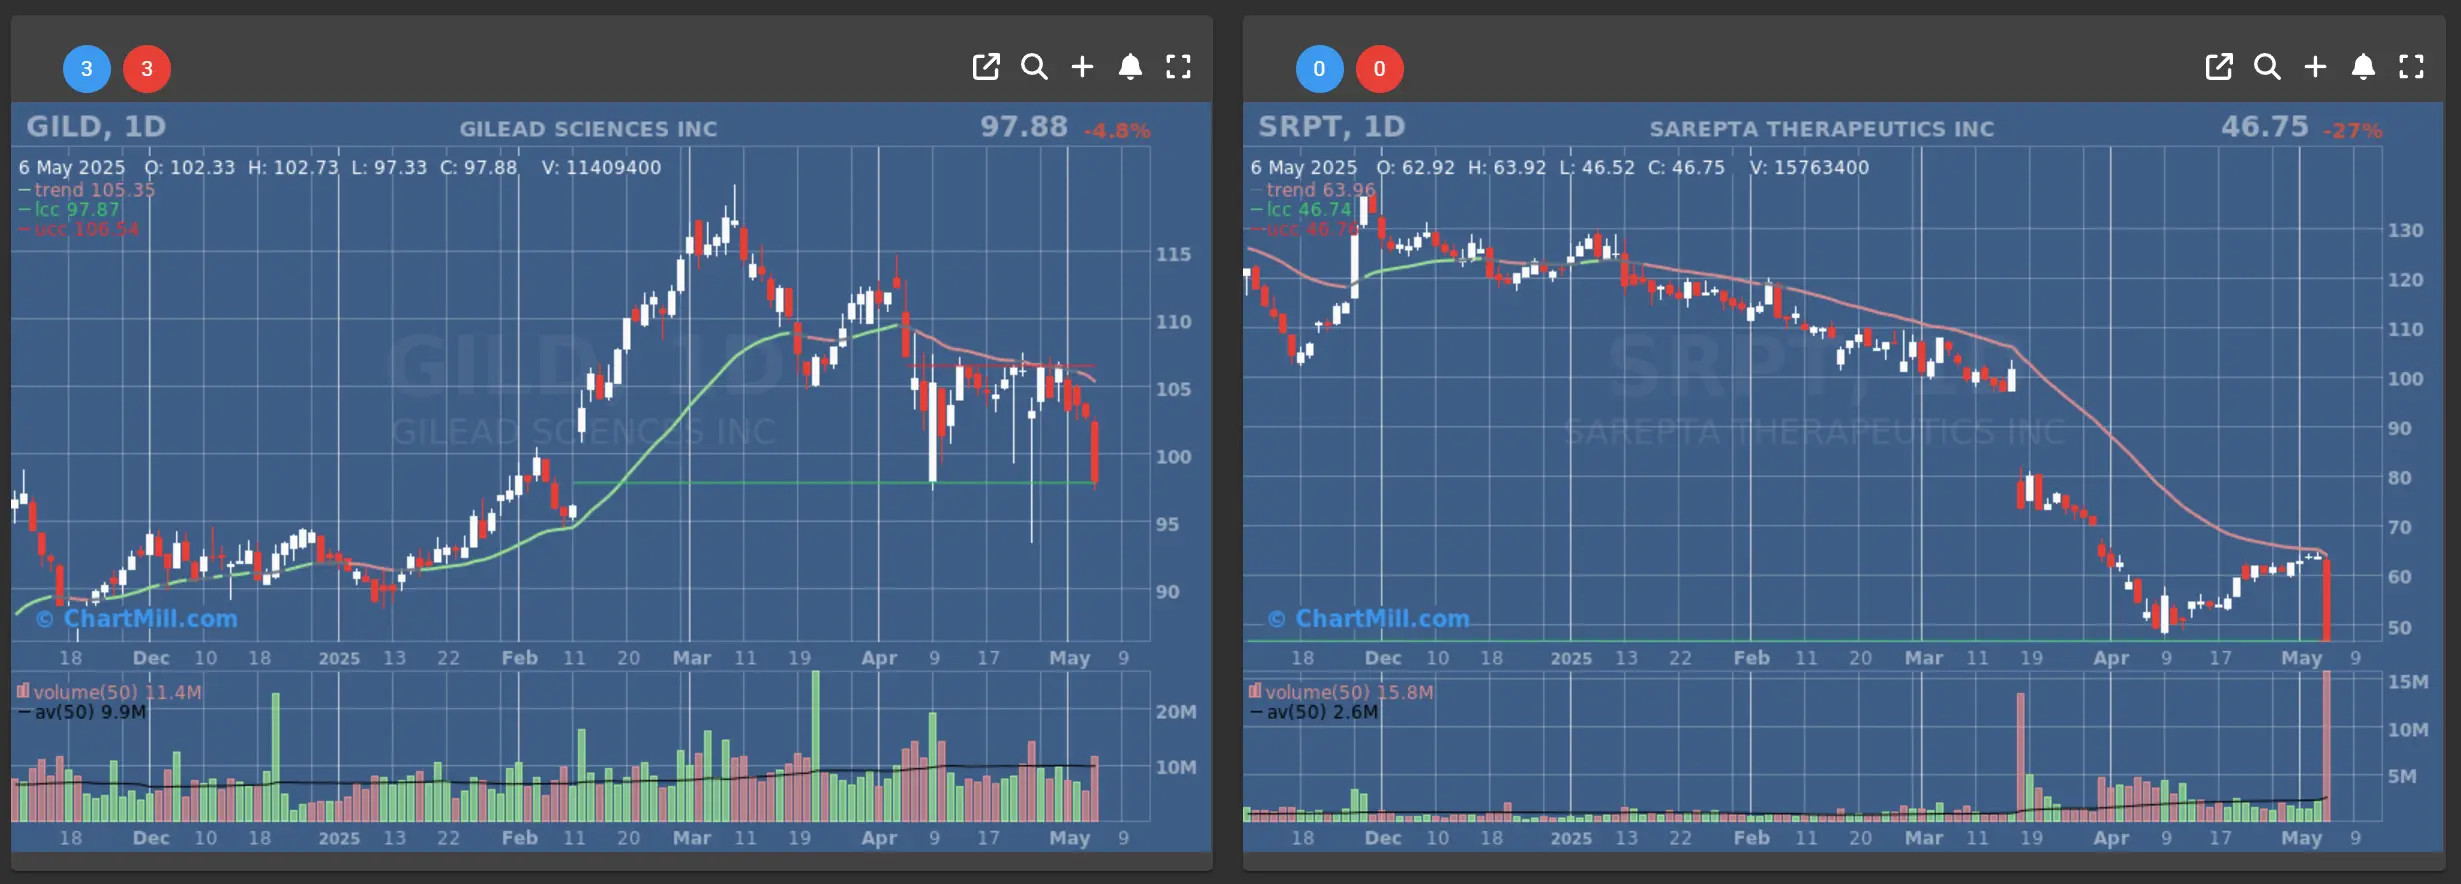
Sarepta Therapeutics (SRPT | -26.56%) dropped a staggering 23%, and Gilead Sciences (GILD | -4.8%) fell 5%, amid fears that Prasad’s influence could result in delayed approvals or stricter oversight on drug safety and efficacy.
Further weighing on sentiment, President Trump hinted at possible price caps for medications sold through the Medicaid program. This added to the already intense pressure on the pharmaceutical industry, pushing the S&P 500's pharmaceutical sub-index down 2.8%.
Palantir and DoorDash Under Pressure Despite Bold Moves
Outside of healthcare, several high-profile tech and consumer companies also made headlines.
Palantir Technologies (PLTR | -12.05%) beat revenue expectations and raised its full-year forecast, projecting $3.9 billion in 2025 revenue—a 36% increase over last year. Despite this, shares fell 12%, as investors likely viewed the stock as overbought following a 63% year-to-date surge after quadrupling in 2024.
Palantir Reports Strong Q1 Results and Boosts 2025 Outlook Amid Soaring AI Demand
DoorDash (DASH | -7.44%) also saw its stock tumble 7% after announcing a $1.2 billion acquisition of hospitality tech firm SevenRooms, aimed at expanding its Commerce Platform capabilities. The company reported $3 billion in revenue and $193 million in net income for the quarter, but these results came in below expectations, tempering enthusiasm around the acquisition.

Trade Talks Offer Some Hope, But Uncertainty Remains
Markets initially tried to rebound following comments from U.S. Treasury Secretary Scott Bessent, who said multiple trade deals could be finalized within the week. He hinted at a potential reduction in tariffs and downplayed the risk of an economic downturn. Although that optimism was short-lived, as ongoing geopolitical uncertainty - including new import duties dubbed "Liberation Day tariffs" introduced in April - continues to cloud the outlook.
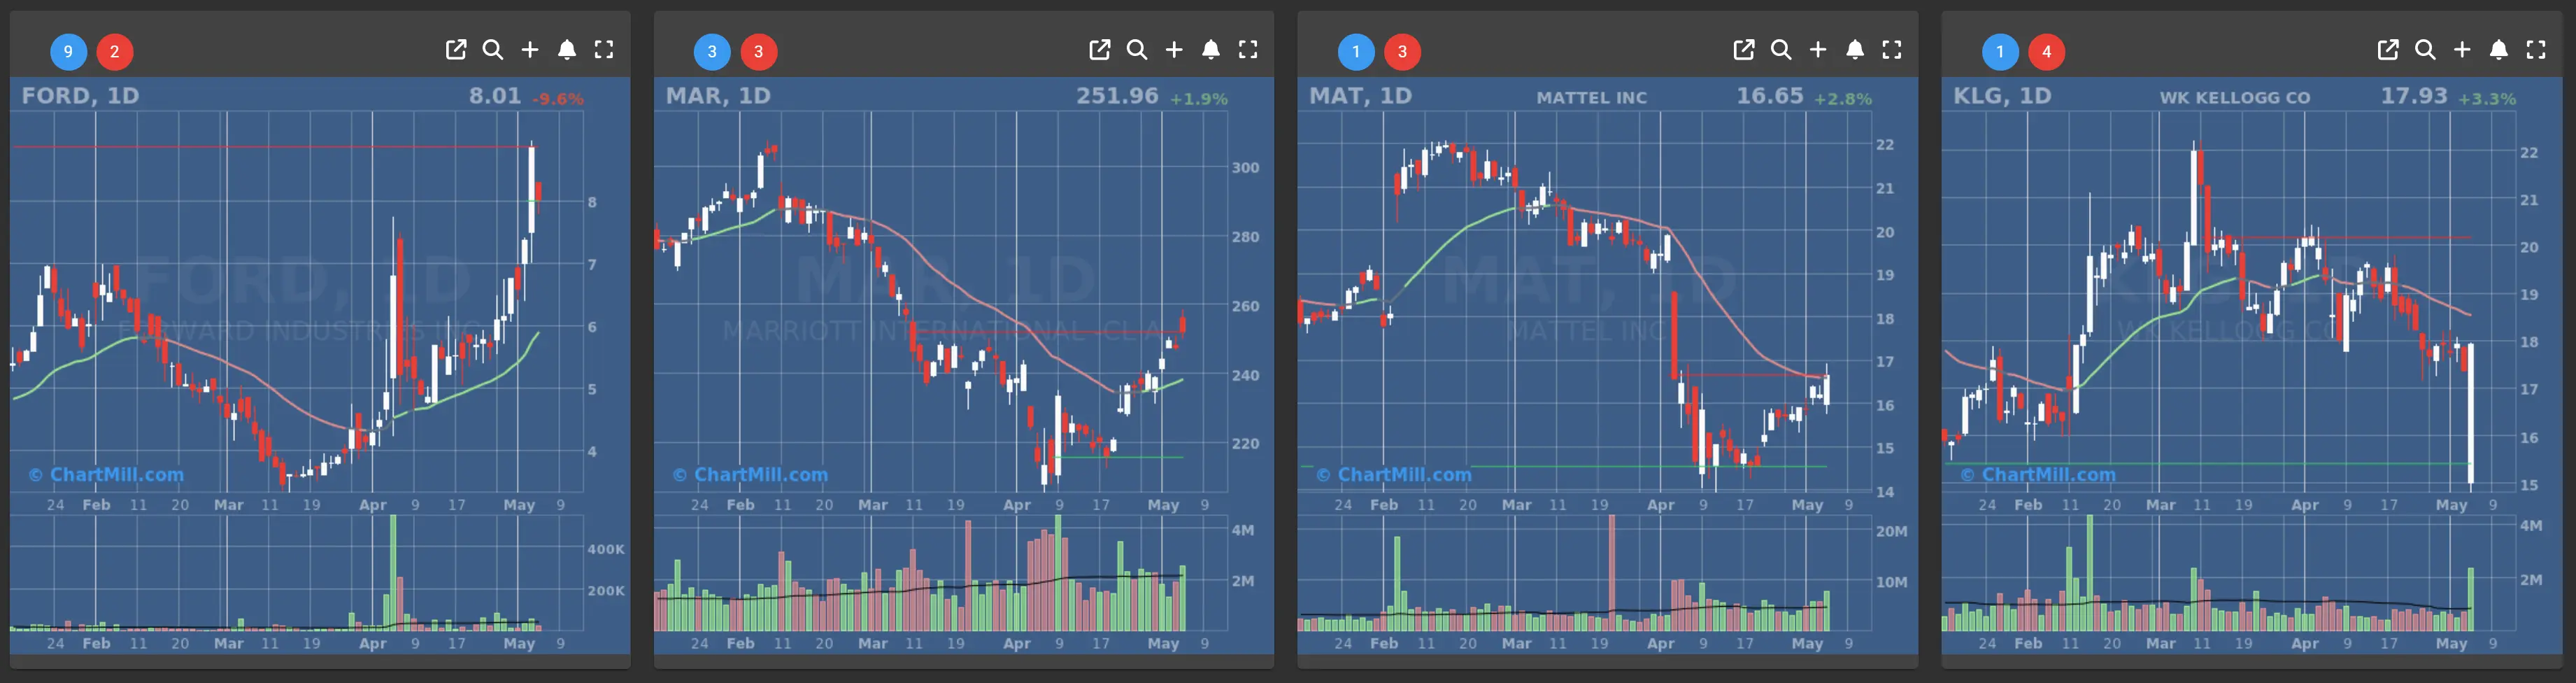
Adding fuel to the fire, several companies including Ford (FORD | -9.61%), Mattel (MAT | +2.78%), Kellogg (KLG | +3.28%), and Marriott (MAR | +1.9%) suspended their full-year forecasts, citing volatility in international trade policy. Ford in particular was hit hard, losing almost 10% on Tuesday despite relatively strong earnings.
Broader Market Movers: Winners and Losers
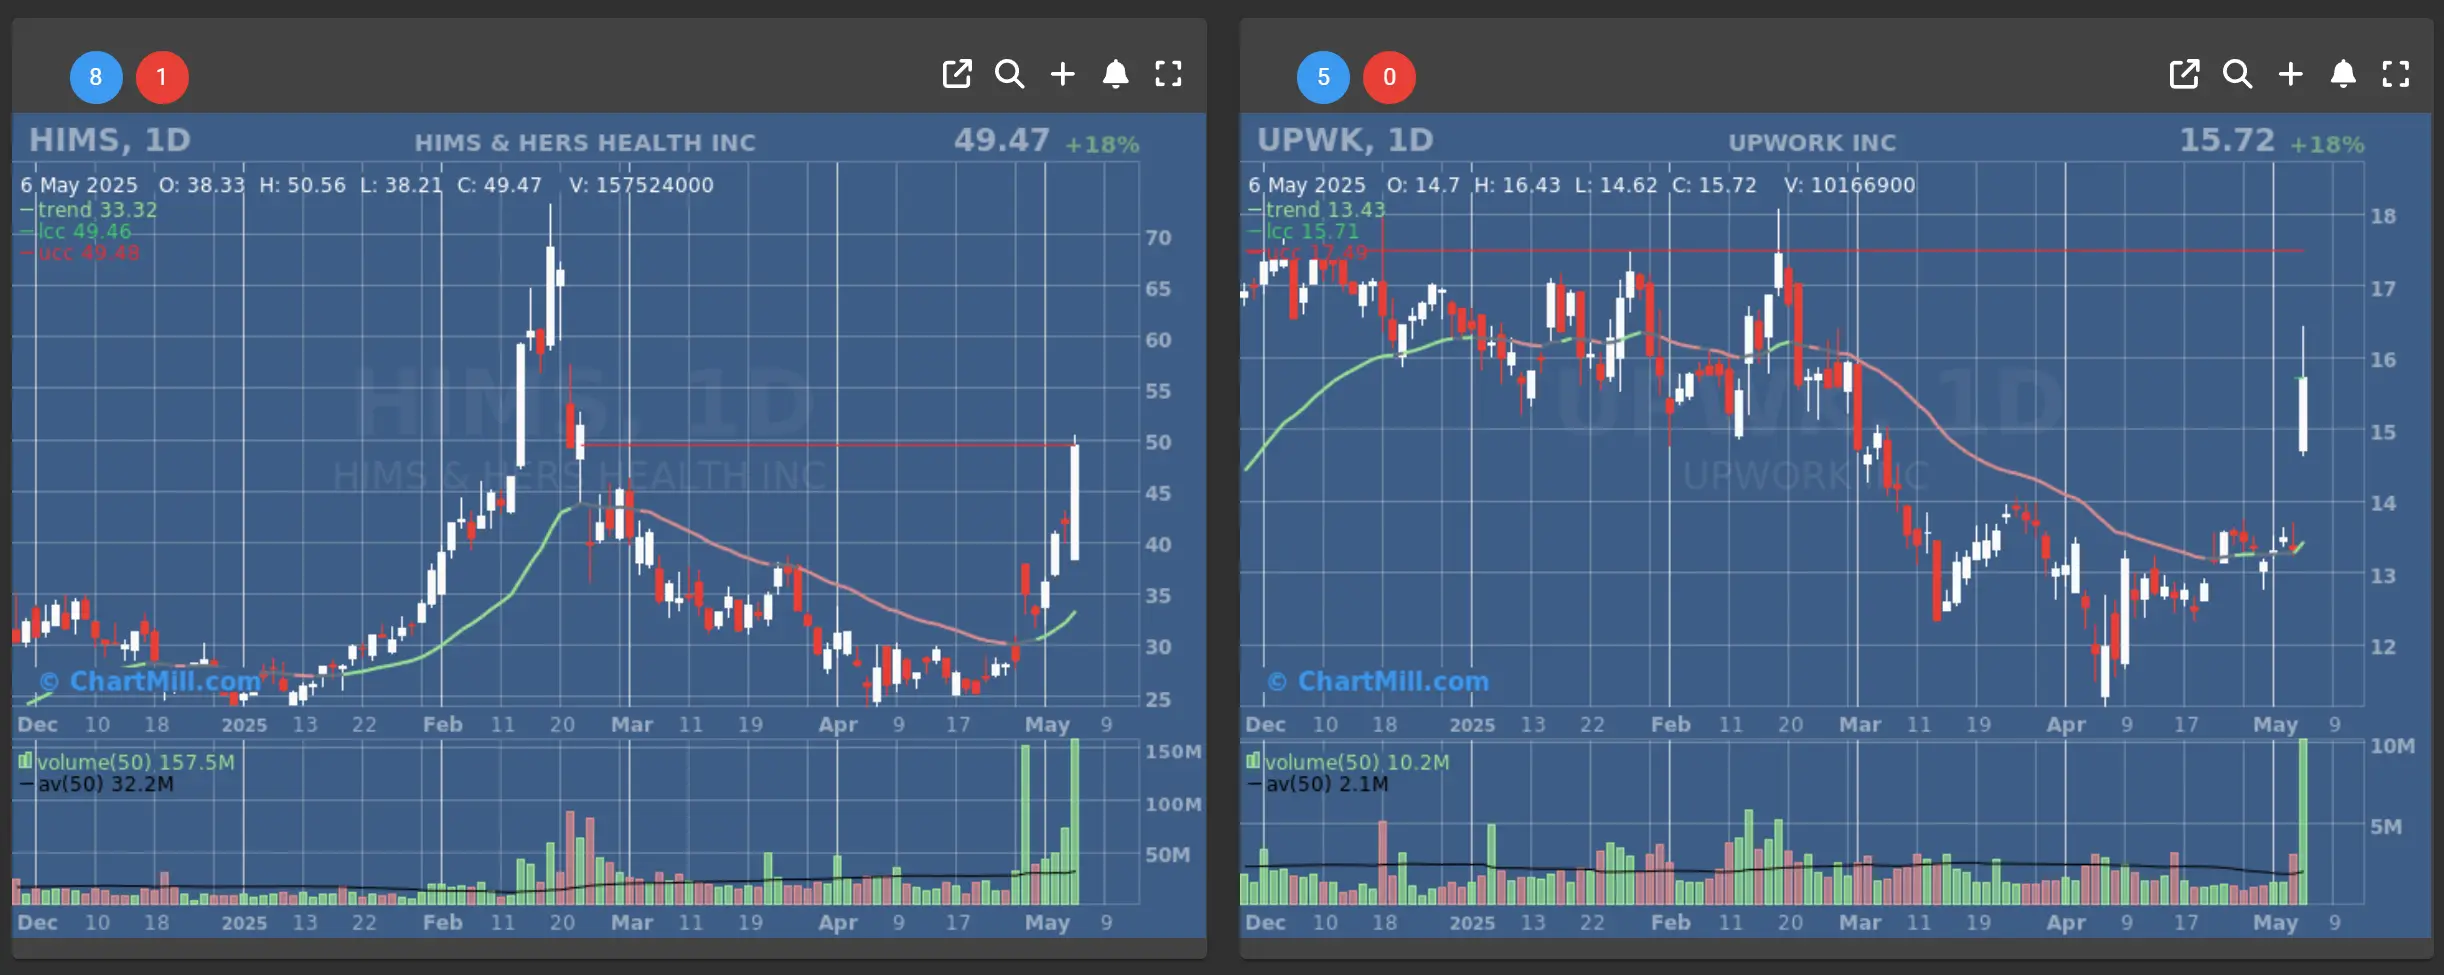
In a session dominated by red, a few stocks stood out on the positive side. Hims & Hers Health (HIMS | +18.12%) and Upwork (UPWK | +18.02%) both surged 18% following better-than-expected earnings reports.
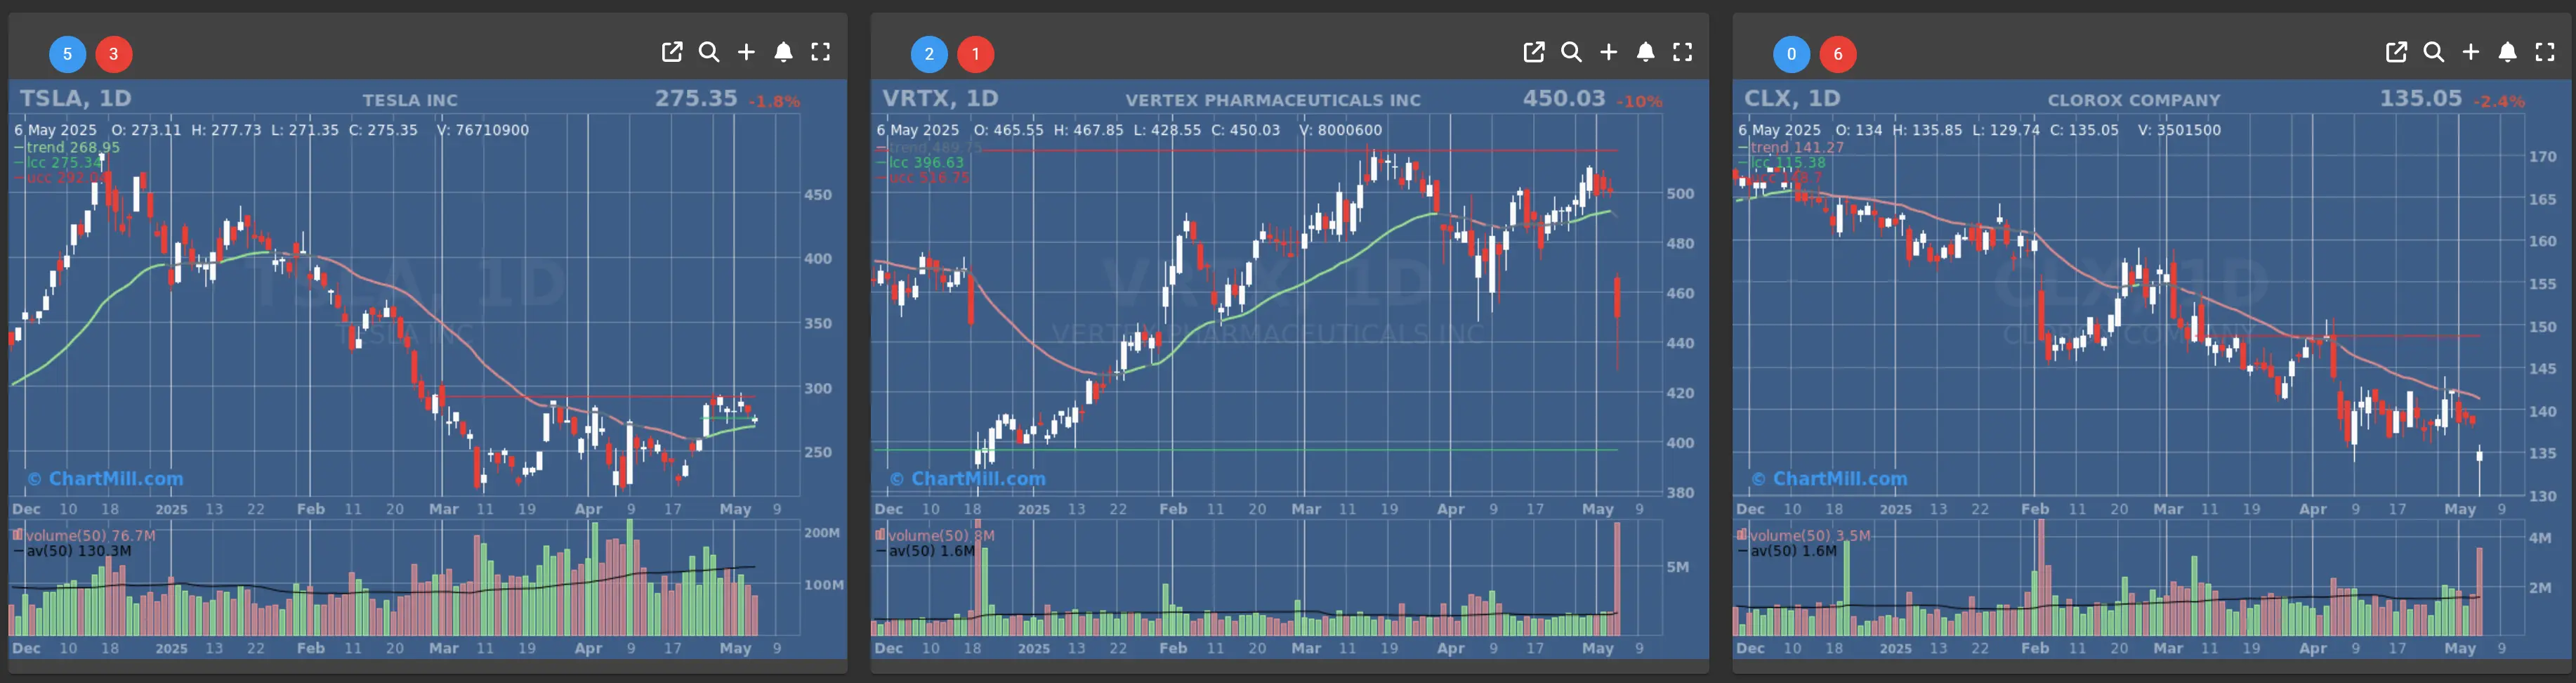
However, the list of decliners was longer. Tesla (TSLA | -1.75%) dropped 1.7%, Vertex Pharmaceuticals (VRTX | -10.03%) slid 10% after disappointing results, and Clorox (CLX | -2.41%) fell 2.4% on a downgraded outlook.
Even traditionally defensive stocks couldn’t escape the selloff, as rising oil prices and an expanding U.S. trade deficit added to investor concerns.
All Eyes on the Fed
Looking ahead, investors are keenly awaiting the Federal Reserve’s rate decision on Wednesday.
While the central bank is expected to hold rates steady in the 4.25–4.50% range, market participants will be paying close attention to Chair Jerome Powell’s commentary for clues about the direction of future policy amid a backdrop of economic fragility and mixed data.
Daily Market Analysis – May 6, 2025 (After Market Close)
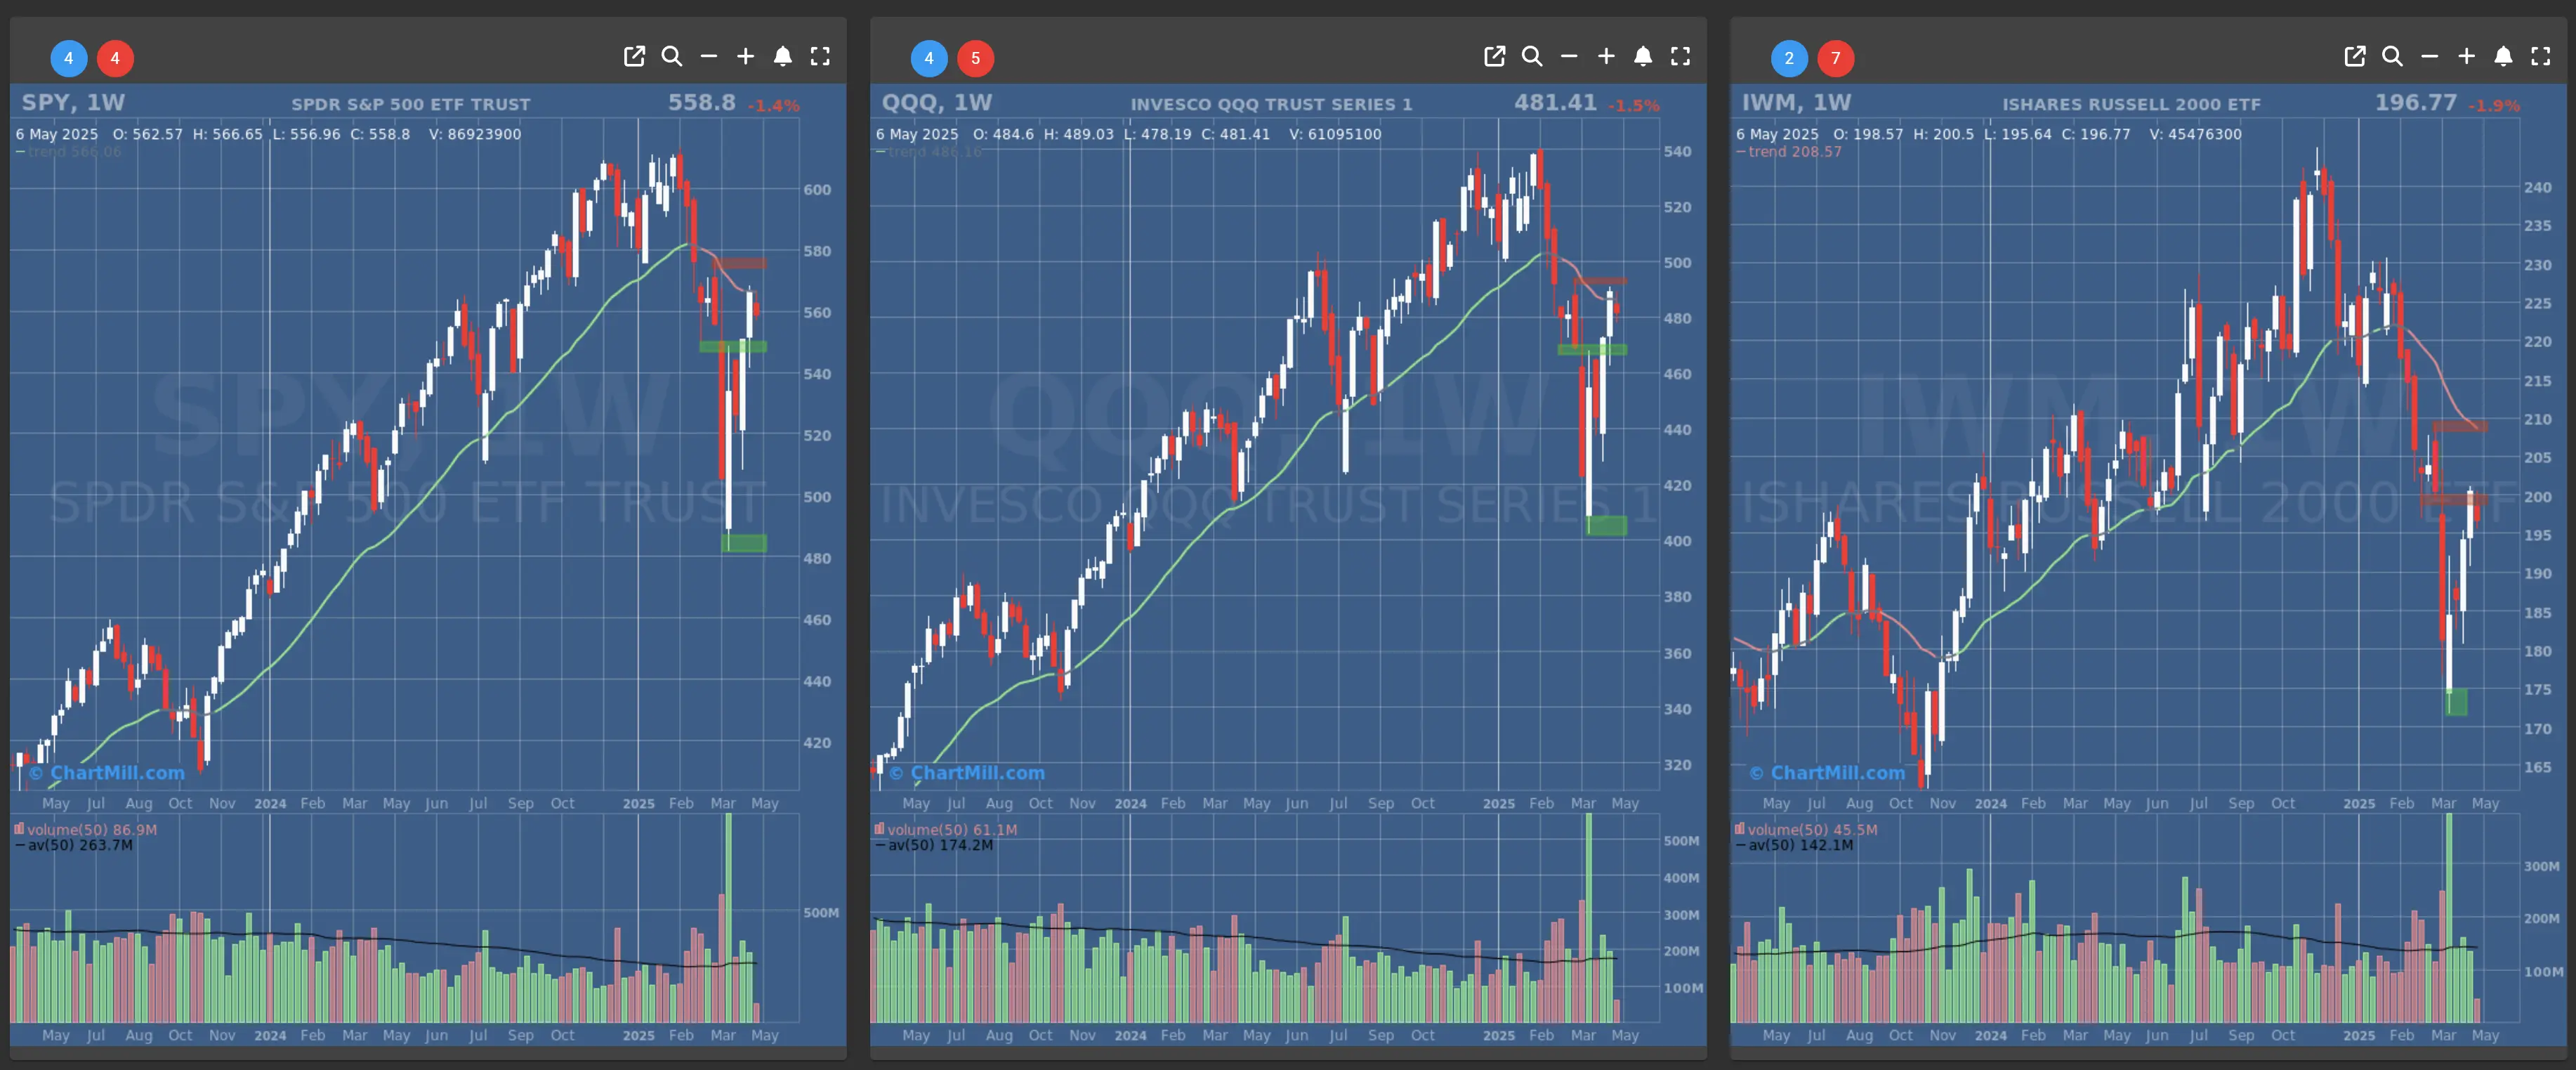
Short Term Trend
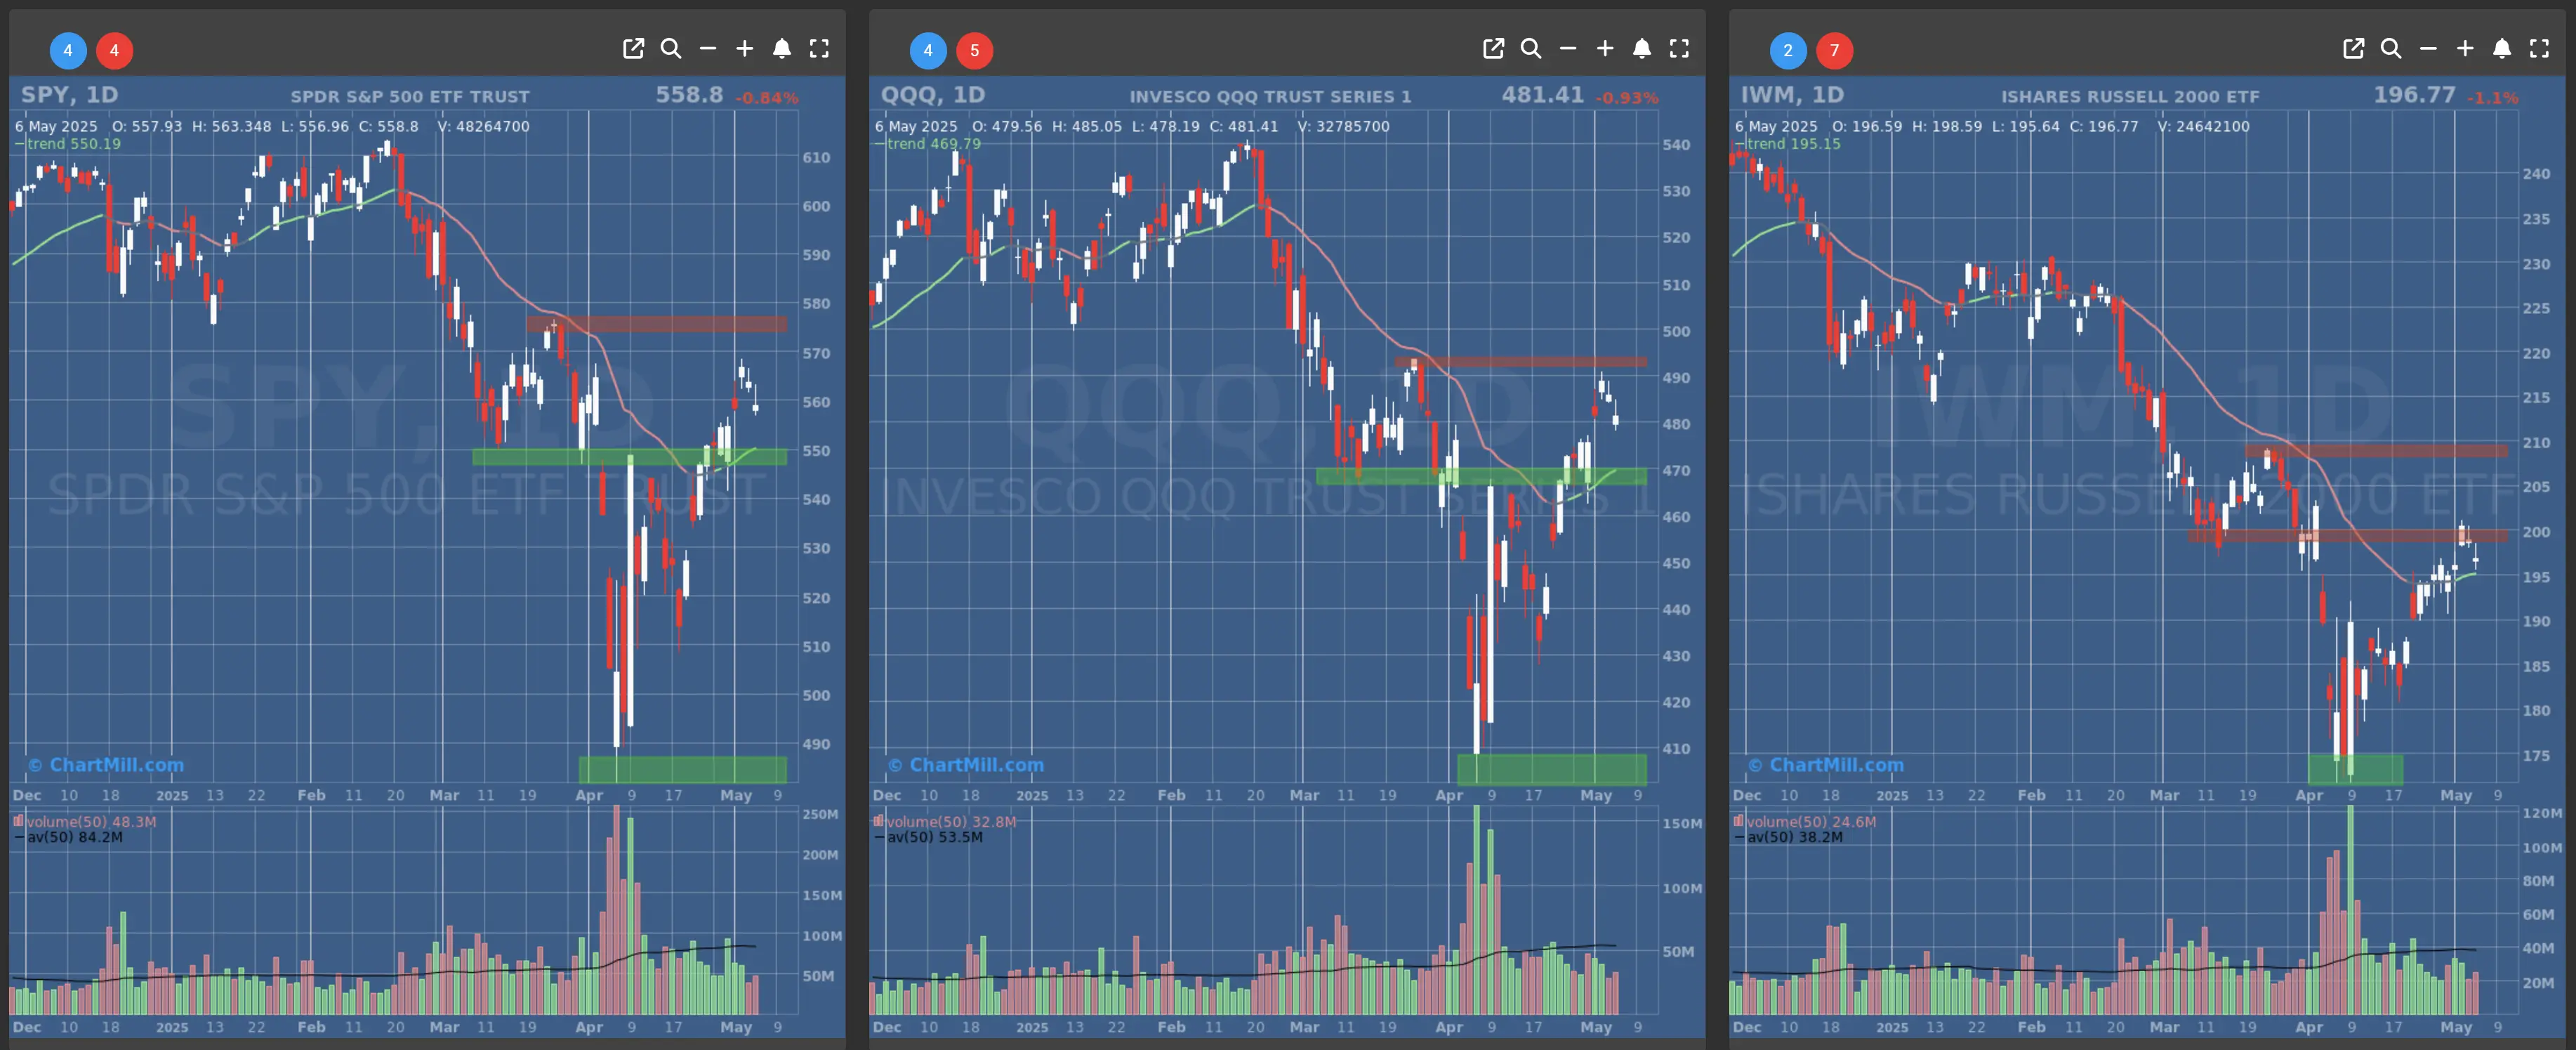
- Short-Term Trend: Bullish (no change)
- Support at $490 - $550
- Resistance at $580
- Volume: Significant below average (50)
- Pattern: Doji Candle - possible start of a bullish flag formation
- Short-Term Trend: Bullish (no change)
- Support at $470
- Resistance at $490
- Volume: Significant below average (50)
- Pattern: Doji Candle - possible start of a bullish flag formation
- Short-Term Trend: Bullish (no change)
- Support at $195
- Resistance at $210-215
- Volume: Significant below average (50)
- Pattern: Doji Candle - possible start of a bullish flag formation
Long Term Trend
- Long-Term Trend: Neutral (no change)
- Long-Term Trend: Neutral (no change)
- Long-Term Trend: Down (no change)
Market Breadth Analysis for May 6, 2025 (After Market Close)
The overall tone of the market breadth has shifted notably over the past week, moving from broadly bullish to bearish territory. Here's a breakdown of the key observations:
Short-Term Trend: Rapid Deterioration (May 2–6, 2025)
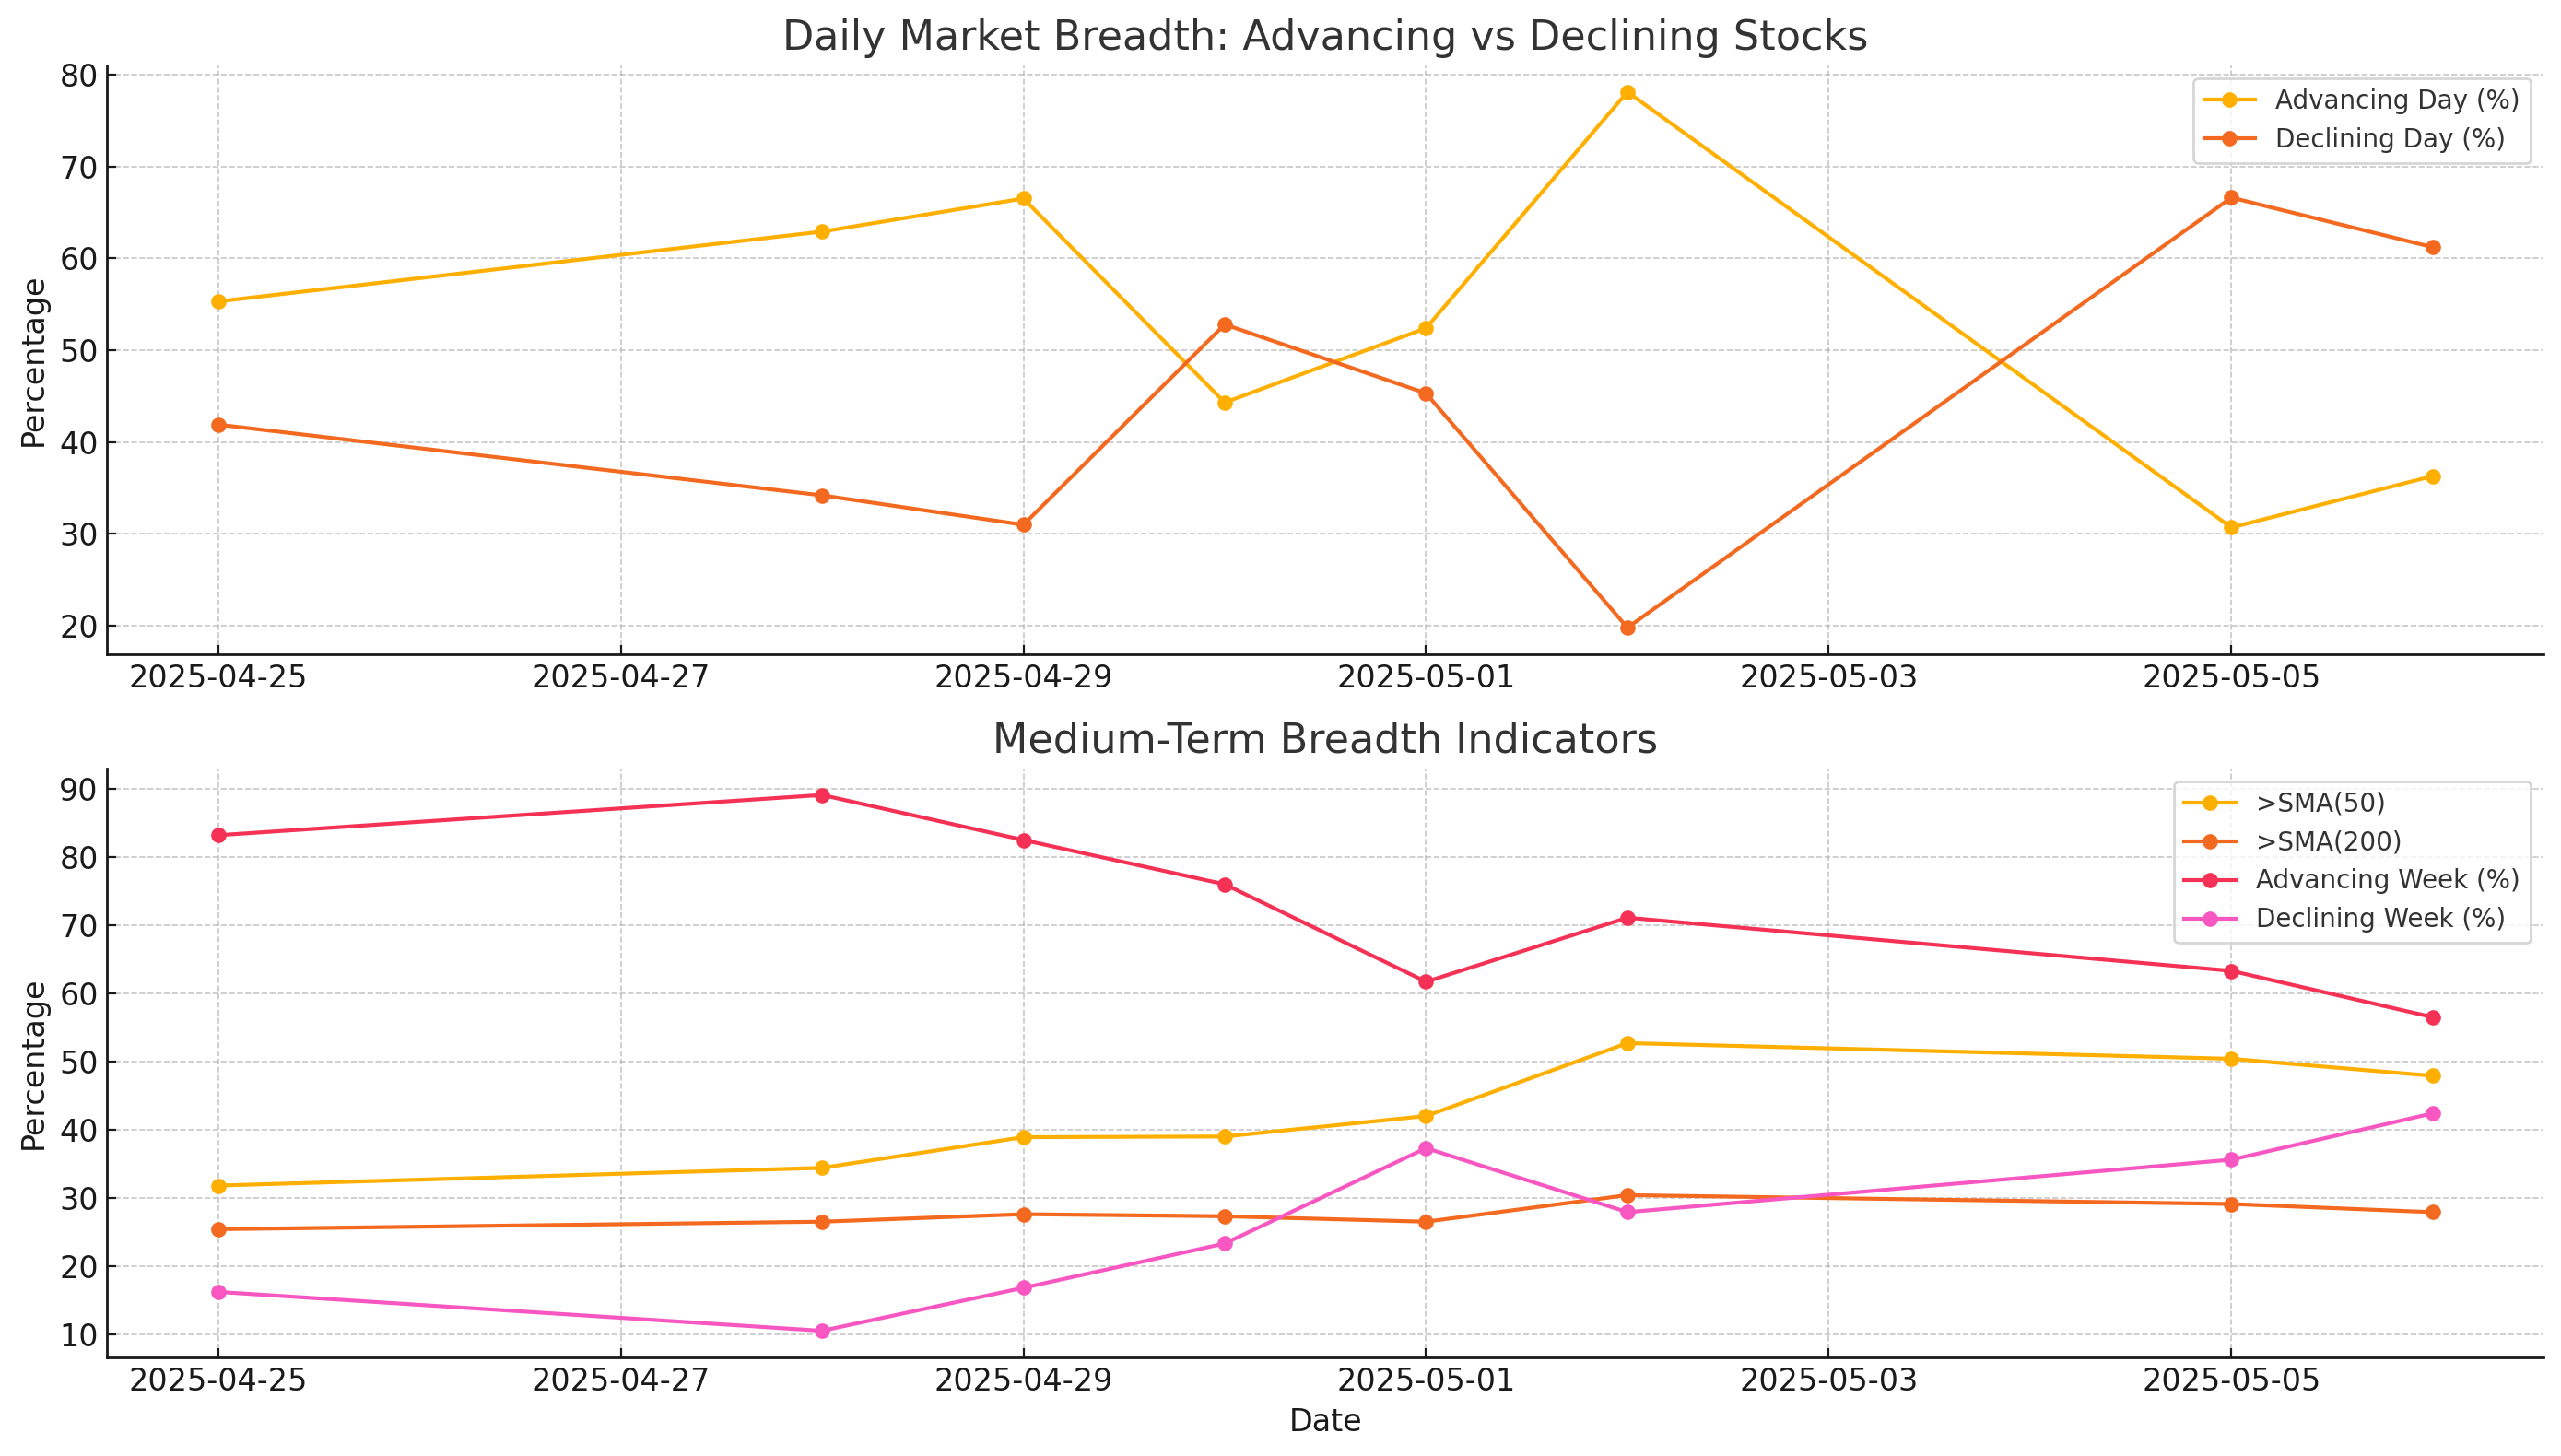
Advancing vs. Declining Stocks:
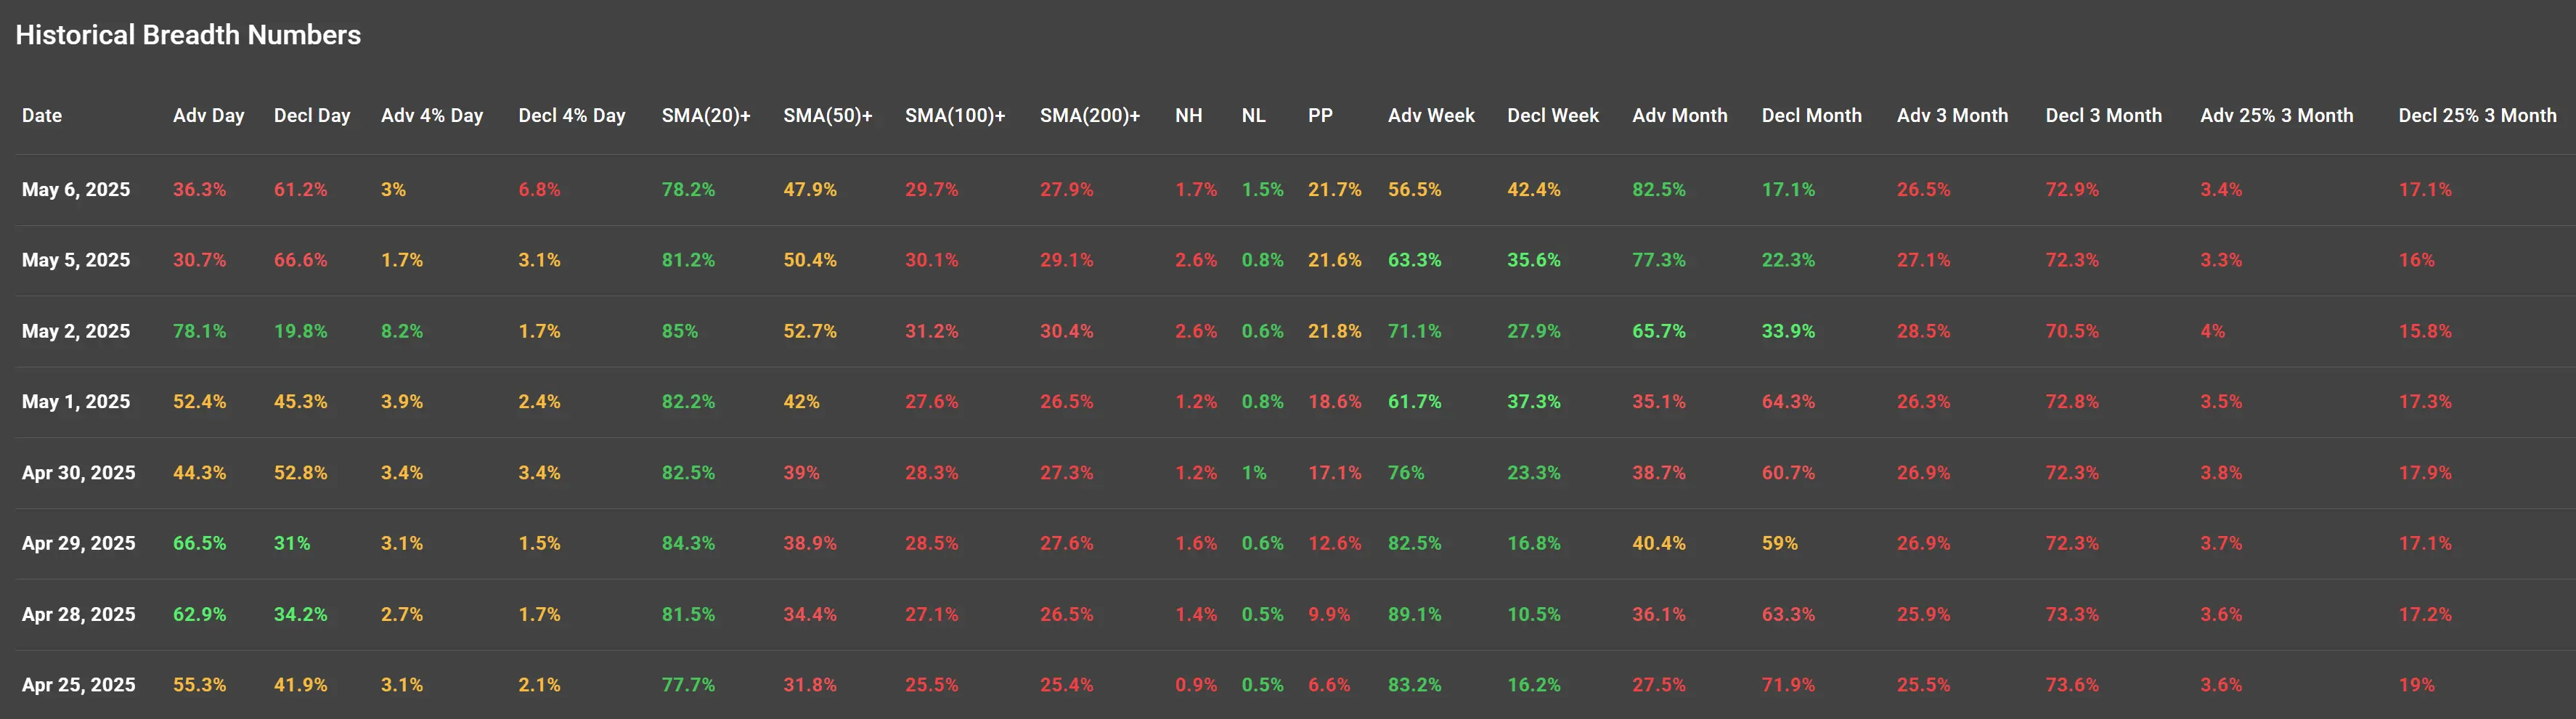
On May 2, advancing stocks dominated at 78.1%, but by May 6 this had dropped sharply to 36.3%, with declining stocks climbing to 61.2%. The two most recent sessions (May 5–6) both show strong decliner dominance, a clear negative shift.
High-Momentum Moves (±4%):
Only 3.0% of stocks rose more than 4% on May 6, while 6.8% declined more than 4%. This negative skew signals increased downside volatility.
Stocks Above Key Moving Averages: As of May 6:
-
SMA(20): 78.2% (still strong, but declining)
-
SMA(50): 47.9% (a warning sign as it drops below 50%)
-
SMA(100) and SMA(200): Both below 30%, signaling weakening medium-to-long-term breadth
Intermediate Trend: Weakening Weekly and Monthly Momentum
Weekly Breadth (Adv Week vs. Decl Week):
-
May 6 shows 56.5% advancing, down from 71.1% on May 2.
-
Decliners rising to 42.4%, signaling growing internal weakness.
Monthly Breadth:
-
May 6 still reflects 82.5% of stocks up over the month, which is strong.
-
However, Adv Month peaked at 40.4% on April 29 and has been trending down.
-
Decliners for the month rose to 17.1%, indicating a slow deterioration under the surface.
Three-Month Breadth:
-
Adv 3M remains high at 26.5%, but has not improved over the last five sessions.
-
Decl 3M consistently high (above 70%)—showing longer-term weakening.
Other Notable Indicators
-
New Highs (NH) vs. New Lows (NL):
-
New highs collapsed from 2.6% on May 2 to just 1.7% on May 6.
-
New lows ticked up slightly to 1.5%, a warning that downside pressure is increasing.
-
Percentage of Stocks Above 25% Gain in 3 Months dropped slightly to 3.4% on May 6.
-
Meanwhile, 17.1% of stocks are down more than 25% over 3 months—a bearish imbalance.
Pivot Point (PP) Breadth:
- Fell to 21.7% on May 6, suggesting fewer stocks are holding above key technical levels.
Conclusion: Momentum Breaking Down
The data clearly signals a shift in market breadth from bullish to bearish:
-
Short-term breadth has deteriorated sharply, with two consecutive days of heavy selling pressure.
-
Fewer stocks are trading above medium- and long-term moving averages, and new highs are shrinking.
-
Despite strong monthly stats, weekly and 3-month indicators are weakening—suggesting the rally is losing internal strength.
-
Unless breadth stabilizes quickly, the risk of a broader market pullback is rising.

