After market: 685.97 +0.28 (+0.04%)
After market: 625.51 0.03 (0%)
Market News
Unilever’s Ice Cream Spinoff Magnum Set to Test Markets Alone
Hemnet Battles Stock Slide as Rivals Chip Away at Its Grip
Ray Dalio says Middle East is becoming a 'Silicon Valley of capitalists’
Billionaire Howard Says Abu Dhabi Can Rival London as Global Hub
China’s trade surplus hits $1tn for first time despite Trump’s tariffs – business live


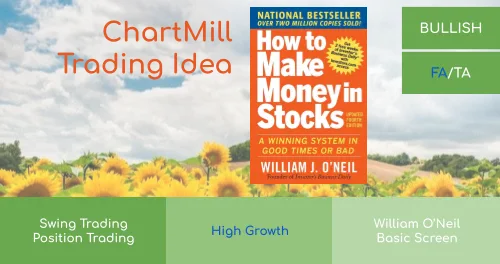
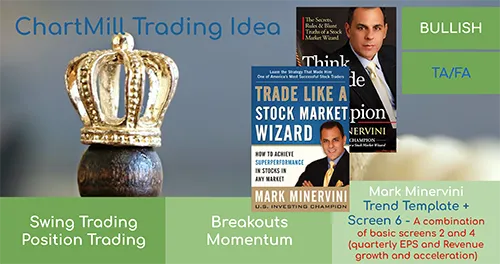
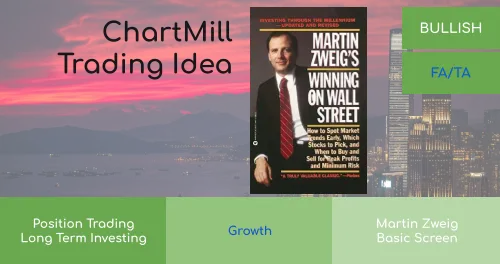
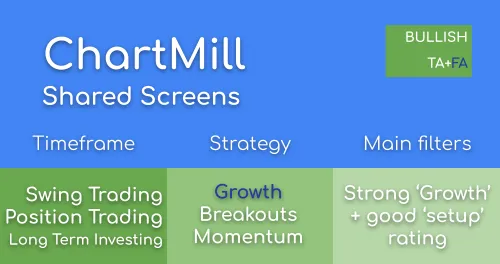
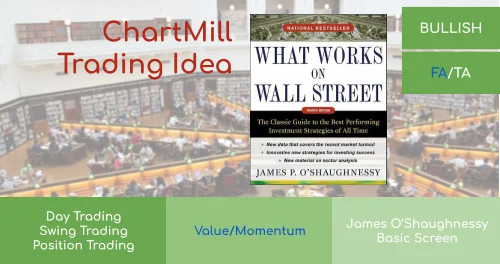
Discover: ChartMill Trading and Investment Ideas
ChartMill provides a huge library of pre-configured screens to get you started. You can easily fine tune these screens to your own needs.
Combining Technical and Fundamental Analysis for Position Trading in High Growth systems, Swing Trading based on Technical Analysis or pure Fundamental Analysis for long term Growth, Value or Quality investments ... it's all there!


Discover ChartMill
Smart Tools for Smart Traders and Investors
ChartMill provides tools for individual investors who take control of their investing. Find your next trade or investment with our Technnical and Fundamental Stock Screener, do your analysis and stay organized with Watchlists and Alerts.
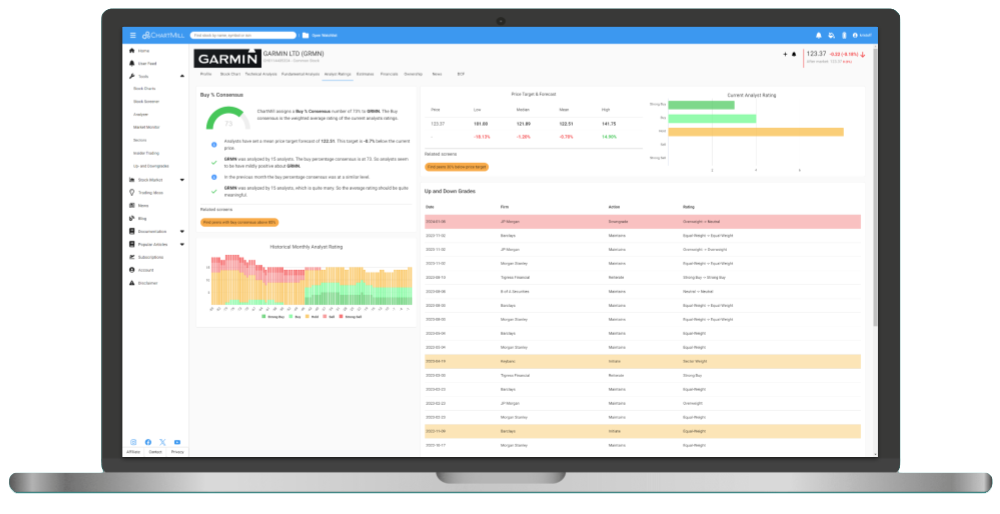

Technical and Fundamental Stock Screener
The ChartMill stock screener is one of the most advanced screeners on the market and is suited for a wide range of strategies. Whether you use Technical Analysis for short term day- or swing trading, Fundamental Analysis for long term Growth, Value, Quality or Dividend investing or combine both for Growth Position Trading, we've got you covered.