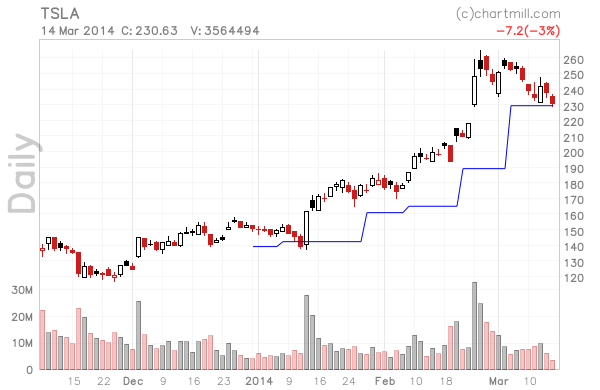
5BP and 7BP Swing Point or Fractal Stop
The 5BP or 7BP Swing Point or Fractal Stop indicator is available in the stock charts and displays the value of a stop below (or above) a position.
The stop price is moved up or down every time a 5 or a 7 ‘bar pattern’ is discovered. This is also called a ‘swing point stop or fractal stop ’. A 5 bar pattern is a pattern where the middle candle shows a low below the lows of the 2 candles to its right and left. A 7 bar pattern is a pattern where the middle candle shows a low below the lows of the 3 candles to its right and left. So the stop is moved at swing points in the trend.
The indicator is shown on the chart below:
The first parameter is the candle where the Fractal Stop is initiated. This parameter is 50 by default and it can be changed manually to the specific candle where the trade was started.
The last parameter for the stops is an initial level for the stop. Once the moving stop value becomes higher than the initial stop, it will take over. This parameter is 0 by default and is optional.
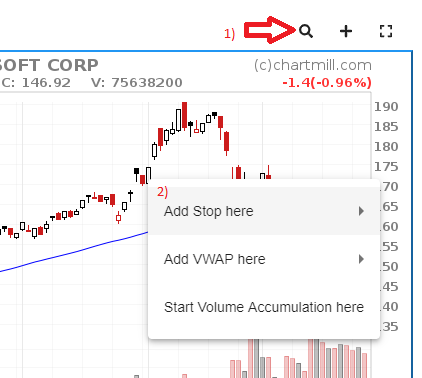
Anchored Indicators can be added from the chart
The 5BP or 7BP Swing Point or Fractal Stop’ are so called anchored indicators. Anchored indicators have a parameter that indicates on which candle the indicator needs to anchored. For ease of use you can add these indicators on the chart itself by just pointing at the candle where you want to anchor it to. This can be done by:
- Click the inspect icon above the chart to enable candle details while you hover over the chart.
- Find the candle where you want to anchor an indicator to, right click and select the desired indicator.