
The search for growth stocks at reasonable prices remains a cornerstone strategy for investors seeking to balance expansion potential with valuation discipline. The "Affordable Growth" approach specifically targets companies demonstrating strong growth trajectories while maintaining sound financial health and profitability, all without demanding excessive valuation premiums. This methodology helps identify firms positioned to deliver sustainable returns without the speculative froth often associated with high-growth names.
WORKDAY INC-CLASS A (NASDAQ:WDAY) emerges as a notable candidate through this screening lens. The enterprise cloud application provider, specializing in finance and human resources solutions, demonstrates the fundamental characteristics that align with affordable growth criteria.
Growth Trajectory
Workday's growth profile stands out as particularly solid, scoring a 7 out of 10 in the growth component of ChartMill's fundamental analysis. The company has demonstrated:
- 25.19% earnings per share growth over the past year
- 30.89% average annual EPS growth over multiple years
- 13.94% revenue growth in the most recent year
- 18.42% average annual revenue growth historically
Future expectations remain healthy with projected EPS growth of 14.60% and revenue growth of 12.66% annually. While these forward estimates represent some moderation from historical rates, they still indicate strong expansion potential within the competitive enterprise software landscape.
Valuation Assessment
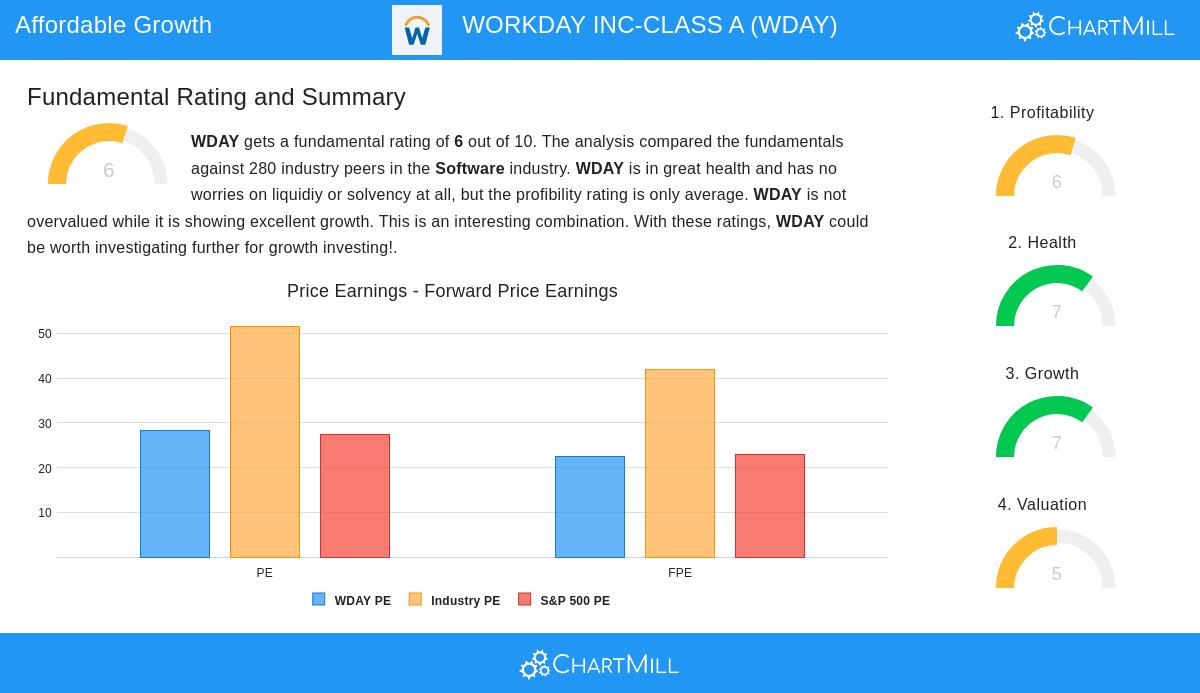
Scoring 5 out of 10 on valuation, Workday presents a balanced valuation picture that aligns with the affordable growth philosophy. Key metrics include:
- P/E ratio of 28.32, trading cheaper than 68.57% of software industry peers
- Forward P/E of 22.57, below 73.57% of industry competitors
- Enterprise Value/EBITDA ratio indicating cheaper valuation than 65.71% of sector companies
- PEG ratio suggesting appropriate valuation relative to growth expectations
The valuation metrics become particularly interesting when considering that Workday trades roughly in line with S&P 500 averages despite operating in a typically higher-multiple software sector. This relative valuation discount, combined with above-average growth prospects, creates the valuation-growth dynamic that affordable growth investors seek.
Financial Health and Profitability
Workday's financial health score of 7 reflects solid balance sheet fundamentals, including:
- Strong liquidity position with current and quick ratios of 2.10
- Manageable debt levels with debt-to-equity of 0.33
- Good solvency metrics including Altman-Z score of 5.19
- Conservative debt-to-free-cash-flow ratio of 1.25
The company's profitability score of 6 shows room for improvement but demonstrates positive trends:
- Return on assets of 3.25% outperforming 68.93% of industry peers
- Return on equity of 6.36% exceeding 70% of competitors
- Improving profit margins with net margin of 6.51% and operating margin of 8.58%
- Consistent positive cash flow generation over multiple years
Strategic Positioning
Workday's business model, providing essential enterprise applications for finance and HR through cloud-based solutions, positions the company in growing market segments. The shift toward digital transformation and cloud adoption continues to drive demand for the company's offerings across its 11,000+ organizational customers.
The combination of strong growth metrics, reasonable valuation relative to growth prospects, solid financial health, and improving profitability creates a profile that aligns well with affordable growth objectives. While not without areas for improvement, particularly in maximizing profitability, the overall fundamental picture suggests a company growing sustainably without excessive valuation risk.
For investors interested in exploring more companies that meet these affordable growth criteria, additional screening results are available through ChartMill's Affordable Growth Screen.
Disclaimer: This analysis is based on fundamental data and screening criteria provided through ChartMill's analytical tools. It is presented for informational purposes only and should not be construed as investment advice or a recommendation to buy, sell, or hold any security. Investors should conduct their own research and consult with a qualified financial advisor before making investment decisions.