
Investors looking to find promising growth chances often use a two-part method, joining the forward-looking view of fundamental analysis with the timing clues of technical analysis. One such tactic involves searching for stocks that show solid basic business growth, supported by good financials and profit, while also displaying a positive technical arrangement on their price charts. This approach tries to find companies with the fundamental driver for long-term value increase, at a time when their stock price might be ready for a near-term rise from a time of sideways movement.
WORKDAY INC-CLASS A (NASDAQ:WDAY) stands as a possible candidate found through this view. As a supplier of enterprise cloud applications for finance and human resources, Workday works in the large and continually increasing market for digital business change. The company's fundamental picture points to a business that is performing well, while its recent stock price movement displays a formation that frequently comes before a notable price shift.
Fundamental Growth Picture
The foundation of this tactic is finding companies with solid and maintainable growth, a main trait of successful growth stocks as described in our opening section. Workday's fundamental report shows it fits this central requirement. The company gets a firm Growth Rating of 7 out of 10, supported by notable historical results and good future outlooks.
- Past Results: Over the last year, Workday increased its Earnings Per Share (EPS) by 24.89% and its Revenue by 13.16%. More significantly, the longer-term patterns are positive, with a 5-year yearly EPS increase rate of 30.89% and Revenue increase of 18.42%.
- Future Outlooks: Analysts forecast this pace to carry on, with expected future yearly EPS increase of 17.80% and Revenue increase of 12.58%. While these forward projections show a slowing from the very high past rates, they still represent a "quite strong growth" path, which is necessary for a growth stock candidate.
Beyond pure growth, the tactic needs "acceptable profit and health" to make sure the company is financially stable and turning sales into earnings. Workday's Profit and Financial Health ratings both are at a neutral 6/10. A closer examination reveals positive points that back the growth story:
- Profit Strengths: The company has firm margins, with an Operating Margin of 15.55% and a Profit Margin of 13.10%, each doing better than over 80% and 74% of its software industry competitors, in turn. Its Return on Invested Capital (ROIC) of 9.29% is also higher than the industry average.
- Financial Health Examination: Workday keeps a sound balance sheet with a low Debt/Equity ratio of 0.34 and a firm Altman-Z score of 4.91, showing low near-term bankruptcy danger. A clear positive is its Debt to Free Cash Flow ratio of 1.16, meaning it could in theory pay off all its debt with just over a year's worth of cash flow, a signal of high ability to pay debts.
You can see the full details of this fundamental evaluation in the detailed fundamental analysis report for WDAY.
Technical Arrangement for a Possible Rise
While fundamentals give the "why" for a long-term investment, technical analysis aids with the "when." A firm technical arrangement, marked by a time of sideways movement after a trend, can point to a gathering of force that may come before the next price move. Workday's present chart formation shows such a situation.
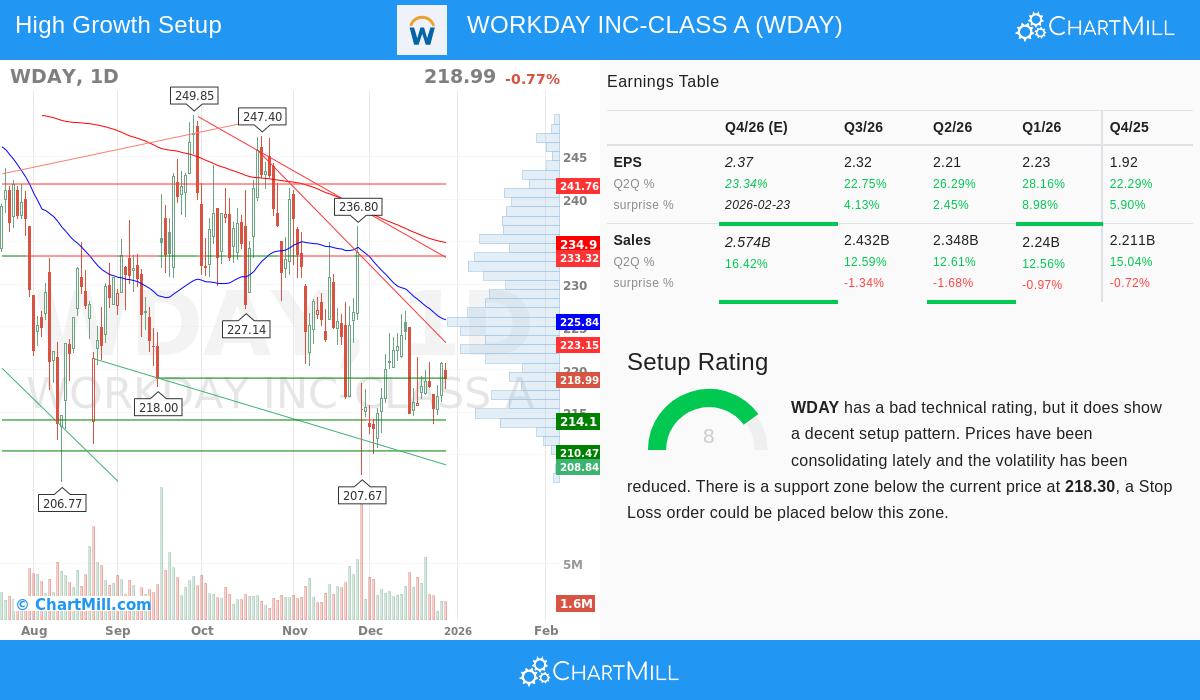
According to the technical report, Workday gets a low total technical rating of 1/10, mainly because its stock trades below important long-term and short-term moving averages, putting it in a negative trend compared to the wider market. However, the more detailed and key finding for this tactic is its high Setup Rating of 8/10.
- Sideways Movement Time: The report states that over the past month, WDAY has been trading in a set range between about $210 and $227. It is now trading in the middle of this range, where "prices have been moving sideways recently."
- Lowered Instability & Set Support: This sideways movement has resulted in lowered instability, a common sign before a price rise. The examination finds an important support area ranging from $214.10 to $218.30, made by a mix of trend lines and moving averages. The nearness of this support level below the present price gives a fairly clear technical risk level.
- Rise Meaning: The arrangement suggests that if the stock price can gain enough force to push past resistance levels above the present range, the first notable resistance sits around $219, it could signal the start of a new upward shift. This technical shape is what the search tactic looks for: a fundamentally firm stock coming out of a time of rest.
For a picture of this price movement and support/resistance levels, see the full technical analysis for WDAY.
Valuation Background
For a growth stock, valuation is often less important than growth rate, but it is still a factor. Workday's Valuation Rating is a neutral 5/10. Its Price-to-Earnings (P/E) ratio of 25.23 is similar to the current S&P 500 average and is viewed as less expensive than about 68% of its software industry competitors, which trade at a much higher average P/E. When growth is included via the PEG ratio, the valuation seems more acceptable, giving something to investors for the company's expected earnings growth.
Conclusion
WORKDAY INC-CLASS A shows a case where a firm fundamental growth story meets a possibly favorable technical formation. The company shows the needed numerical standards for a growth stock, increasing revenue and earnings, while keeping the profit and financial health needed for longevity. Technically, the stock's recent sideways movement and high setup rating suggest it may be forming a base for its next shift, giving a set entry point for investors who think its growth story stays true.
This examination of WDAY came from a specific search for firm growth stocks with positive technical arrangements. If this method fits your investment style, you can look at other possible candidates that meet similar standards. Find more stocks with firm growth and hopeful technical arrangements by using this set search.
Disclaimer: This article is for information only and does not make up financial advice, a suggestion, or an offer or request to buy or sell any securities. The information given is based on supplied data and should not be the only base for any investment choice. Investing includes risk, including the possible loss of principal. Always do your own study and think about talking with a qualified financial advisor before making any investment choices.