(All data & visualisations by ChartMill.com)
Daily Market Trend Analysis – June 18, 2025 (After Market Close)
Markets were closed on thursday, June 19 (Juneteenth).
Investors took a wait-and-see approach, the SPY and QQQ moved barely. IWM gained half a percent, supported by the SMA(20)
Short Term Trend
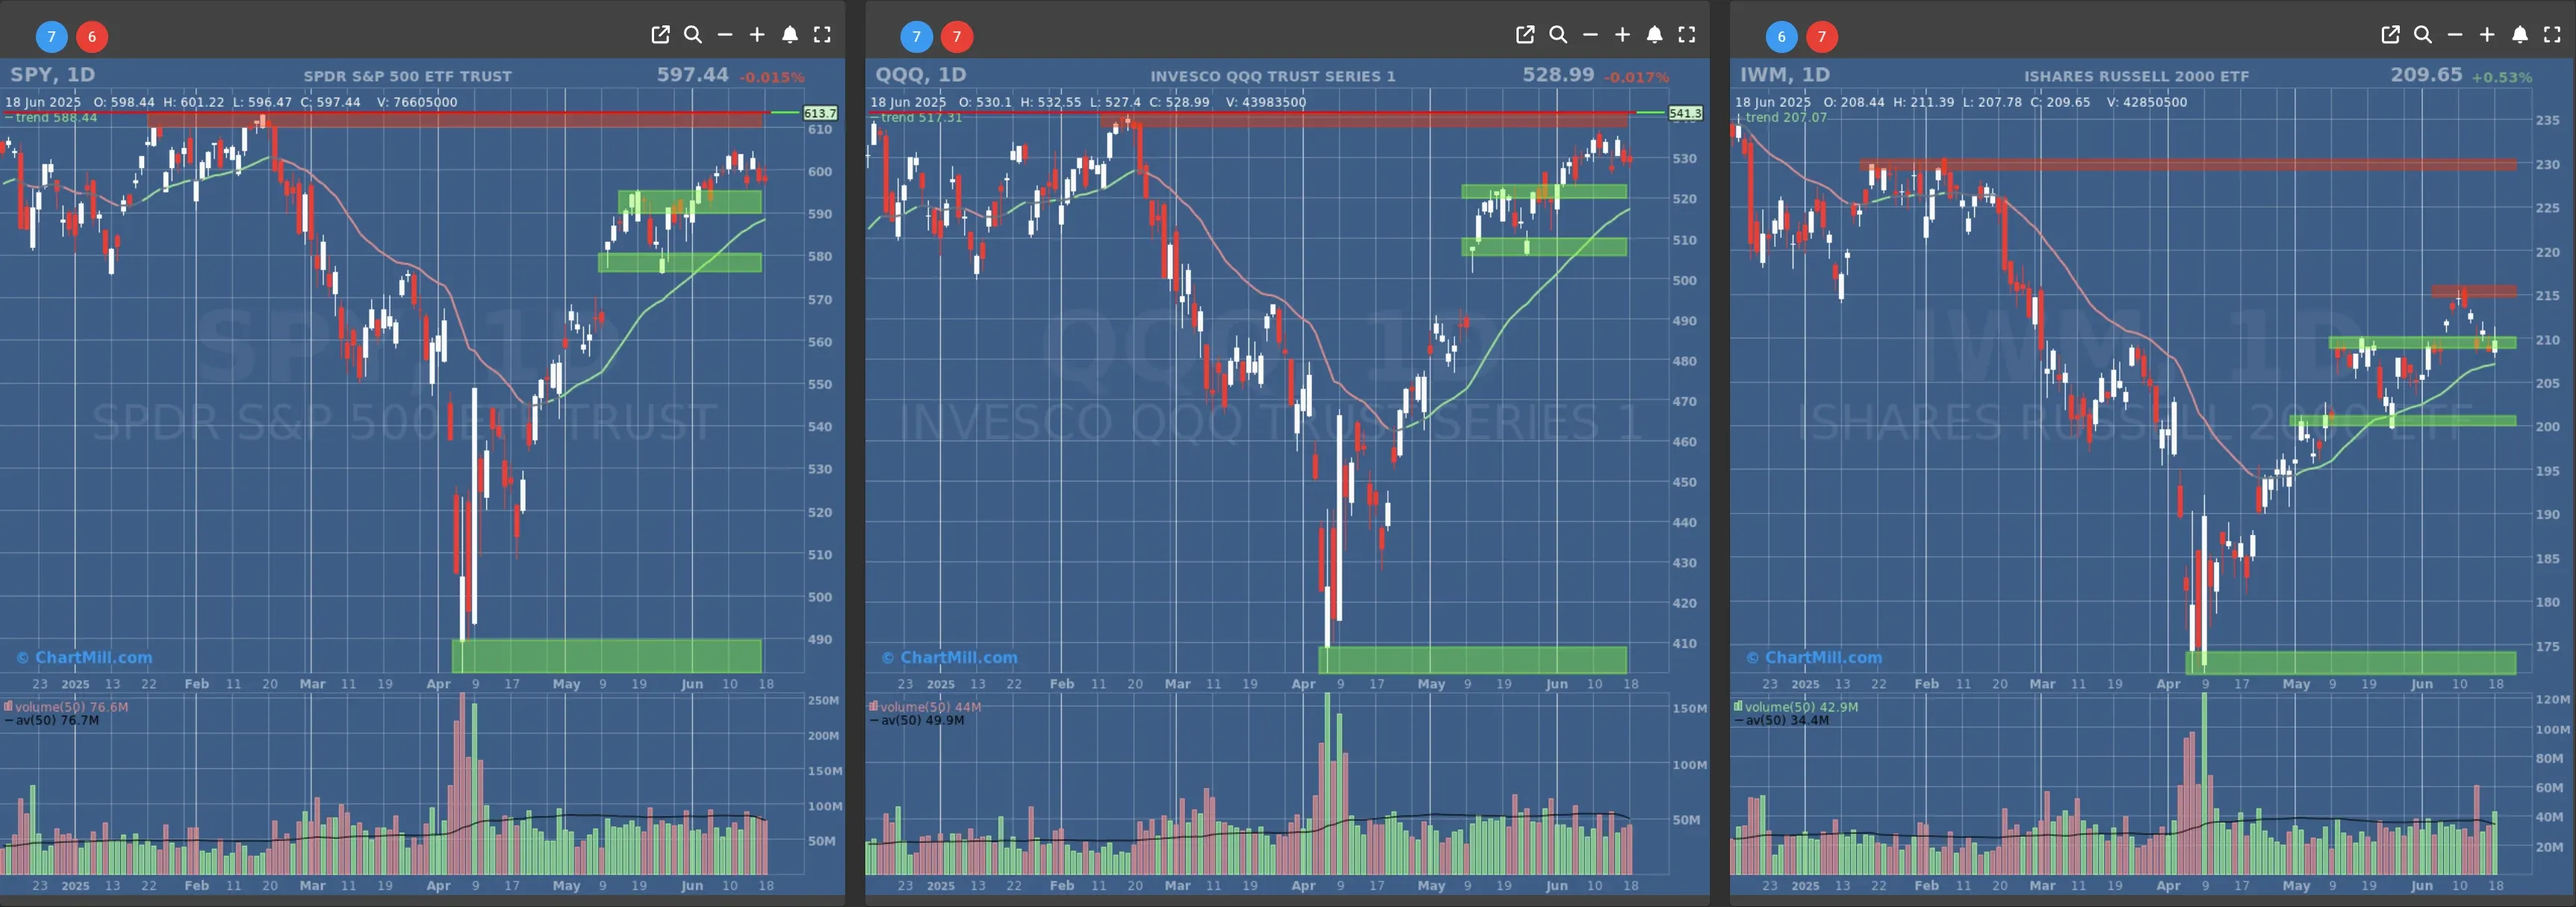
- Short-Term Trend: Bullish (no change)
- Next Support at $580
- Next Resistance at $610
- Volume: At Average (50)
- Pattern: Narrow Range Day
- Short-Term Trend: Bullish (no change)
- Next Support at $520
- Next Resistance at $540
- Volume: Slightly Below Average (50)
- Pattern: Narrow Range Day
- Short-Term Trend: Bullish (no change)
- Next Support at $210 & $205
- Next Resistance at $215 & $230
- Volume: Above Average (50)
- Pattern: Up day from Support
Long Term Trend
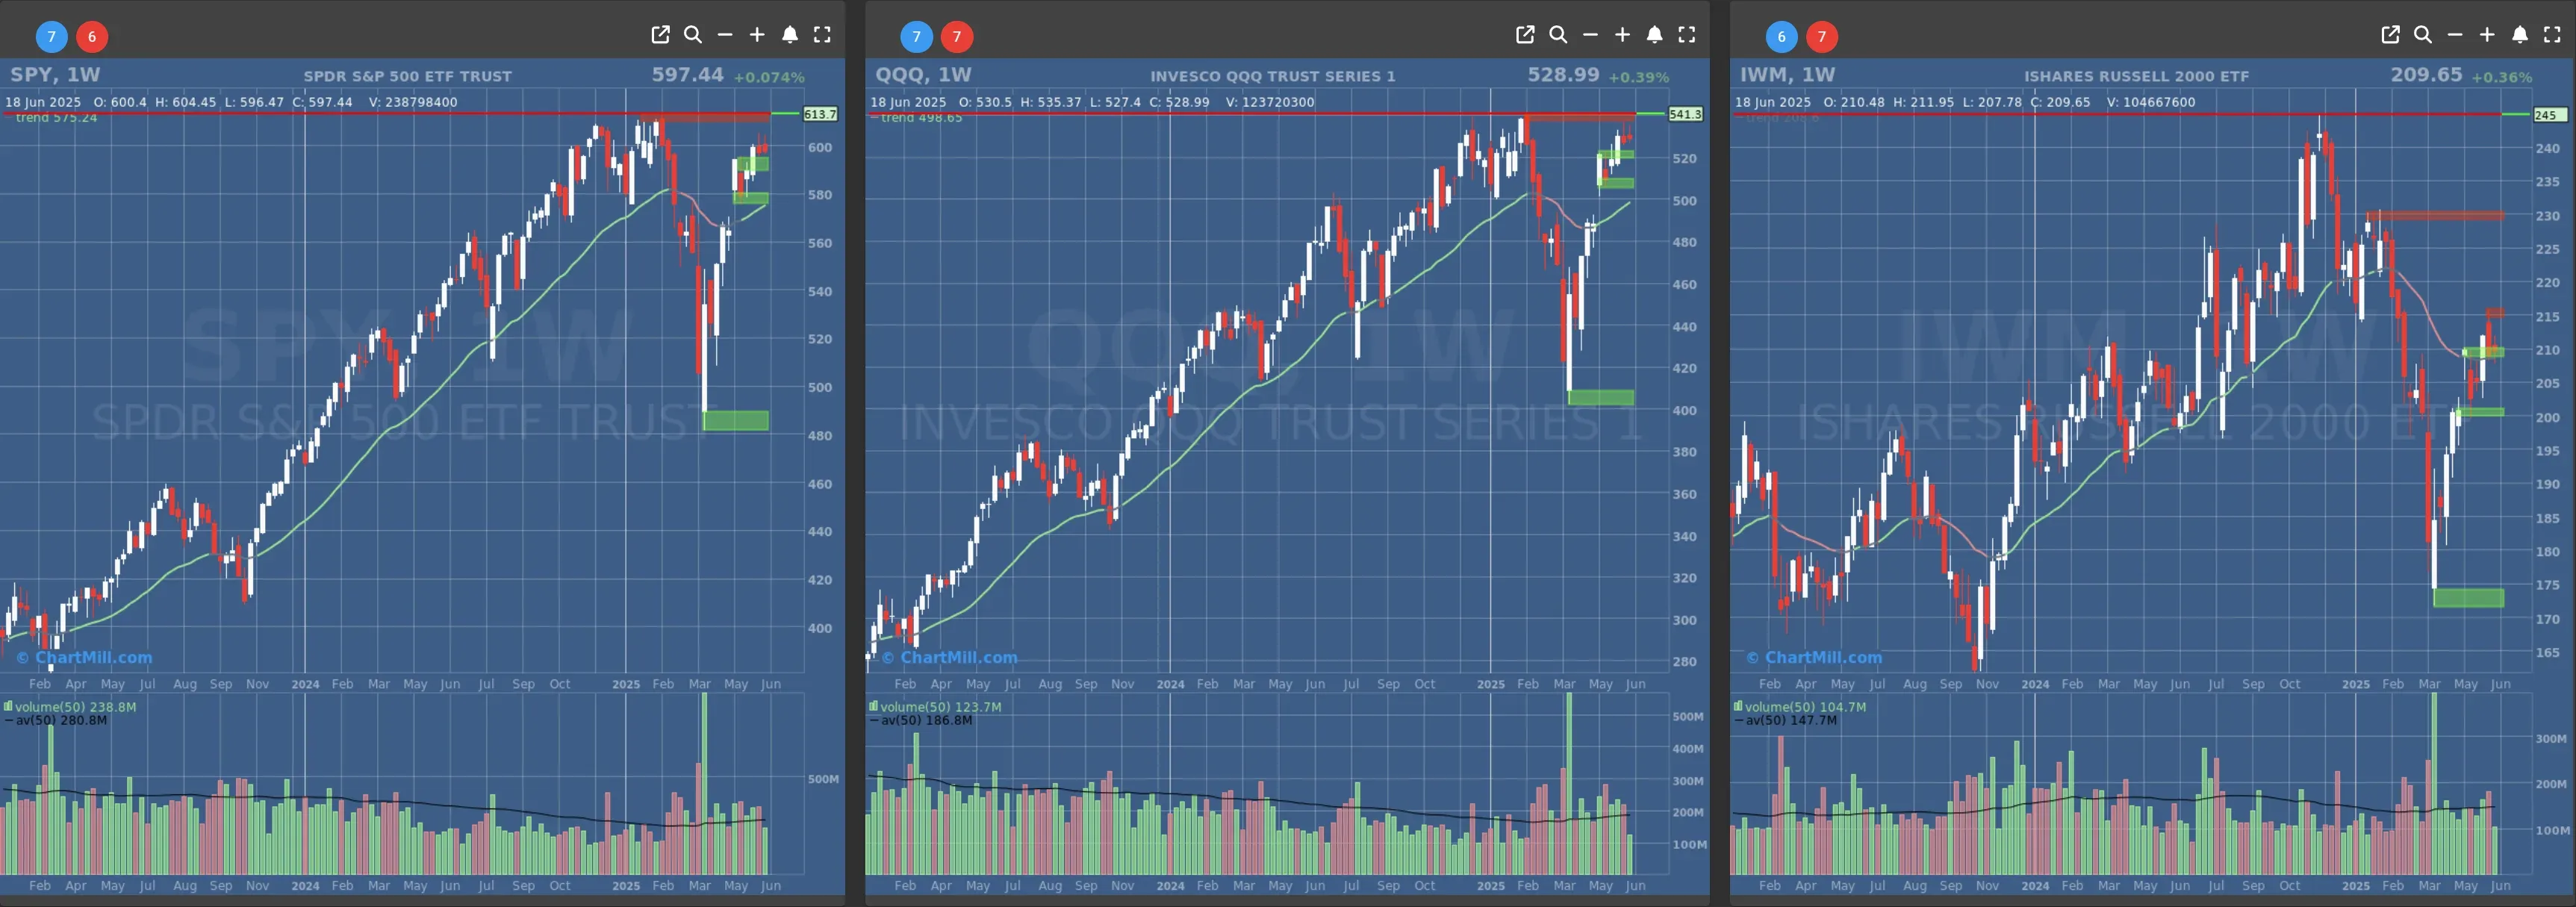
- Long-Term Trend: Positive (no change)
- Long-Term Trend: Positive (no change)
- Long-Term Trend: Neutral (changed from positive) - not confirmed, weekcandle closes on friday
Daily Market Breadth Analysis – June 18, 2025 (After Market Close)
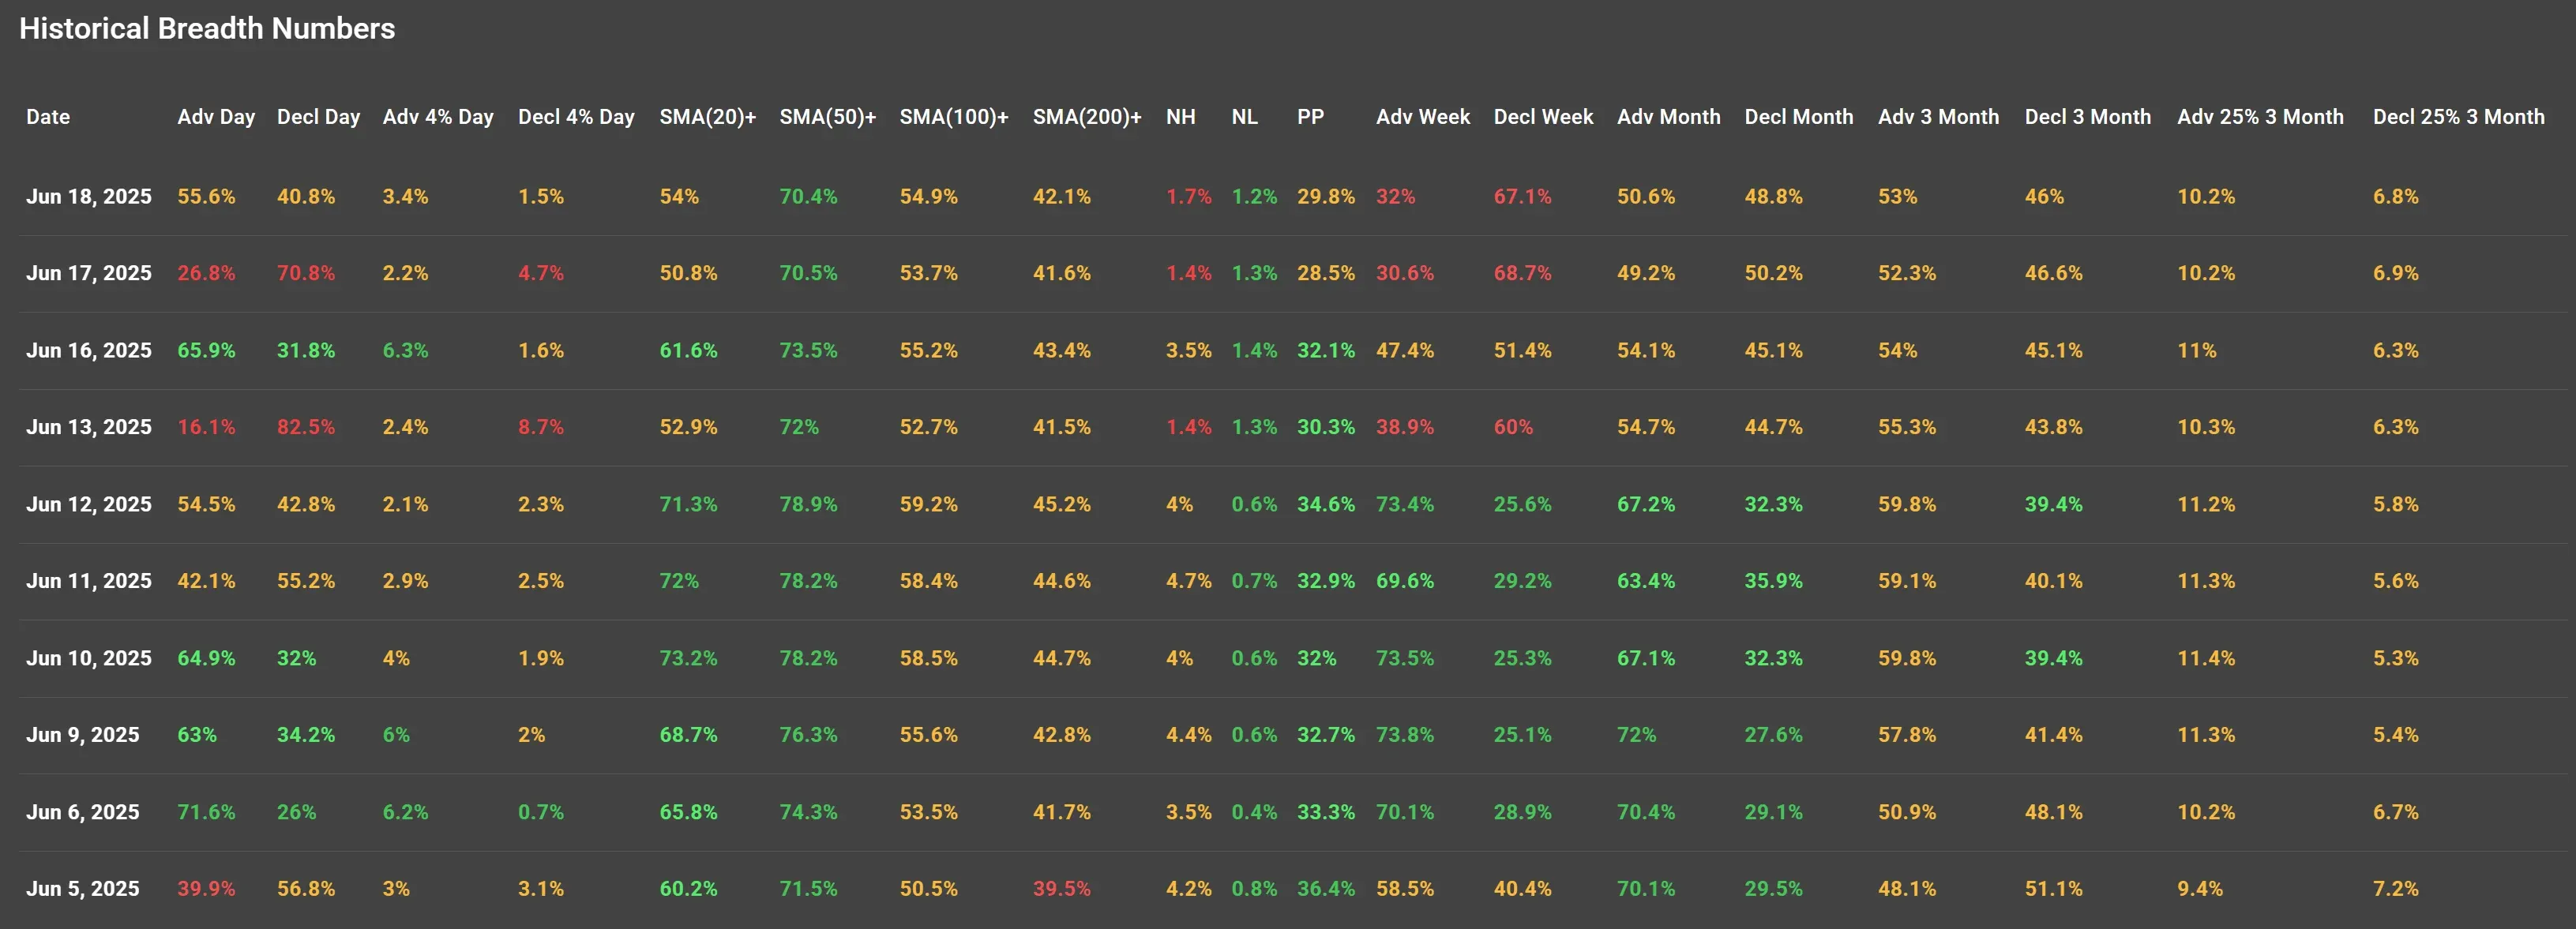
After Monday’s clear breakdown in breadth, with just 26.8% of stocks advancing and a hefty 70.8% declining, Tuesday brought a breath of relief: 55.6% of stocks managed to close higher, trimming back the damage from the prior session.
But let’s not pretend everything is suddenly bullish again, breadth has been extremely jumpy.
Continuation or Reversal?
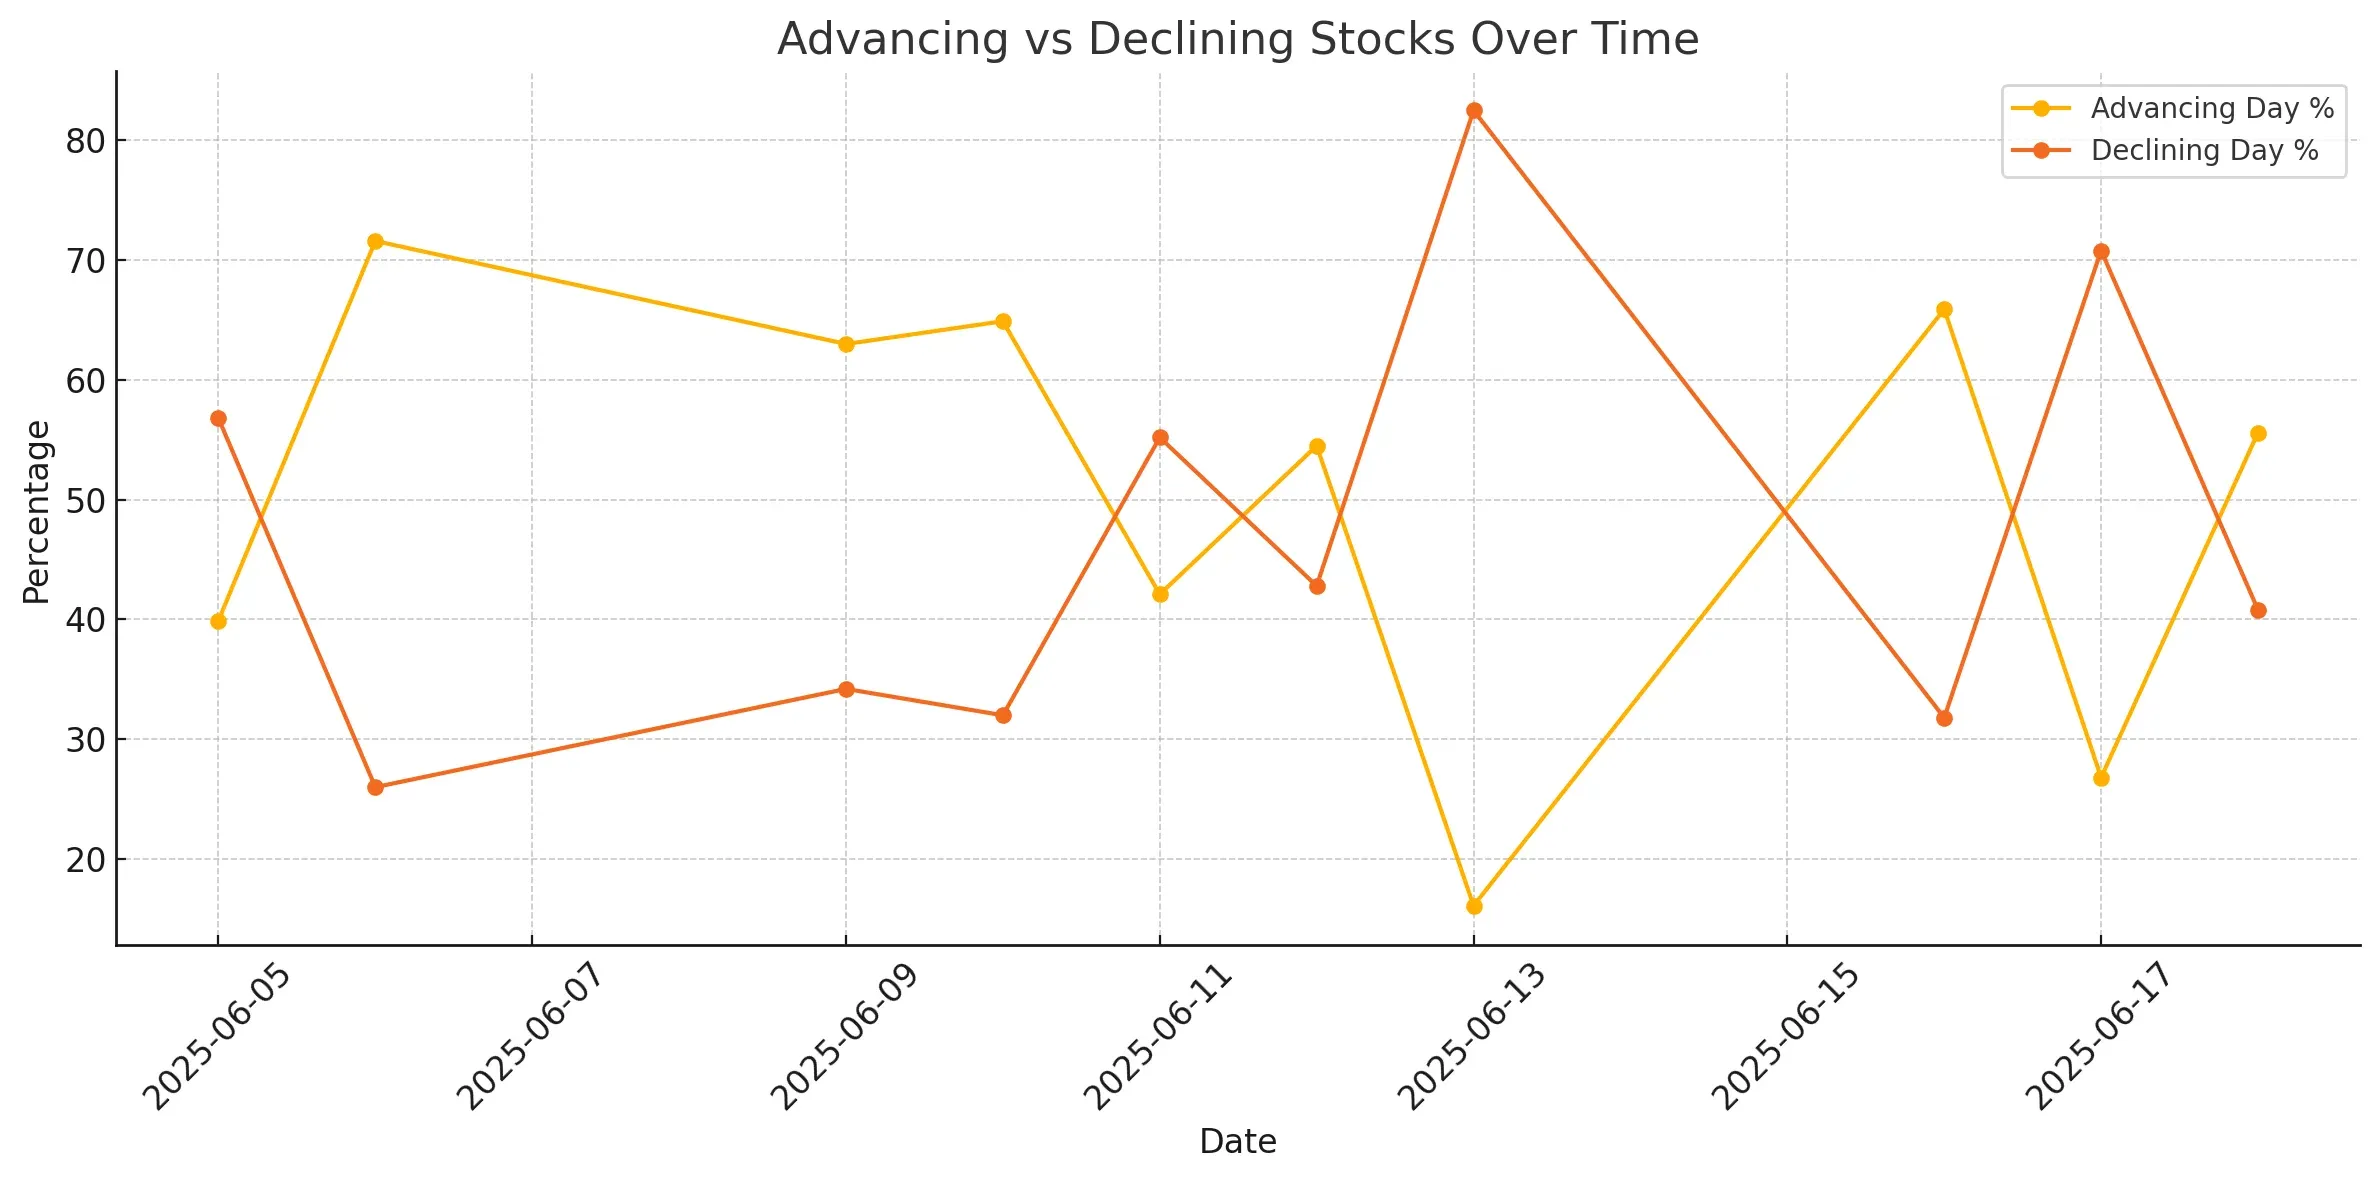
Looking back, June 16 showed strong participation with nearly 66% of stocks advancing. That strength got absolutely gutted the next day. What we’re seeing now is a bounce-back from that weakness, but not necessarily a firm reversal. This market is trading like it’s nervous, every positive breadth day lately seems to get tested immediately the next session.
The chart below says it all: breadth has been whipsawing back and forth with little consistency.
Key Metrics to Watch
-
Advancers > Decliners (Daily): The 55.6% to 40.8% split looks healthy on the surface, but we’ve seen this movie before, like on June 12 when the bounce quickly faded.
-
SMA(50)+ Readings: Still hanging tough at 70.4%, showing underlying support in the medium-term trend. That’s a good sign, for now.
-
Weekly Breadth: Only 32% of stocks are up on the week, vs 67.1% down. The damage from the earlier selloffs hasn’t healed yet.
-
Monthly Breadth: Advancers (50.6%) are just barely holding above decliners (48.8%), a razor-thin margin that reflects indecision across the board.
What This Tells Me
This is still a fragile, headline-driven market. We’ve had one good day, but after recent whiplash moves, I’m not calling any bottom here.
If we get follow-through with strong breadth above 60% and improving short-term moving averages in the next few sessions, I’ll start paying attention.
But for now?
It’s bounce-and-watch mode.
Tread carefully. Breadth is (still) twitching.
Kristoff - Co-founder, ChartMill
Next to read: Market Monitor News, June 19