Market Monitor Trends (SPY, QQQ, IWM) and Breadth June 11
By Kristoff De Turck - reviewed by Aldwin Keppens
Last update: Jun 11, 2025

(All data & visualisations by ChartMill.com)
Daily Market Trend Analysis – June 10, 2025 (After Market Close)
QQQ and SPY are slowly rising further towards their all time highs. Curious to see if the IWM can surpass the current $215 resistance level in the coming days.
Short Term Trend
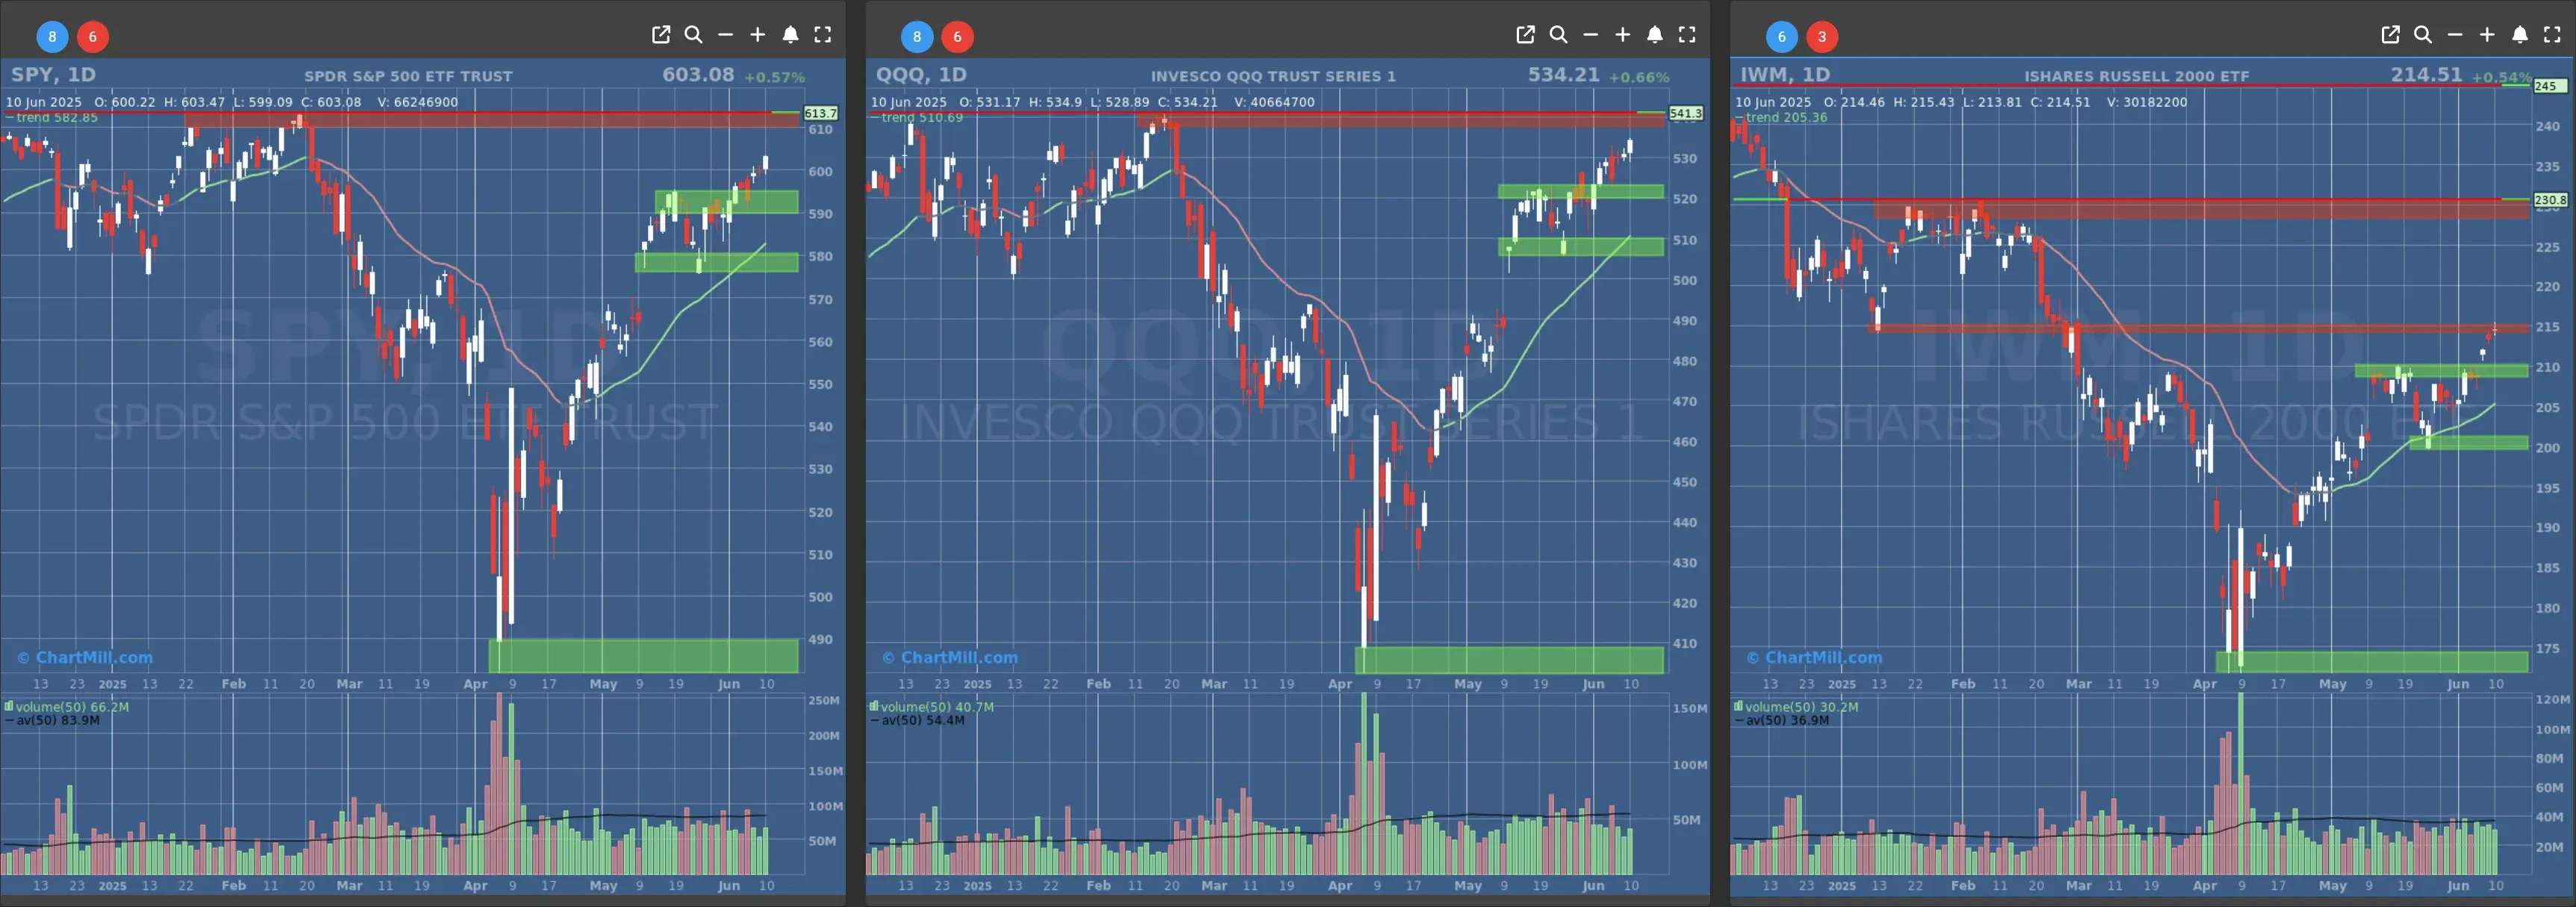
- Short-Term Trend: Bullish (no change)
- Next Support at $580
- Next Resistance at $610
- Volume: Below Average (50)
- Pattern: Up Day, Follow Through
- Short-Term Trend: Bullish (no change)
- Next Support at $520
- Next Resistance at $540
- Volume: Below Average (50)
- Pattern: Up Day, Follow Through
- Short-Term Trend: Bullish (no change)
- Next Support at $210 & $205
- Next Resistance at $215 & $230
- Volume: Slightly below Average (50)
- Pattern: Doji Candle, at resistance
Long Term Trend
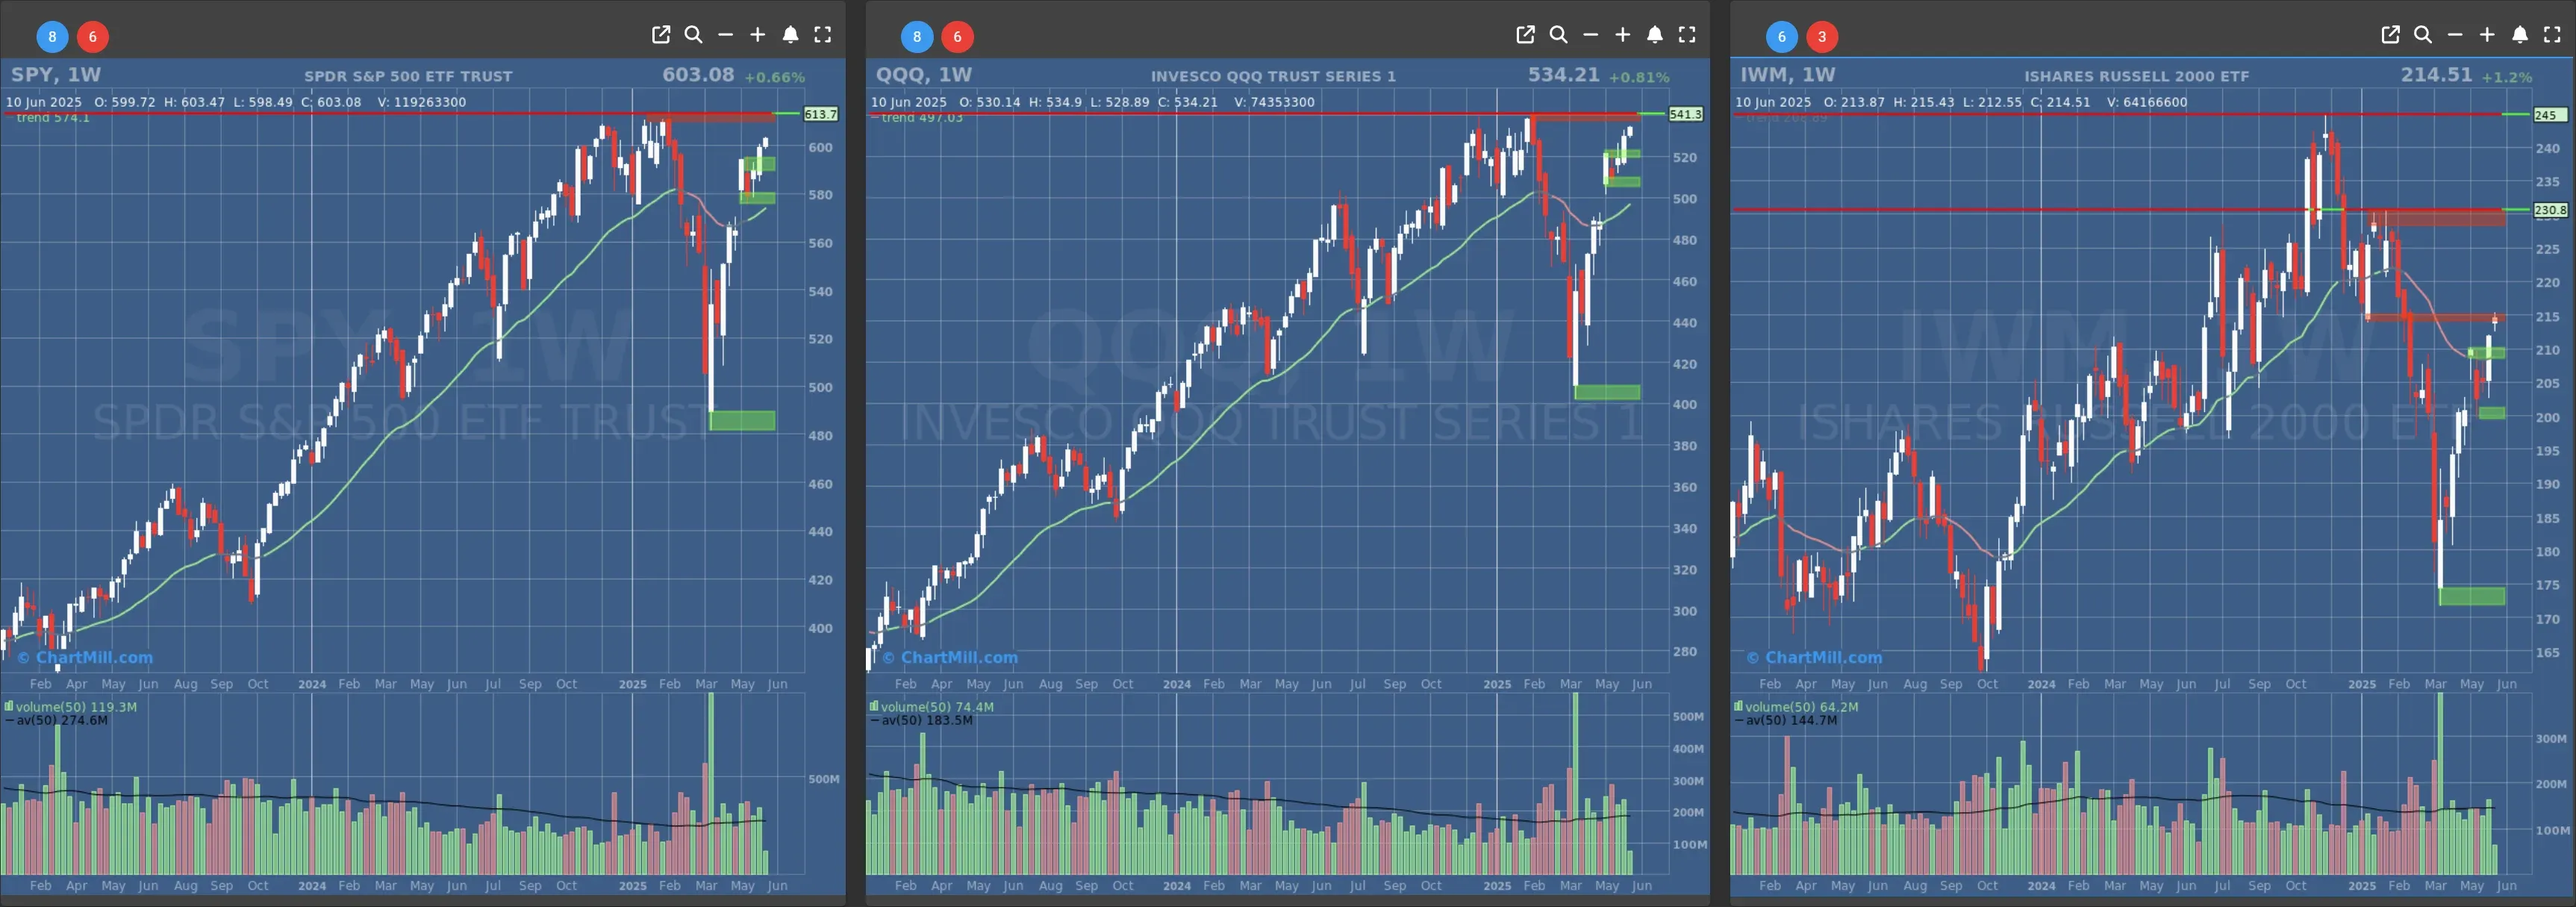
- Long-Term Trend: Positive (no change)
- Long-Term Trend: Positive (no change)
- Long-Term Trend: Neutral (no change)
Daily Market Breadth Analysis – June 10, 2025 (After Market Close)
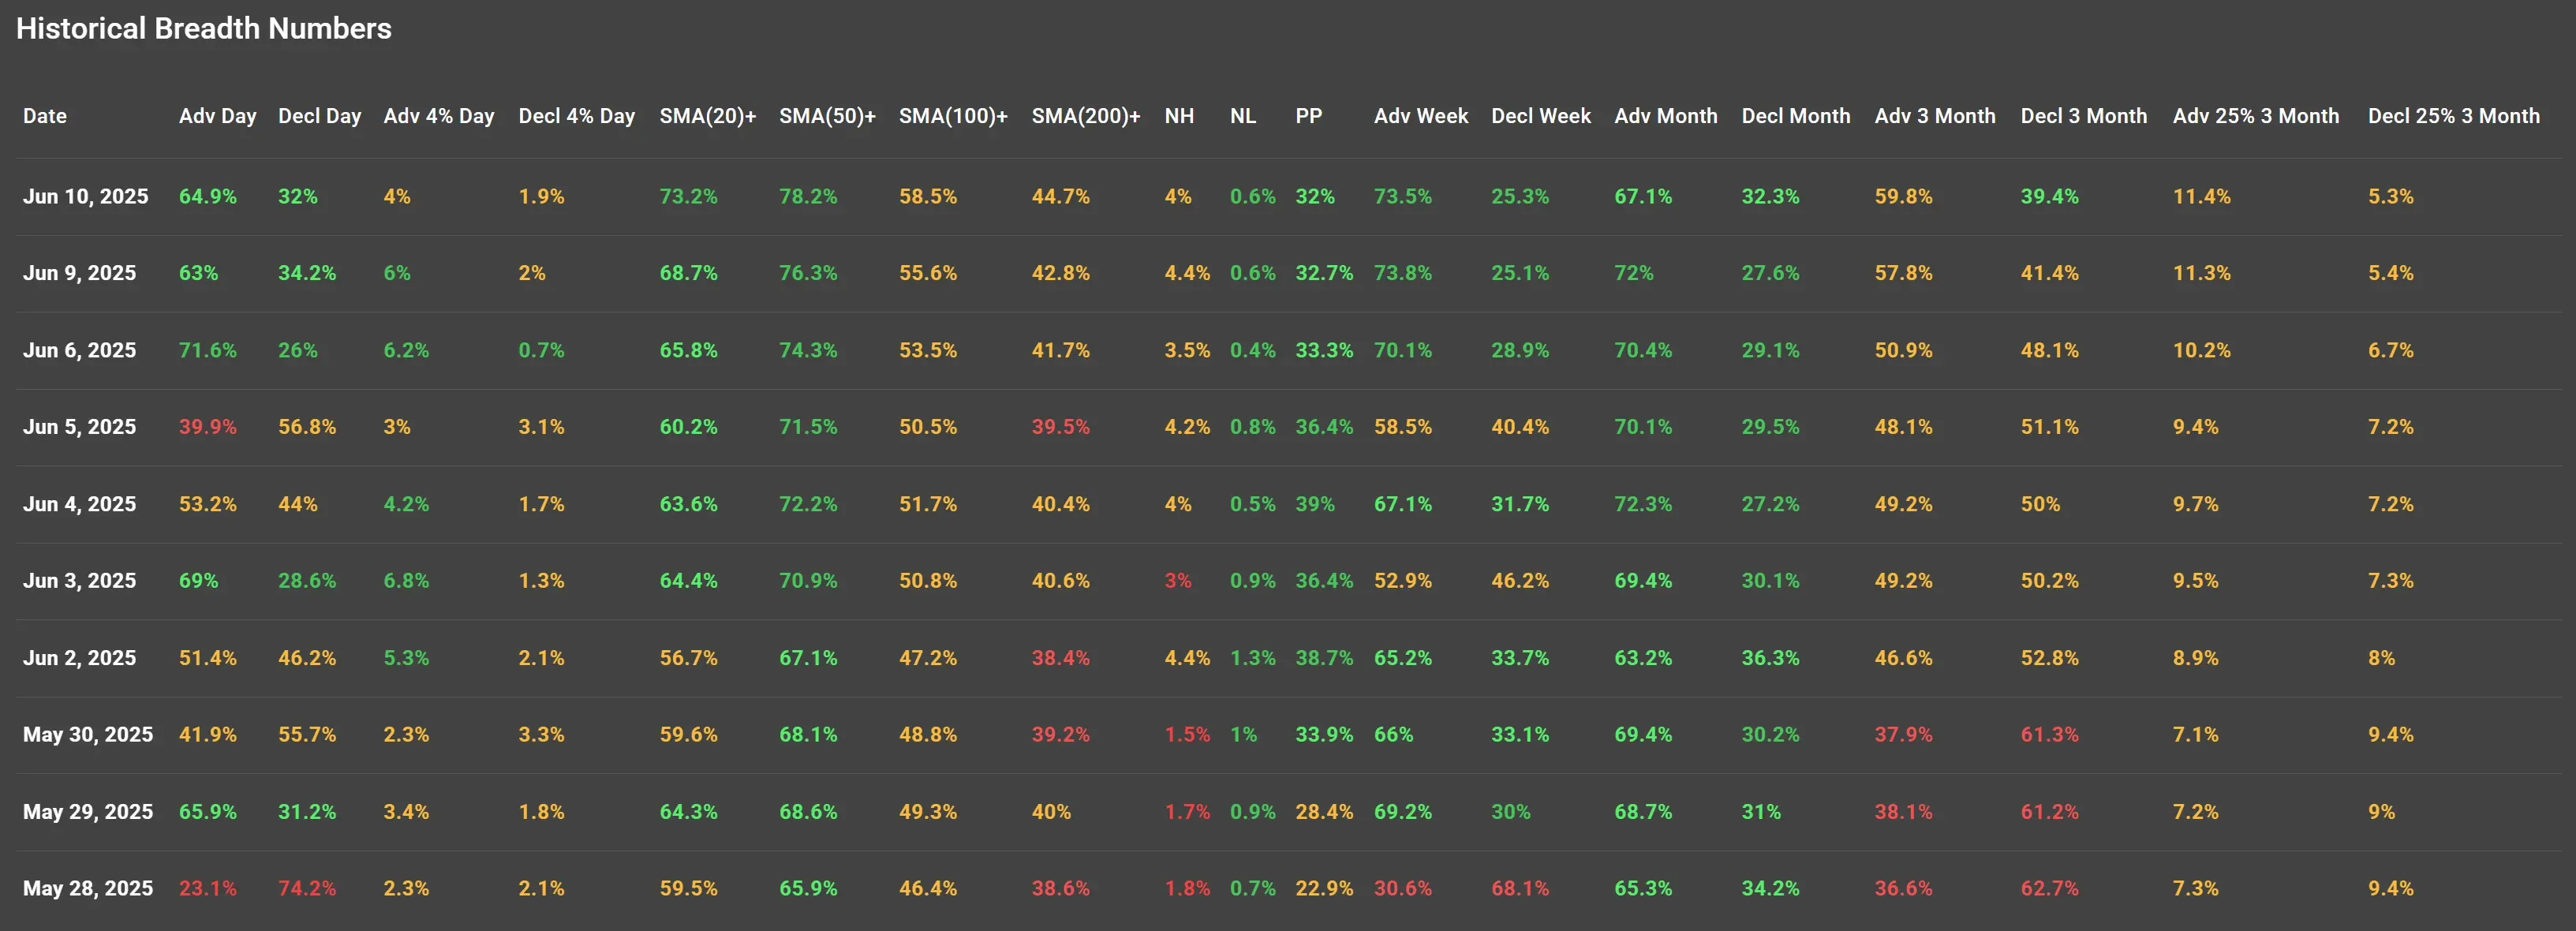
After a broadly positive session on June 9, the market breadth on June 10, 2025 further reinforced the bullish tone, with advancing stocks making up 64.9% of the market versus 32% declining, continuing the strong recovery trend that started after the market dip on June 5.
Key Highlights:
1. Positive Momentum Carries Forward
The advance/decline spread for June 10 continues a three-day positive streak. June 6 and June 9 had already shown robust advancing participation (71.6% and 63%, respectively), a stark contrast to the sell-off on June 5, where just 39.9% of stocks advanced and 56.8% declined.
This change suggests growing investor confidence, likely fueled by positive developments in US-China trade talks and expectations of manageable inflation data.
2. Strong Participation Above Key Moving Averages
The percentage of stocks trading above their 20-day and 50-day SMAs hit 73.2% and 78.2%, respectively, both the highest levels in the past two weeks. This indicates strong short- to medium-term technical breadth.
Even the longer-term picture improved, with 44.7% of stocks now above their 200-day SMA, a continuation of the slow grind higher seen since May 28 (38.6%).
3. Weekly Breadth Remains Bullish
Looking at the weekly breadth, advancing stocks now make up 73.5%, the highest of all the dates observed, indicating that this isn’t just a one-day phenomenon. It's part of a broader, healthier upswing.
This is a clear reversal from early June levels like June 3 and June 2, where weekly advancers were 52.9% and 65.2%, respectively.
4. Broader Market Still Cautiously Balanced
Despite the strong short-term push, the Adv 3 Month rate is at 59.8%, and only 11.4% of stocks are in the top quartile of 3-month performers. This implies that while the rally is gaining traction, participation at the extremes is still limited.
Compare this to June 5, where just 48.1% were advancing on a 3-month basis and only 9.4% were among the top 25% performers, and we see a meaningful but not euphoric improvement.
Visual Summary
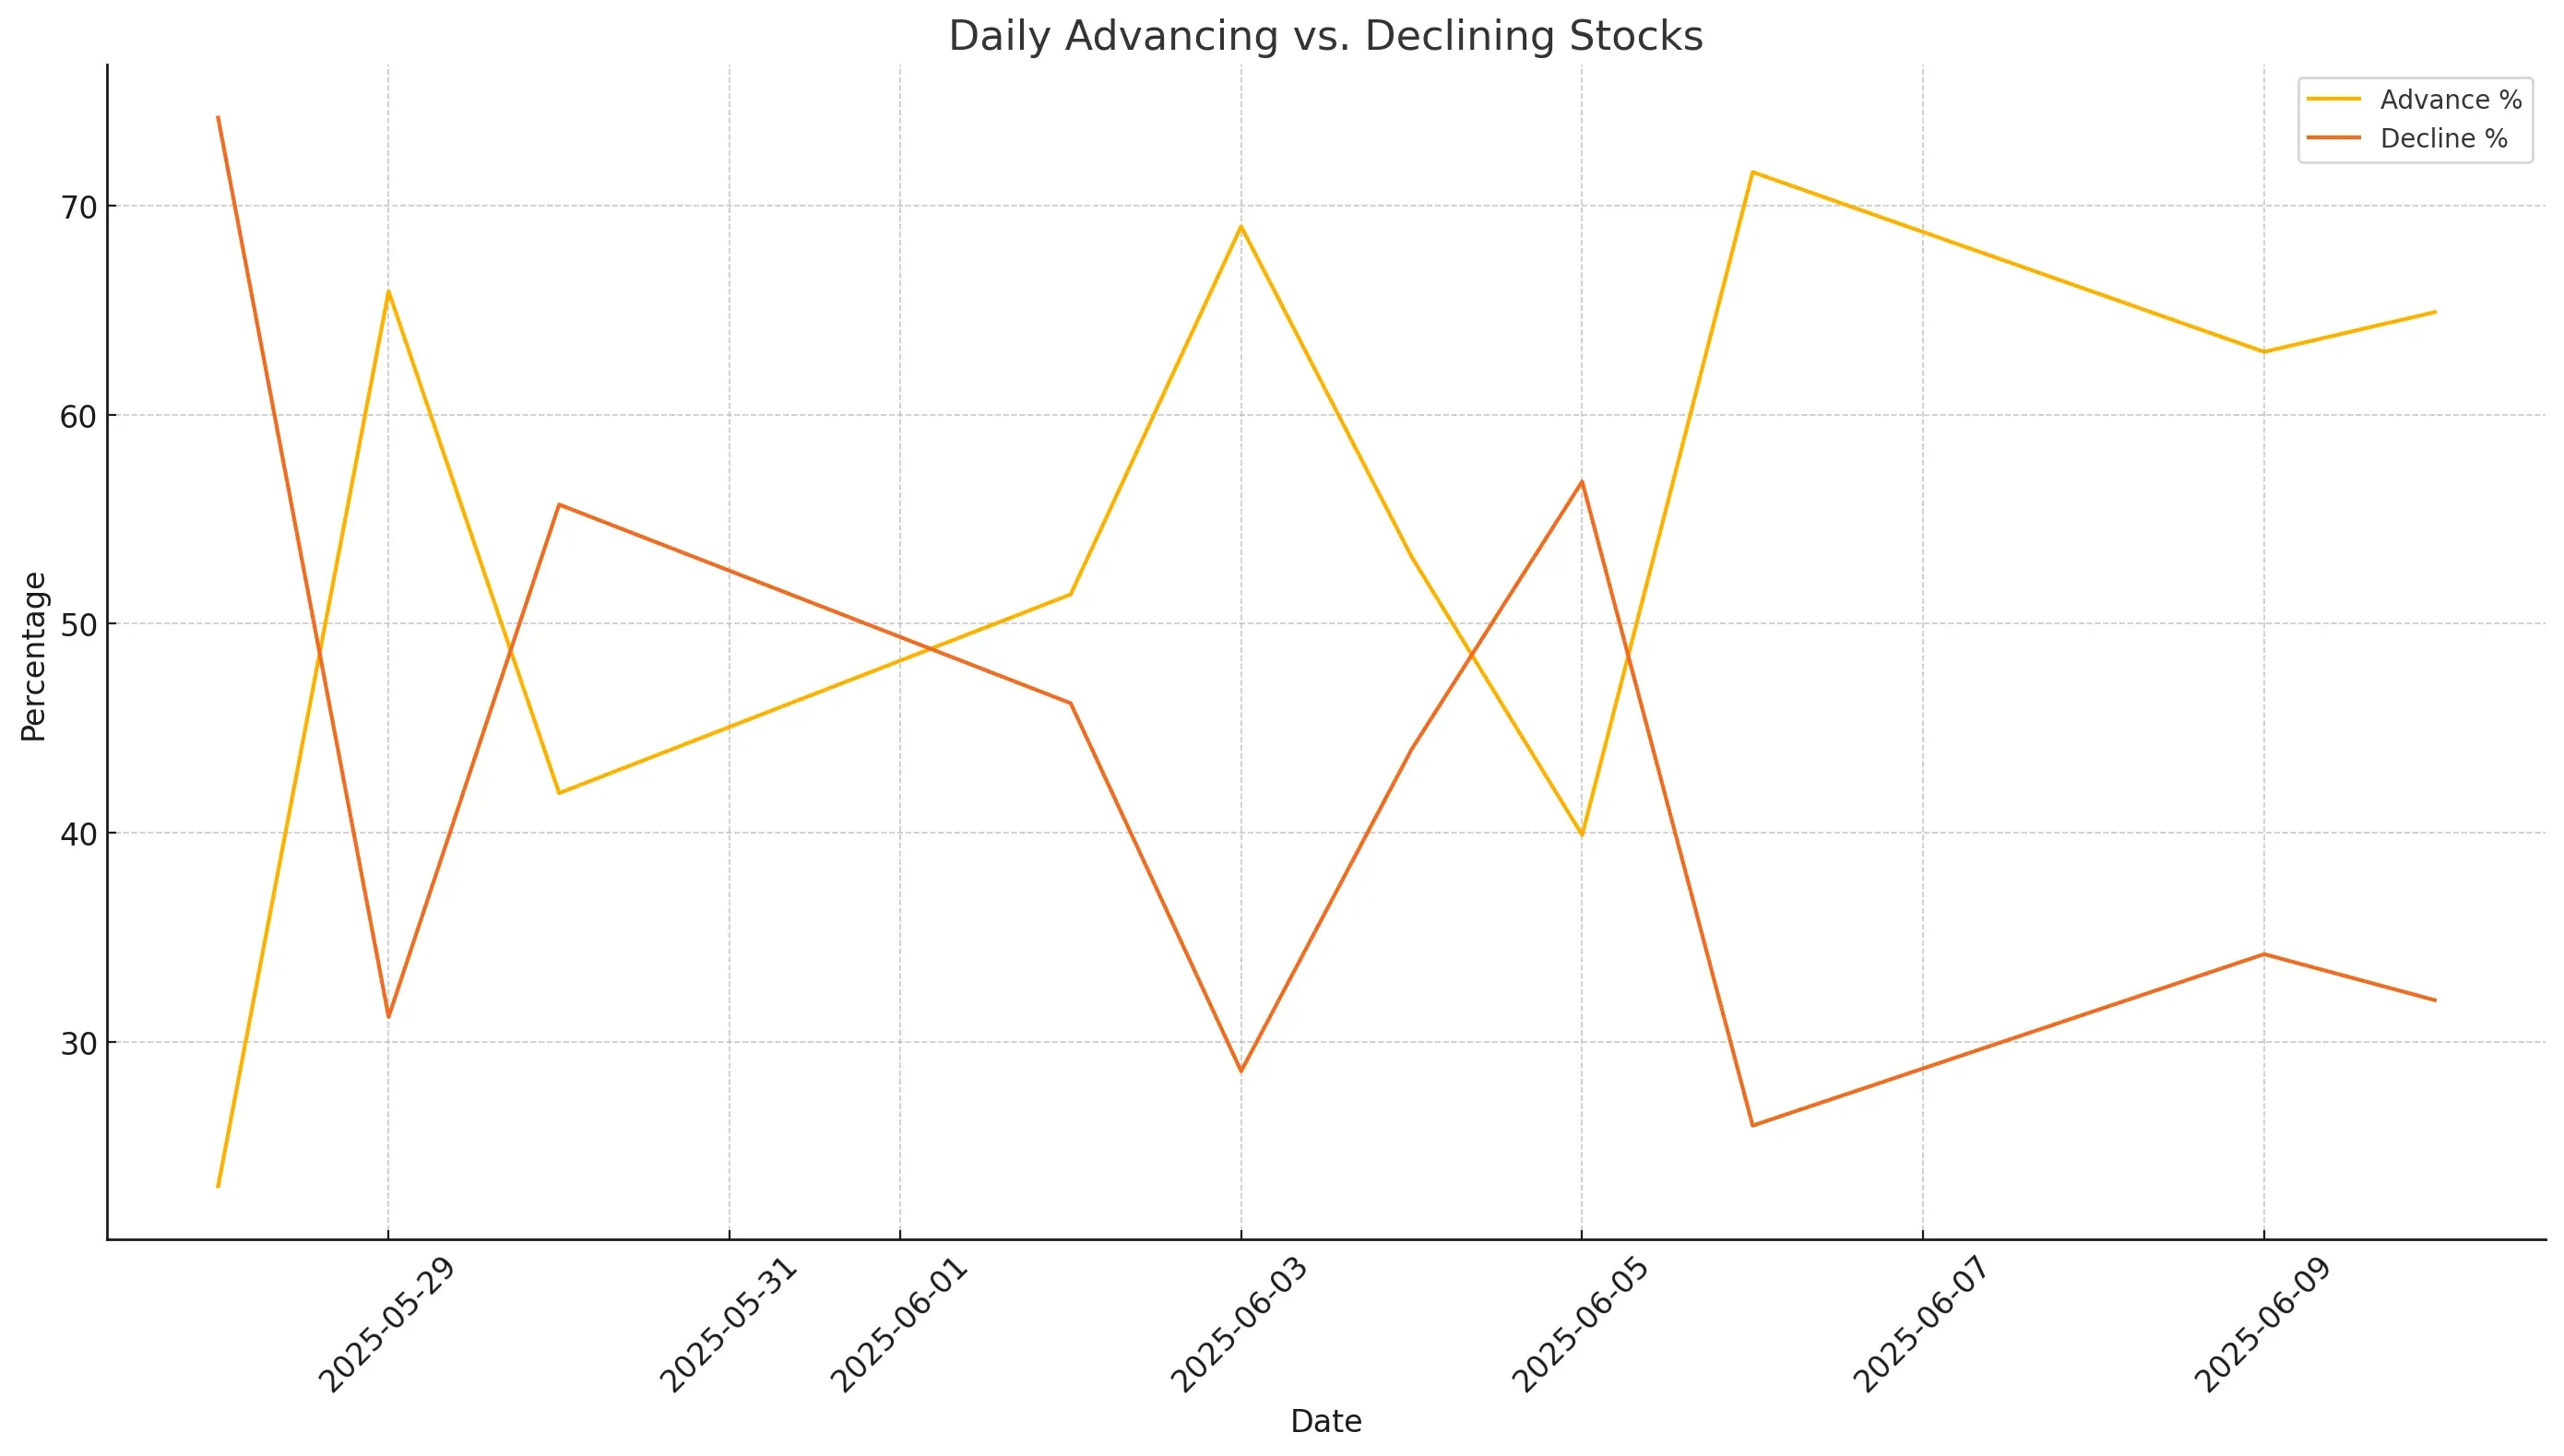
The chart above visualizes the shift in market breadth between advancing and declining stocks. You’ll notice the sharp reversal post-June 5, where bearish sentiment peaked, followed by a renewed upward drive in advancing stocks.
Conclusion:
The market breadth on June 10, 2025, points to a strengthening bullish undercurrent, especially after the volatility of early June. Breadth metrics now show consistency across daily, weekly, and medium-term indicators. While the longer-term trend (200-day SMA participation and 3-month leadership) still lags slightly, momentum is building in a constructive way.
If you missed the analysis from June 9, it highlighted the beginning of this upturn, especially in the wake of improving US-China relations. Today’s numbers confirm that what began as a rebound is evolving into a broader rally.
Next to read: Market Monitor News, June 11
208.89
-3.89 (-1.83%)
526.96
-6.7 (-1.26%)
597
-6.75 (-1.12%)
Find more stocks in the Stock Screener
IWM Latest News and Analysis
 2 days ago - ChartmillMarket Monitor Trends (SPY, QQQ, IWM) and Breadth June 13
Bulls still have the ball, but they’re no longer sprinting. They’re looking over their shoulder.
 3 days ago - ChartmillMarket Monitor Trends (SPY, QQQ, IWM) and Breadth June 12
While fewer stocks participated in gains today, most remain above key moving averages, and longer-term momentum is holding.
 4 days ago - ChartmillMarket Monitor Trends (SPY, QQQ, IWM) and Breadth June 11
The market breadth on June 10, 2025, points to a strengthening bullish undercurrent, especially after the volatility of early June. Breadth metrics now show consistency across daily, weekly, and medium-term indicators.
 5 days ago - ChartmillMarket Monitor Trends (SPY, QQQ, IWM) and Breadth June 10
Breadth metrics for June 9 confirm that last week’s sharp selloff on June 5 was likely a short-lived pullback rather than the start of a new bearish phase.
 6 days ago - ChartmillMarket Monitor Trends (SPY, QQQ, IWM) and Breadth June 09
The June 6 session confirms that breadth is not only improving but now supporting the index-level gains we’ve seen in the major averages.
 9 days ago - ChartmillMarket Monitor Trends (SPY, QQQ, IWM) and Breadth June 06
SPY, QQQ both showing a distribution day after yesterday's session (down on above-average volume near the high).
 10 days ago - ChartmillMarket Monitor Trends (SPY, QQQ, IWM) and Breadth June 05
Breadth readings remain firm for now, this appears to be a healthy pause, not a reversal.
 12 days ago - ChartmillMarket Monitor Trends (SPY, QQQ, IWM) and Breadth June 04
Both the QQQ and the SPY broke out above their main resistance levels today.
 13 days ago - ChartmillMarket Monitor Trends (SPY, QQQ, IWM) and Breadth June 02
The indices continue to quote close to their next resistance. While headline indices may show only minor daily fluctuations, the underlying breadth data paints a more fragile picture.
 16 days ago - ChartmillMarket Monitor Trends (SPY, QQQ, IWM) and Breadth May 30
The data from May 29, 2025, confirms that market breadth has rebounded significantly, with strong participation and improving technical metrics across shorter moving averages.
 17 days ago - ChartmillMarket Monitor Trends (SPY, QQQ, IWM) and Breadth May 29
The breadth indicators signal a fragile and reactive market environment, prone to sharp swings and lacking sustained leadership. Bullish momentum may struggle to gain lasting traction.
 18 days ago - ChartmillMarket Monitor Trends (SPY, QQQ, IWM) and Breadth May 28
The May 27 surge in breadth confirms the bullish price action observed across major indices on that day, reinforcing the move’s credibility.
