Market Monitor Trends and Breadth July 10 BMO
By Kristoff De Turck - reviewed by Aldwin Keppens
Last update: Jul 10, 2025

(All data & visualisations by ChartMill.com)
Daily Market Trend Analysis – July 09, 2025 (After Market Close)
A new high for the QQQ and IWM on its way to its final and highest resistance level.
Short Term Trend
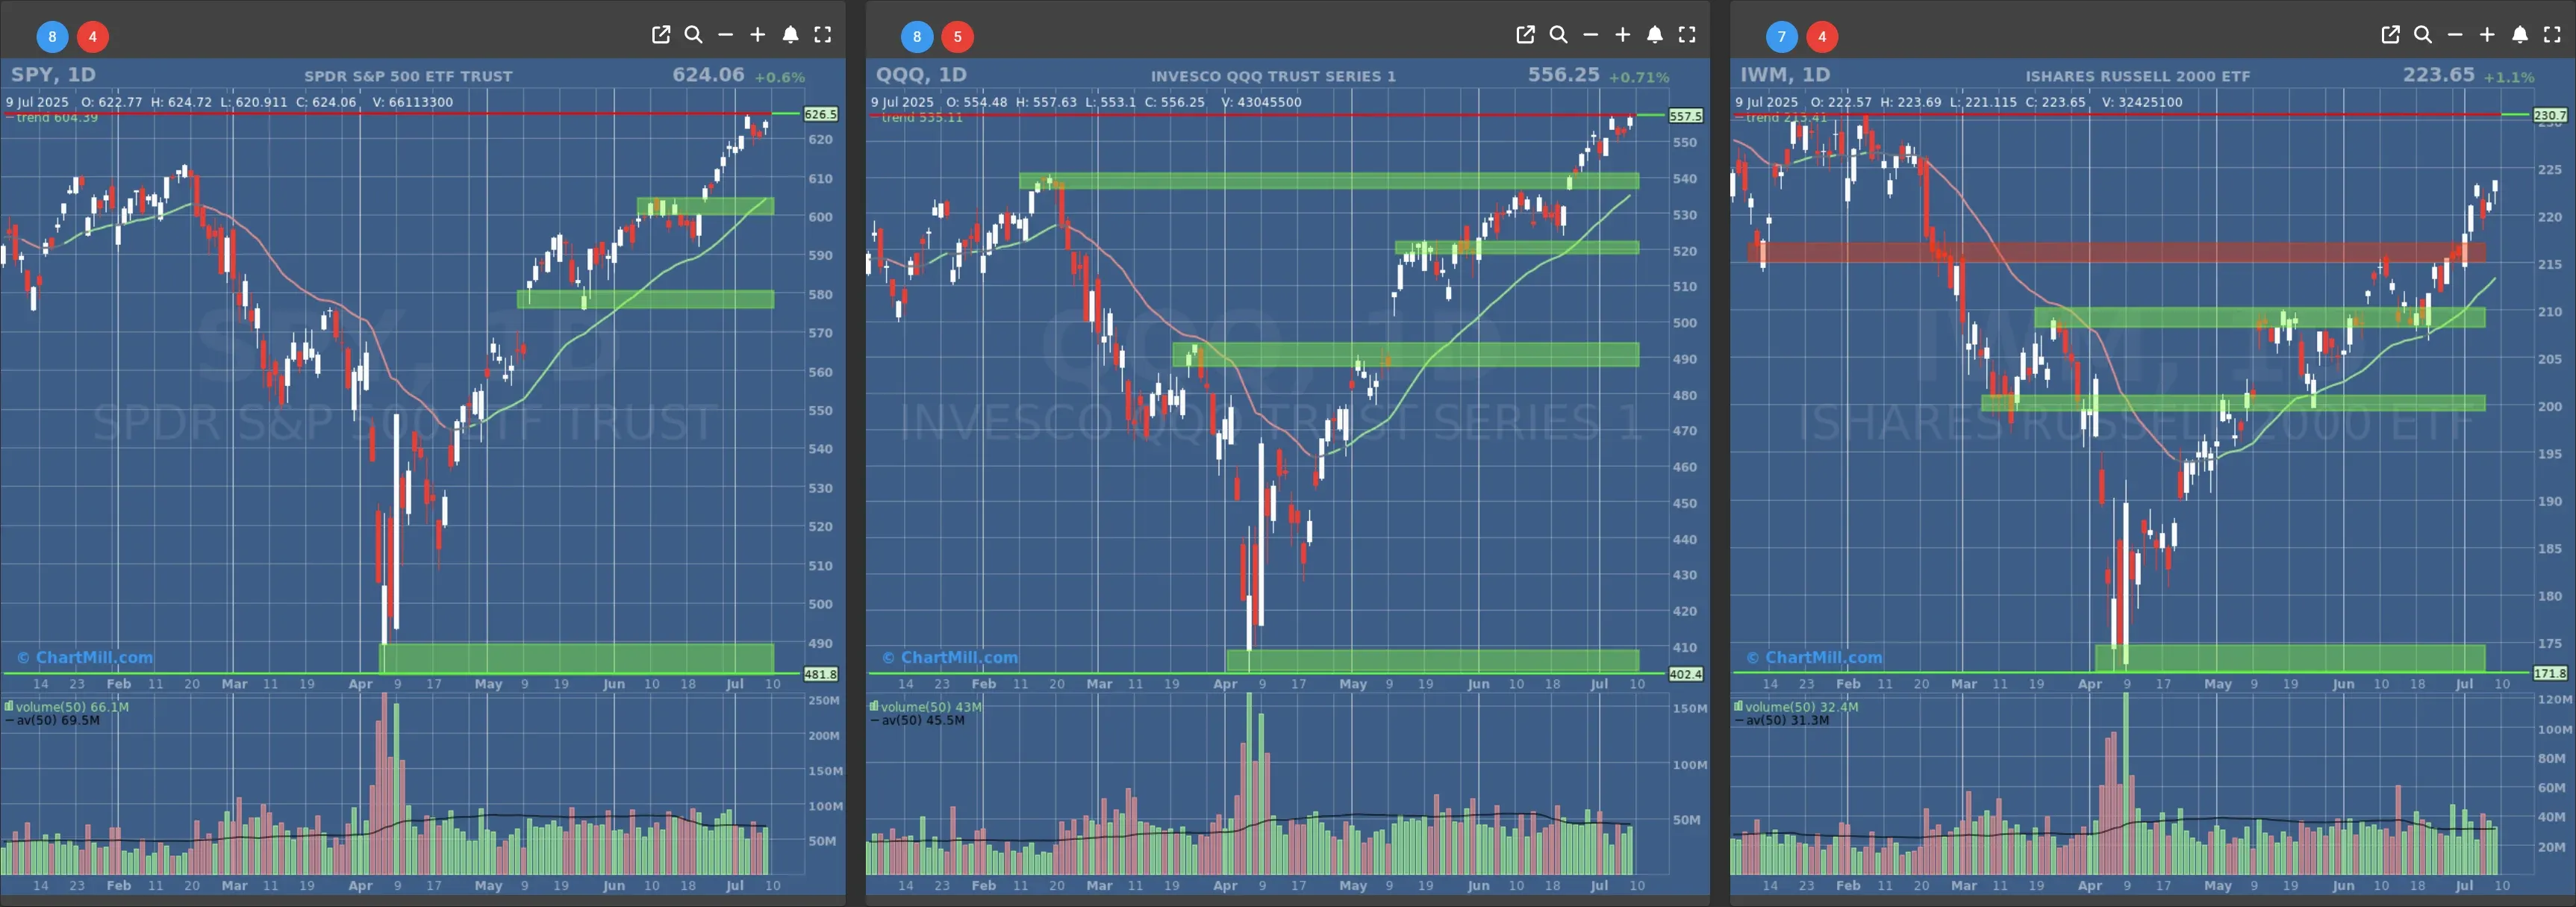
- Short-Term Trend: Bullish (no change)
- Next Support at $600 to $610
- Next Resistance at /
- Volume: At Average (50)
- Pattern: Gap Up - Up Day
- Short-Term Trend: Bullish (no change)
- Next Support at $540
- Next Resistance at /
- Volume: At Average (50)
- Pattern: Gap Up - Up Day
- Short-Term Trend: Bullish (no change)
- Next Support at $210
- Next Resistance at $215 to $220
- Volume: At Average (50)
- Pattern: Gap Up - Up Day
Long Term Trend

- Long-Term Trend: Positive (no change)
- Long-Term Trend: Positive (no change)
- Long-Term Trend: Positive (no change)
Daily Market Breadth Analysis – July 09, 2025 (After Market Close)

The bulls kept the upper hand yesterday, with a firm follow-through across key market breadth indicators that signaled improving internals.
After a shaky start to the week on July 7, breadth metrics on July 8 already hinted at a potential rebound and the data from July 9 has now confirmed it.
Let’s break down what’s really happening under the surface and why this is a win for the bulls, even if the longer-term signals still demand some skepticism...
Advancers Take Control Again
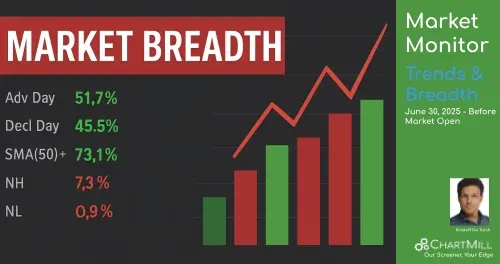
On July 9, 66.8% of all tracked stocks posted gains, a clear bullish breadth day that follows up on the modestly positive breadth from July 8 (59.4%).
Importantly, we also saw a 6.0% share of stocks gaining more than 4%, which confirms some risk appetite returning to the market. While that’s slightly below the July 8 figure (6.1%), it’s still solid and well above the bearish 3% we saw on July 7.
Decliners shrank to 30.5%, and only 1.5% of stocks dropped more than 4%, a strong improvement from the July 7 washout (6.6%).
This 3-day breadth trajectory - from bearish breakdown (July 7) to stabilization (July 8) and now confirmation (July 9) - paints a short-term bullish scenario. But let’s not pop the champagne yet.
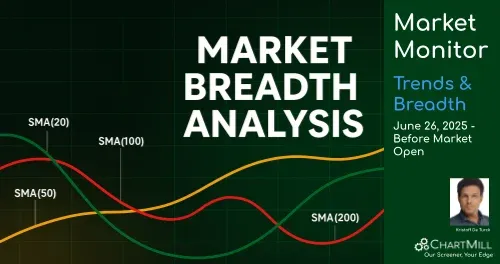
Price Above Moving Averages – Strong Push Across the Board
Looking at how many stocks are trading above key moving averages, we see a clear uptick:
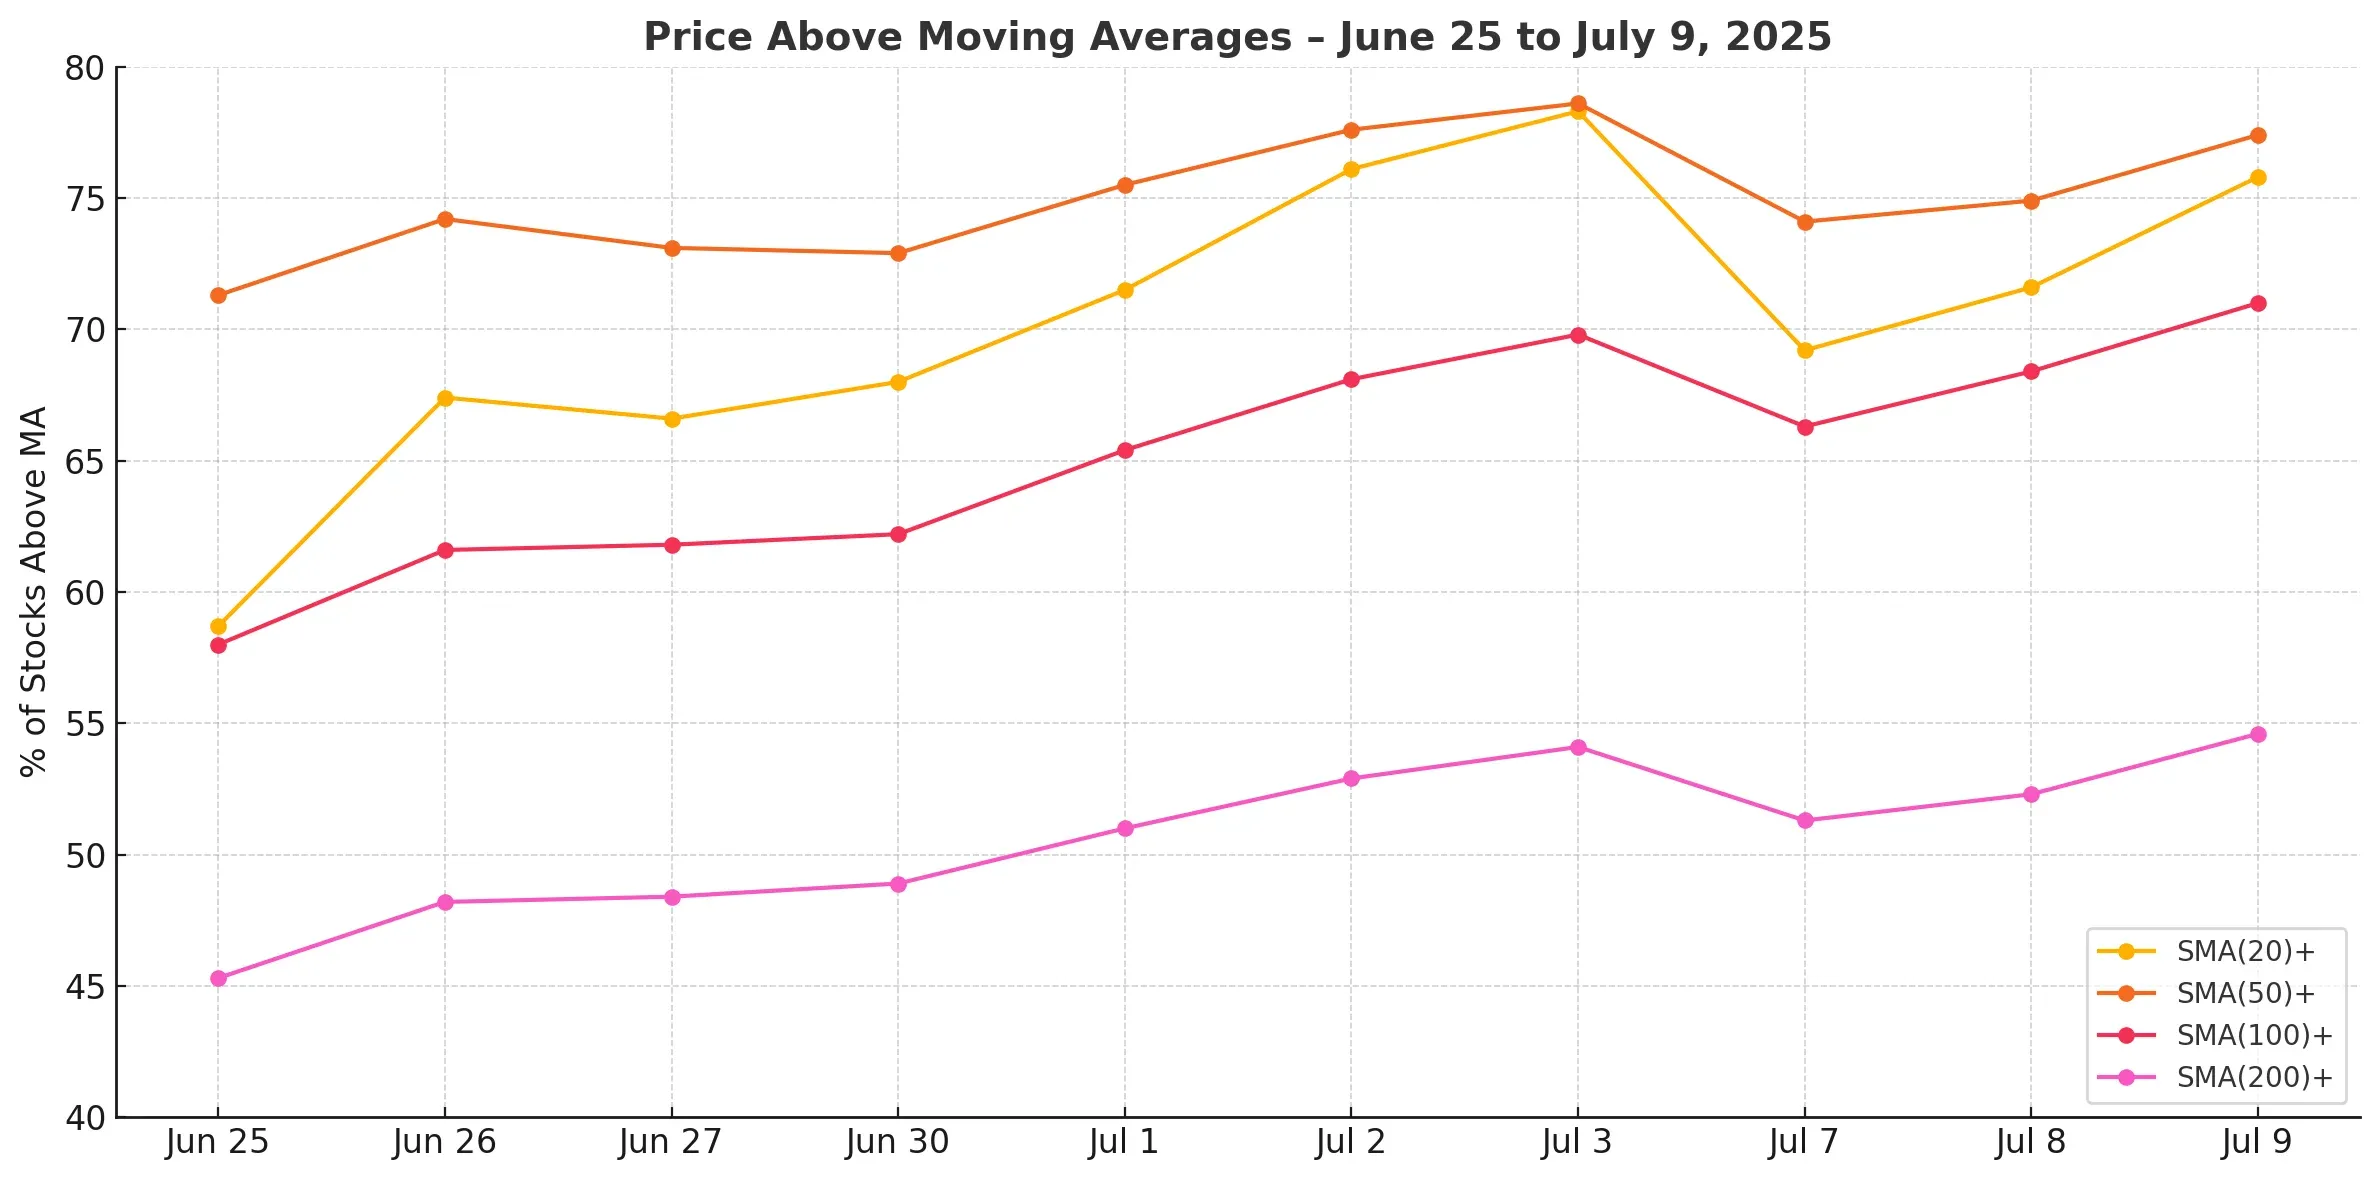
All four metrics rose again, a continuation of the trend that began July 8. Especially notable is the climb in 200-day participation, now pushing back above 54%, which indicates growing medium-term support.
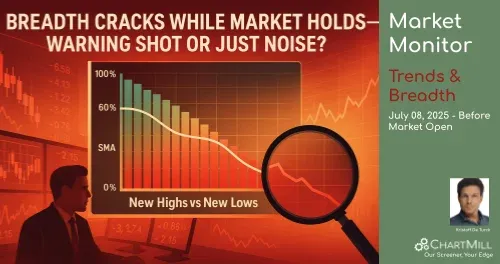
New Highs Rising, New Lows Shrinking
The number of new highs (NH) jumped to 4.3% of stocks from 2.6% on July 8 and just 3.1% on July 7, another confirming signal of growing strength. New lows (NL) stayed ultra-low at just 0.6%, which keeps risk in check.
This steady improvement in NH/NL ratios adds confidence that the market’s rally isn’t just noise.
Short-Term vs. Medium-Term Breadth — Slight Divergence

It clearly shows how short-term momentum (1-week breadth) dipped recently, while medium-term strength (3-month breadth) remained elevated, highlighting the current disconnect in market behavior.
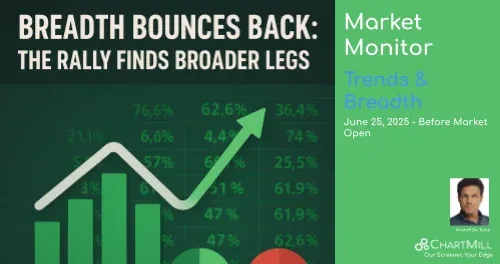
Week-over-Week Momentum Builds
Breadth over the past five trading days is also pointing in the bulls’ favor:
-
Advance Week: 67% (up from 64.7%)
-
Decline Week: 31.8% (down from 34.1%)
After a concerning start to the week, this week's breadth is shifting back to favoring the buyers. That said, a single strong day (July 9) is largely responsible for the recovery, so let’s watch closely if this trend continues through the end of the week.
Conclusion: The Bounce is Real, But Stay Nimble
The data from July 9 marks a legitimate recovery in market breadth, especially after the washout on July 7. The key moving average metrics, new highs, and multi-day advance-decline ratios all point to growing market strength.
However, given that headline risk remains (trade tariffs, speculation about interest rates, valuations of technology companies), I will be keeping a close eye on the broader picture over the next two sessions to see whether this recovery translates into an actual constructive upward trend.
Let’s call it what it is: constructive, but not yet convincing.
Kristoff - Co-founder, ChartMill
Next to read: Market Monitor News, July 10
221.7
-3.1 (-1.38%)
554.2
-1.25 (-0.23%)
623.62
-2.2 (-0.35%)
Find more stocks in the Stock Screener
IWM Latest News and Analysis
 3 hours ago - ChartmillMarket Monitor Trends and Breadth July 14 BMO
Buyers Step Aside as Tariff Jitters Grip the Market
 3 days ago - ChartmillMarket Monitor Trends and Breadth July 11 BMO
Market breadth continues to support the rally… but not without friction.
 4 days ago - ChartmillMarket Monitor Trends and Breadth July 10 BMO
Bullish Recovery Confirmed, But Caution Lingers Under the Hood
 5 days ago - ChartmillMarket Monitor Trends and Breadth July 09 BMO
Market Breadth Holds Firm as Volatility Flares But Watch for a Momentum Stall
 7 days ago - ChartmillMarket Monitor Trends and Breadth July 08 BMO
Breadth Breakdown: One Bad Day Doesn’t Break the Bull - Yet
 12 days ago - ChartmillMarket Monitor Trends and Breadth July 02 BMO
Breadth Check: Market Still Holding Up — But the Momentum Is Looking a Bit Tired
 13 days ago - ChartmillMarket Monitor Trends and Breadth July 01 BMO
Market Breadth Holds Strong as Quarter Ends With Momentum
 14 days ago - ChartmillMarket Monitor Trends and Breadth June 30 BMO
Stocks Hold the Line, but Under the Surface? Mixed Signals Persist
 17 days ago - ChartmillMarket Monitor Trends and Breadth June 27
Market Breadth Roars Back: Bulls Reclaim Control, But Will They Hold the Line?
 18 days ago - ChartmillMarket Monitor Trends and Breadth June 26
Breadth Falters Again as Bulls Lose Steam After One-Day Comeback
 19 days ago - ChartmillMarket Monitor Trends BMO (SPY, QQQ, IWM) and Breadth June 25
Breadth Bounces Back: The Rally Finds Broader Legs
 20 days ago - ChartmillMarket Monitor Trends BMO (SPY, QQQ, IWM) and Breadth June 24
Market breadth bounces back, more stocks trading above key averages as bullish momentum builds after last week's chop.
