

(All data & visualisations by ChartMill.com)
Daily Market Trend Analysis – July 02, 2025 (After Market Close)
Again a new high for the S&P5OO (SPY.
Short Term Trend
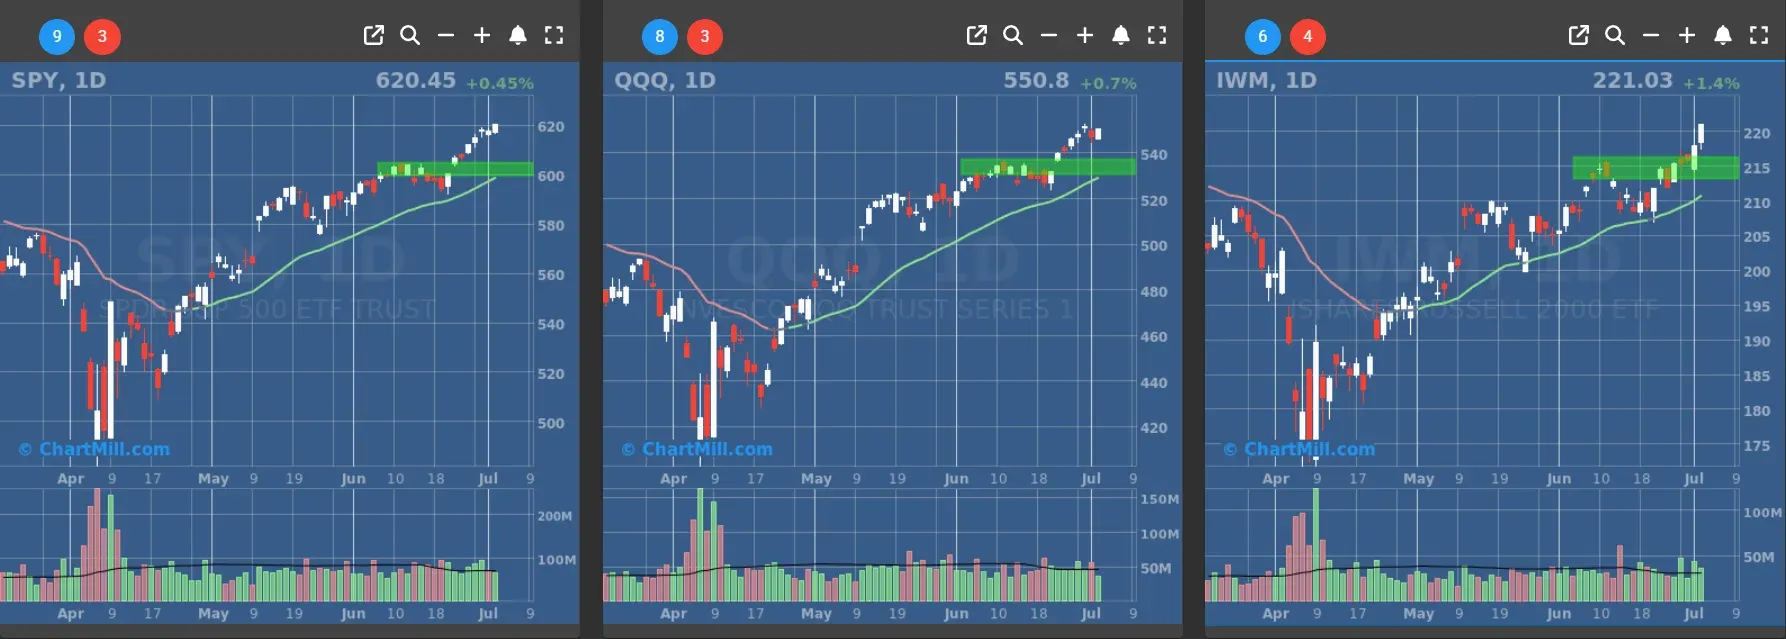
- Short-Term Trend: Bullish (no change)
- Next Support at $600 to $610
- Next Resistance at /
- Volume: At Average (50)
- Pattern: Up Day
- Short-Term Trend: Bullish (no change)
- Next Support at $540
- Next Resistance at /
- Volume: Below Average (50)
- Pattern: Bullish Engulfing Candle
- Short-Term Trend: Bullish (no change)
- Next Support at $210
- Next Resistance at $215 to $220
- Volume: Above Average (50)
- Pattern: Strong Up Day, Confirming Breakout
Long Term Trend
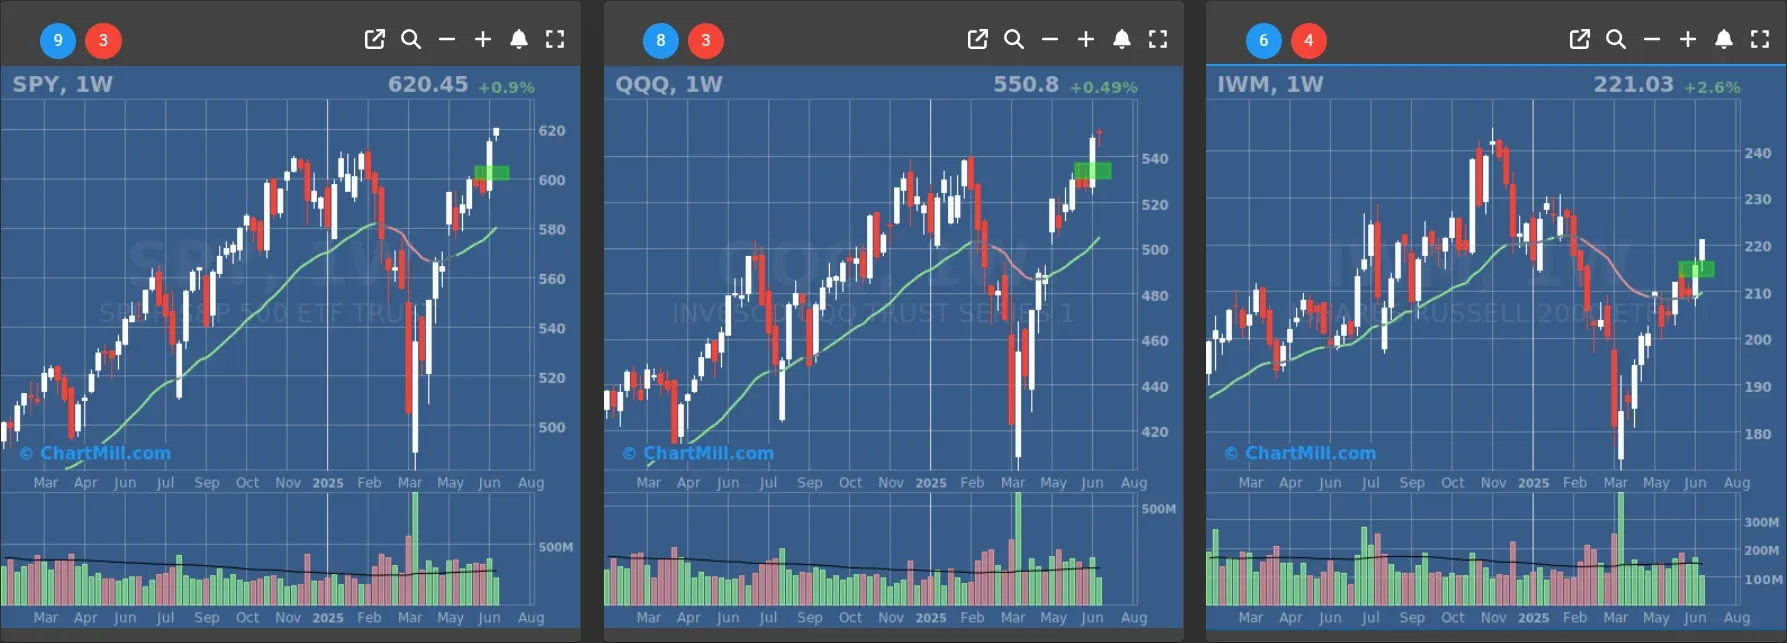
- Long-Term Trend: Positive (no change)
- Long-Term Trend: Positive (no change)
- Long-Term Trend: Positive (changed from neutral) - not confirmed, weekcandle closes on friday
Daily Market Breadth Analysis – July 02, 2025 (After Market Close)
After a lackluster start to the week, breadth metrics across the board surged into stronger territory on July 2nd, confirming a notable improvement in bullish participation.
But - and there’s always a “but” with breadth data - while the headline numbers scream strength, some internal metrics tell a more nuanced story.
Let’s dive into the numbers and see what’s really going on under the hood.
Market Participation Strengthens, Again
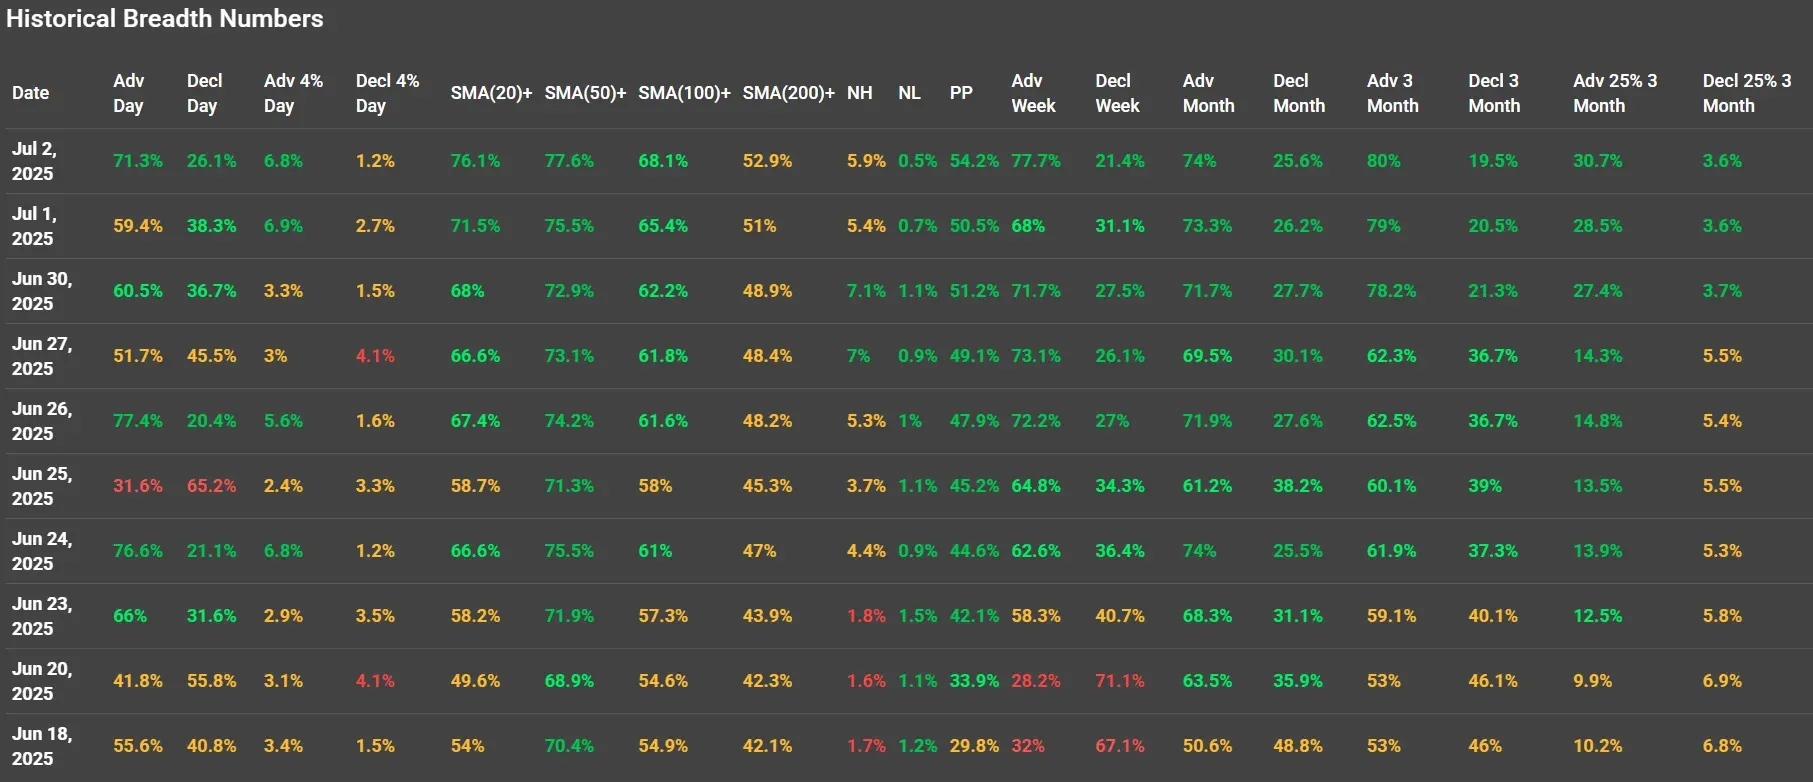
On Tuesday, 71.3% of stocks advanced, up significantly from Monday’s still-positive 59.4%, confirming a second consecutive day of broad buying.
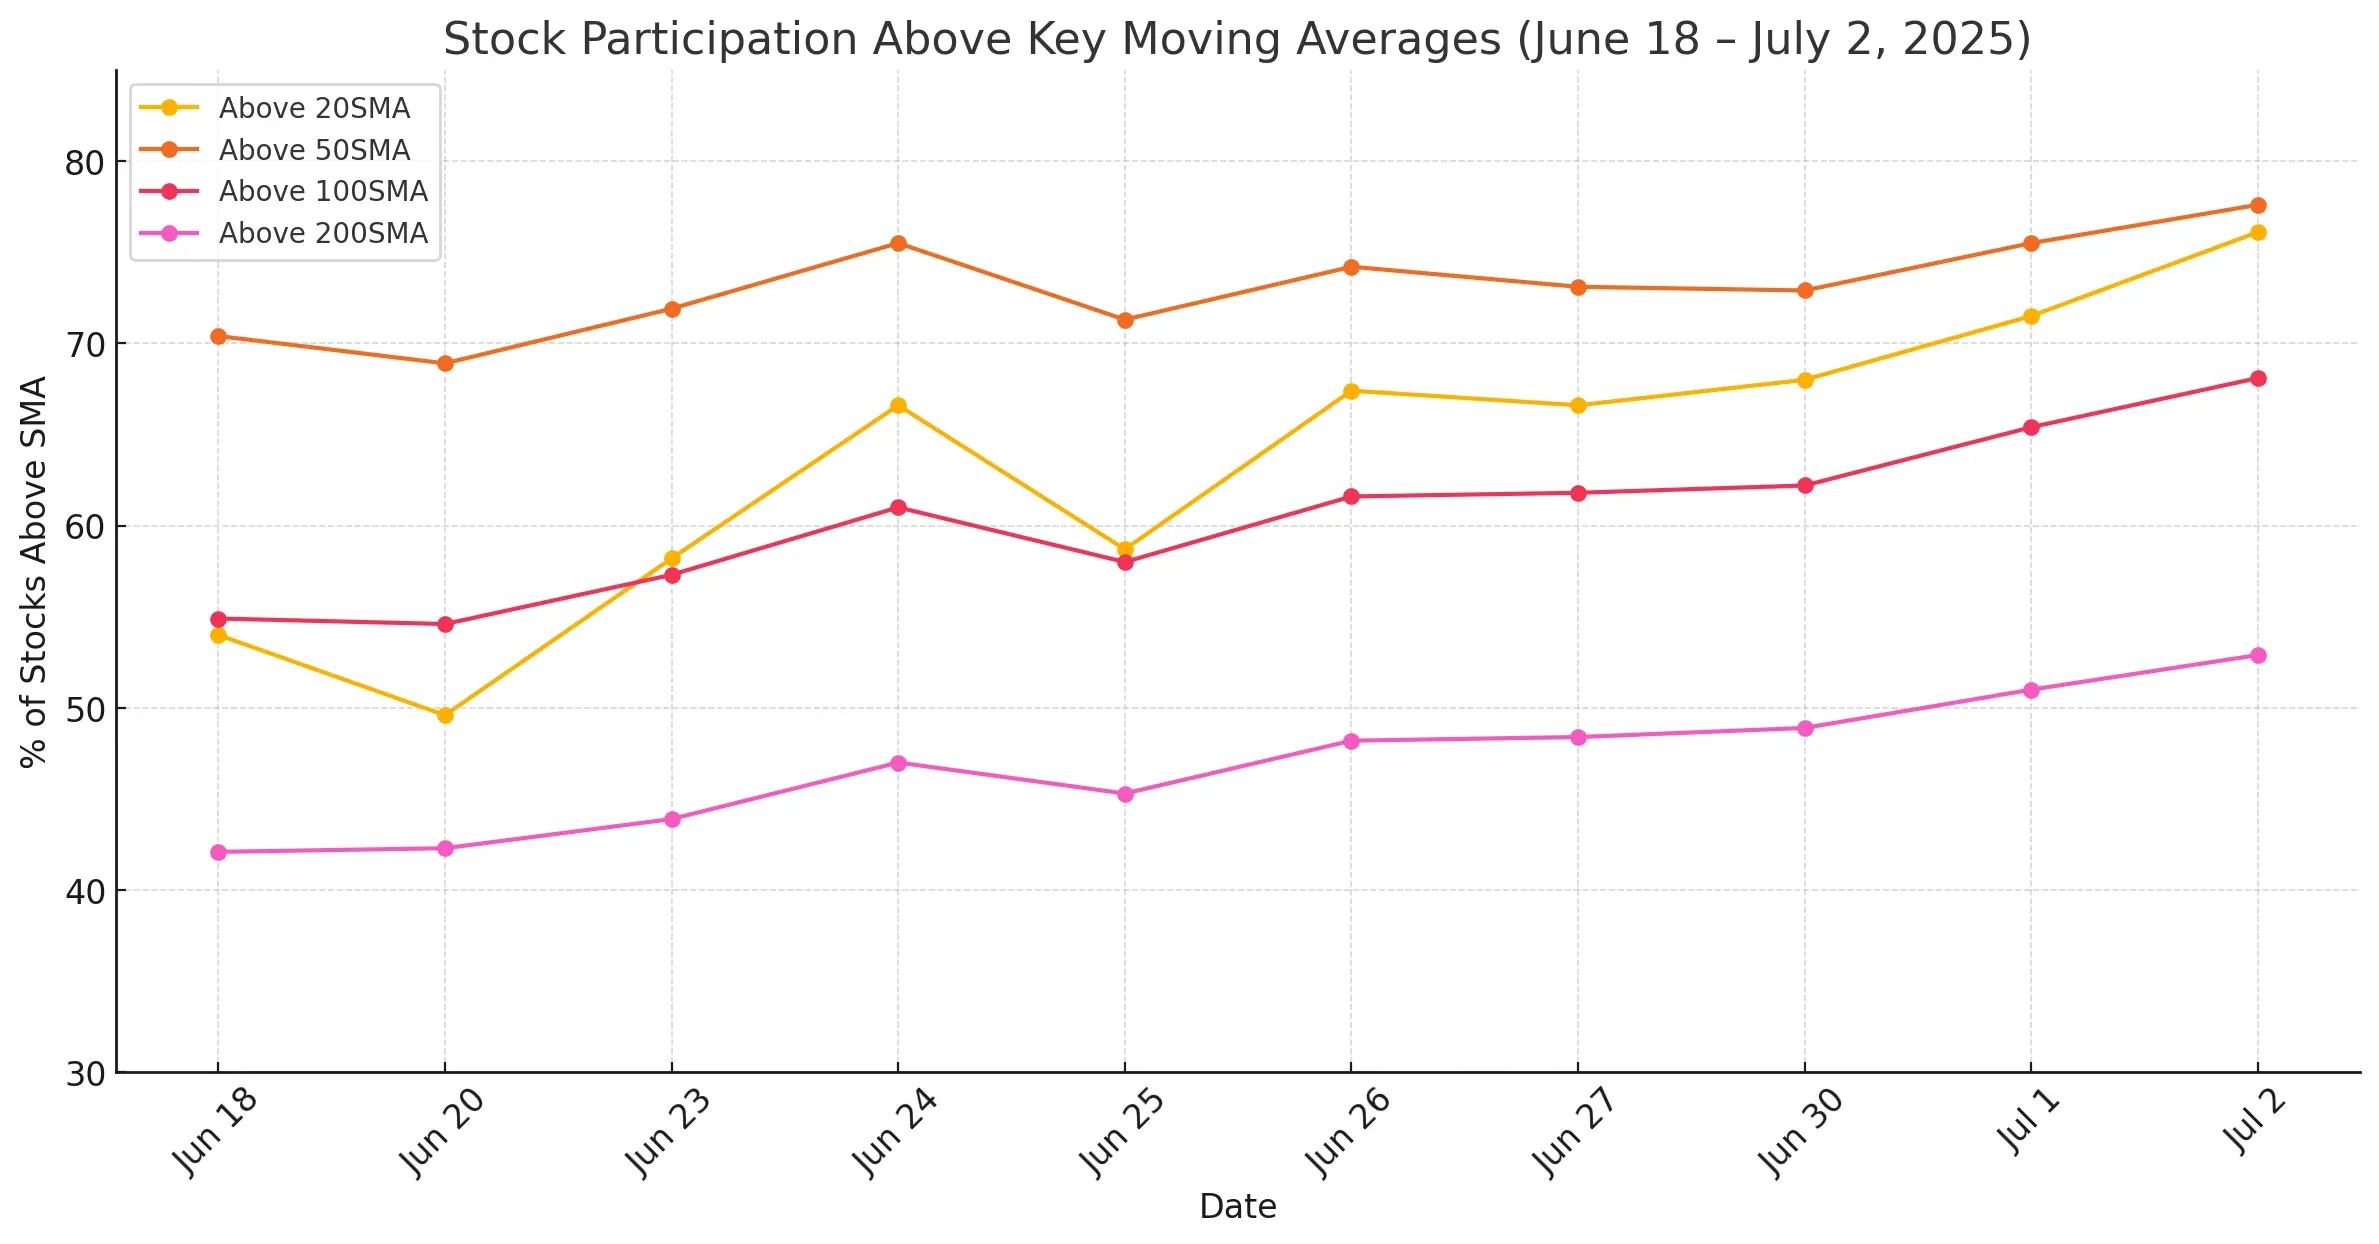
More impressive: the percentage of stocks above key moving averages continued to climb.
This broad strength was in line with Tuesday’s closing gains in the S&P 500 and Nasdaq, both of which benefited from optimism around the U.S.-Vietnam trade deal and anticipation of a dovish pivot from the Fed if job market weakness continues.
The percentage of stocks trading above their 200-day moving average ticked up to 52.9%, continuing a slow but steady recovery from the sub-45% lows seen in mid-June.
This confirms that the rally is increasingly being supported by longer-term structural improvements in individual stock trends, not just short-term mean reversions.
New Highs Limp, But New Lows Are Nearly Gone
Another positive sign? New highs (NH) climbed to 5.9%, while new lows (NL) dropped to 0.5%, a powerful combination suggesting risk appetite is healthy and internal weakness is receding.
Zooming Out: Weekly and Monthly Momentum Builds
On the weekly horizon, advancing stocks surged to 77.7%, continuing the sharp rebound that began last week. Just a week ago, on June 25th, that number sat at a shaky 64.8%, following a bearish breadth reading of just 31.6% advancing stocks that same day.
The broader monthly trend now shows:
-
74% of stocks advancing in the last month (up from 73.3%)
-
Only 25.6% declining
-
A solid 80% of stocks in the green over the last 3 months
Importantly, 30.7% of stocks are up more than 25% in the past 3 months, almost matching Monday’s 28.5%. This shows that even as breadth improves, leaders are still delivering outperformance, not just market-chasing laggards playing catch-up.
What Changed Since Yesterday?
Although Tuesday's numbers were solid, the improvements on Wednesday further cement the idea that we’re not just looking at a dead cat bounce. On Tueday, the advancers above 200SMA were just at 51%, barely a majority. Now we’re seeing breadth build upward pressure across all timeframes (20, 50, 100, and 200 SMA).
Also notable: the decliners dropping more than 4% halved from 2.7% to just 1.2%, suggesting heavy selling is drying up rapidly.
So what's different? Primarily, momentum is showing follow-through, two good breadth days in a row, both backed by macro optimism (the Vietnam trade deal and expectations of a potential Fed rate cut following weaker ADP numbers).
Caution Flags Still Worth Watching
Let’s not get overly euphoric. While trends have turned bullish short term, some caution lights still blink:
New highs are not exploding higher; 5.9% is positive but not euphoric.
Longer-term trend strength (SMA200+) is still just at 52.9%. That means nearly half the market remains structurally weak.
Conclusion: The Trend Has Turned, But It’s Still Early
Market breadth data as of July 2 confirms broad and improving participation. With two solid days of buying and a continued uptick in key moving average metrics, the market’s internal health looks meaningfully better.
This isn’t a screaming breakout just yet, but it’s an undeniable step in the right direction.
If Thursday’s non-farm payrolls report (released early due to the July 4 holiday) confirms continued weakness in the labor market, we may get our next catalyst, possibly a dovish Fed shift.
Until then, breadth is holding steady, but the real test of durability comes in the next few sessions.
Kristoff - Co-founder, ChartMill
Next to read: Market Monitor News, July 02