Market Monitor Trends and Breadth July 02 BMO
By Kristoff De Turck - reviewed by Aldwin Keppens
Last update: Jul 2, 2025
(All data & visualisations by ChartMill.com)
Daily Market Trend Analysis – July 01, 2025 (After Market Close)
Powerful breakout for the Russel 2000 ETF (IWM).
Short Term Trend
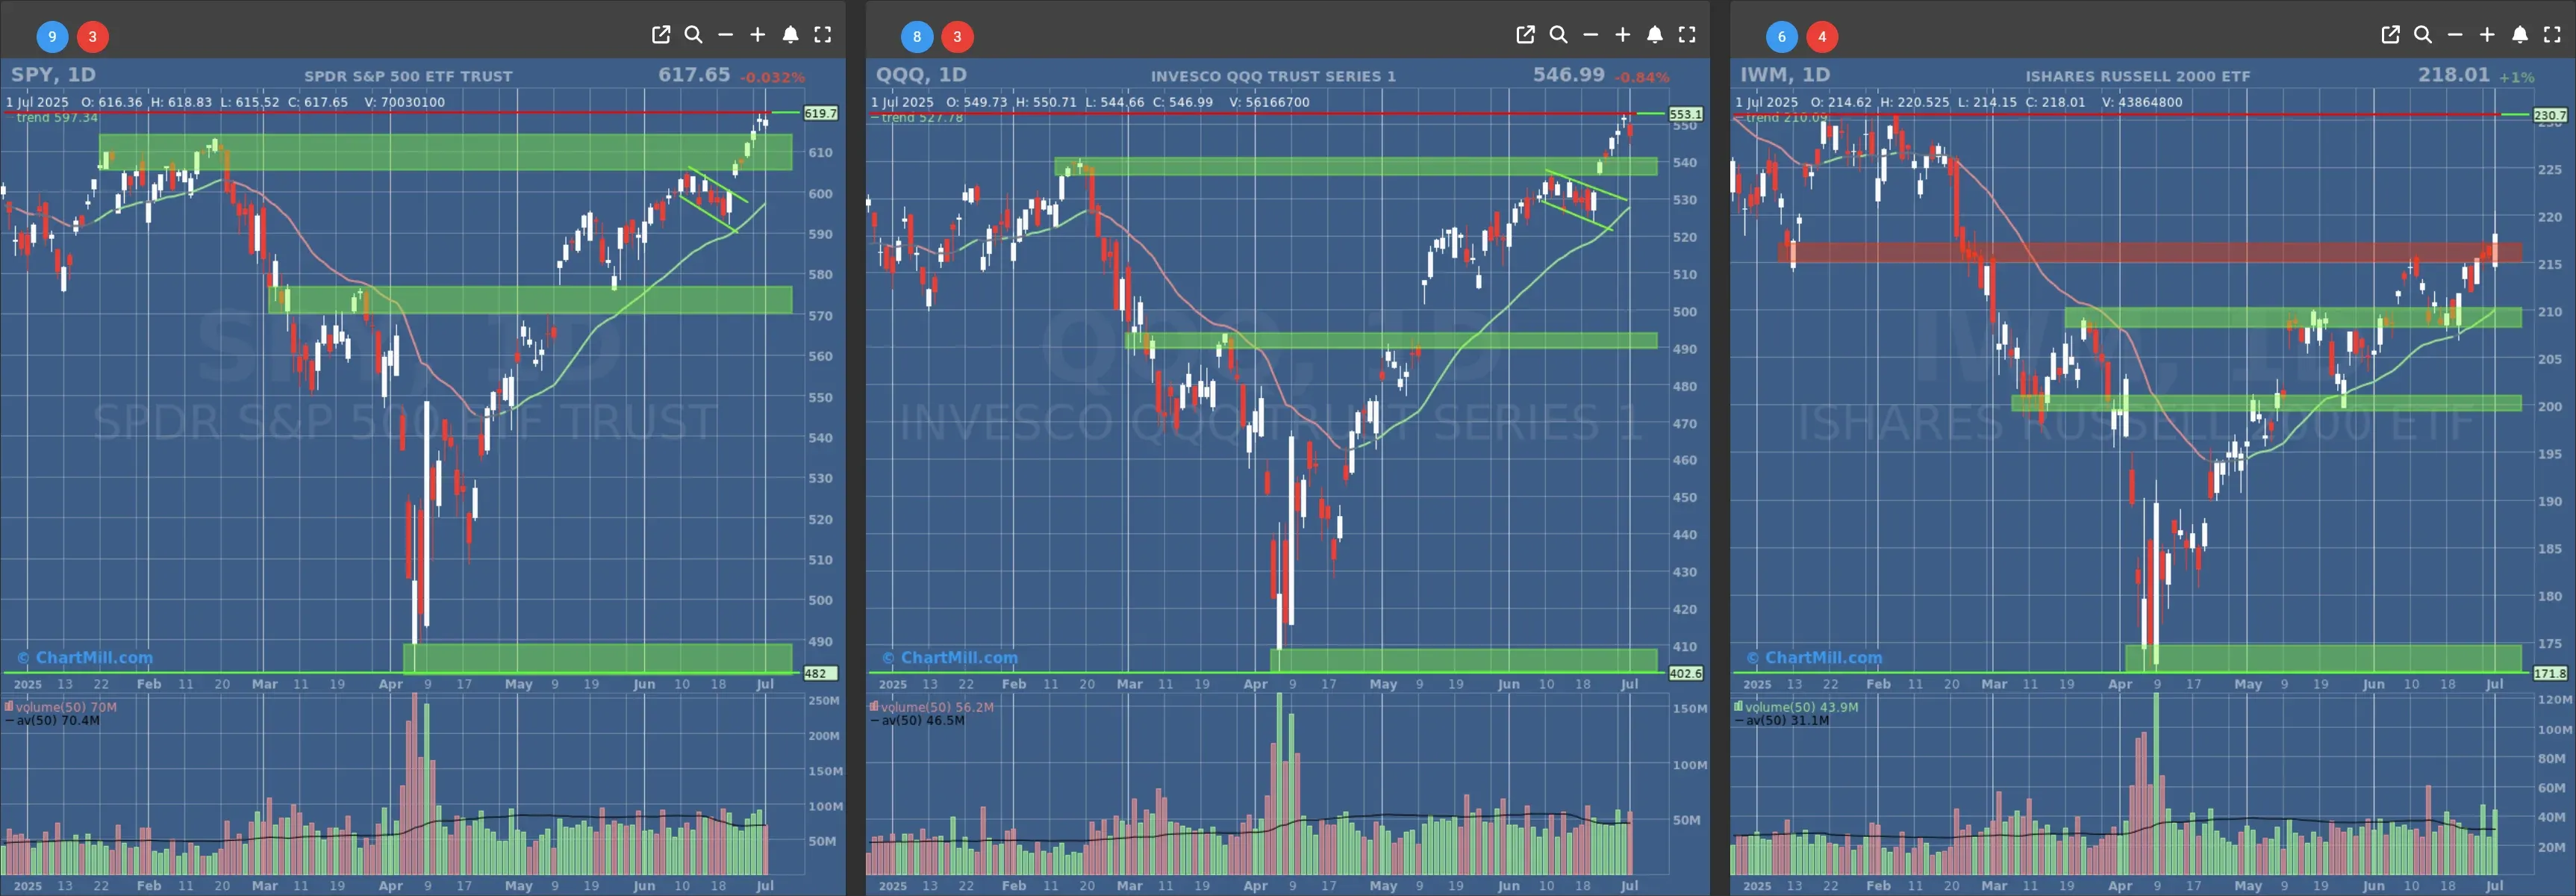
- Short-Term Trend: Bullish (no change)
- Next Support at $600 to $610
- Next Resistance at /
- Volume: At Average (50)
- Pattern: Down Day
- Short-Term Trend: Bullish (no change)
- Next Support at $540
- Next Resistance at /
- Volume: Above Average (50)
- Pattern: Down Day
- Short-Term Trend: Bullish (no change)
- Next Support at $210
- Next Resistance at $215 to $220
- Volume: Above Average (50)
- Pattern: Bullish Engulfing, breakout above resistance
Long Term Trend
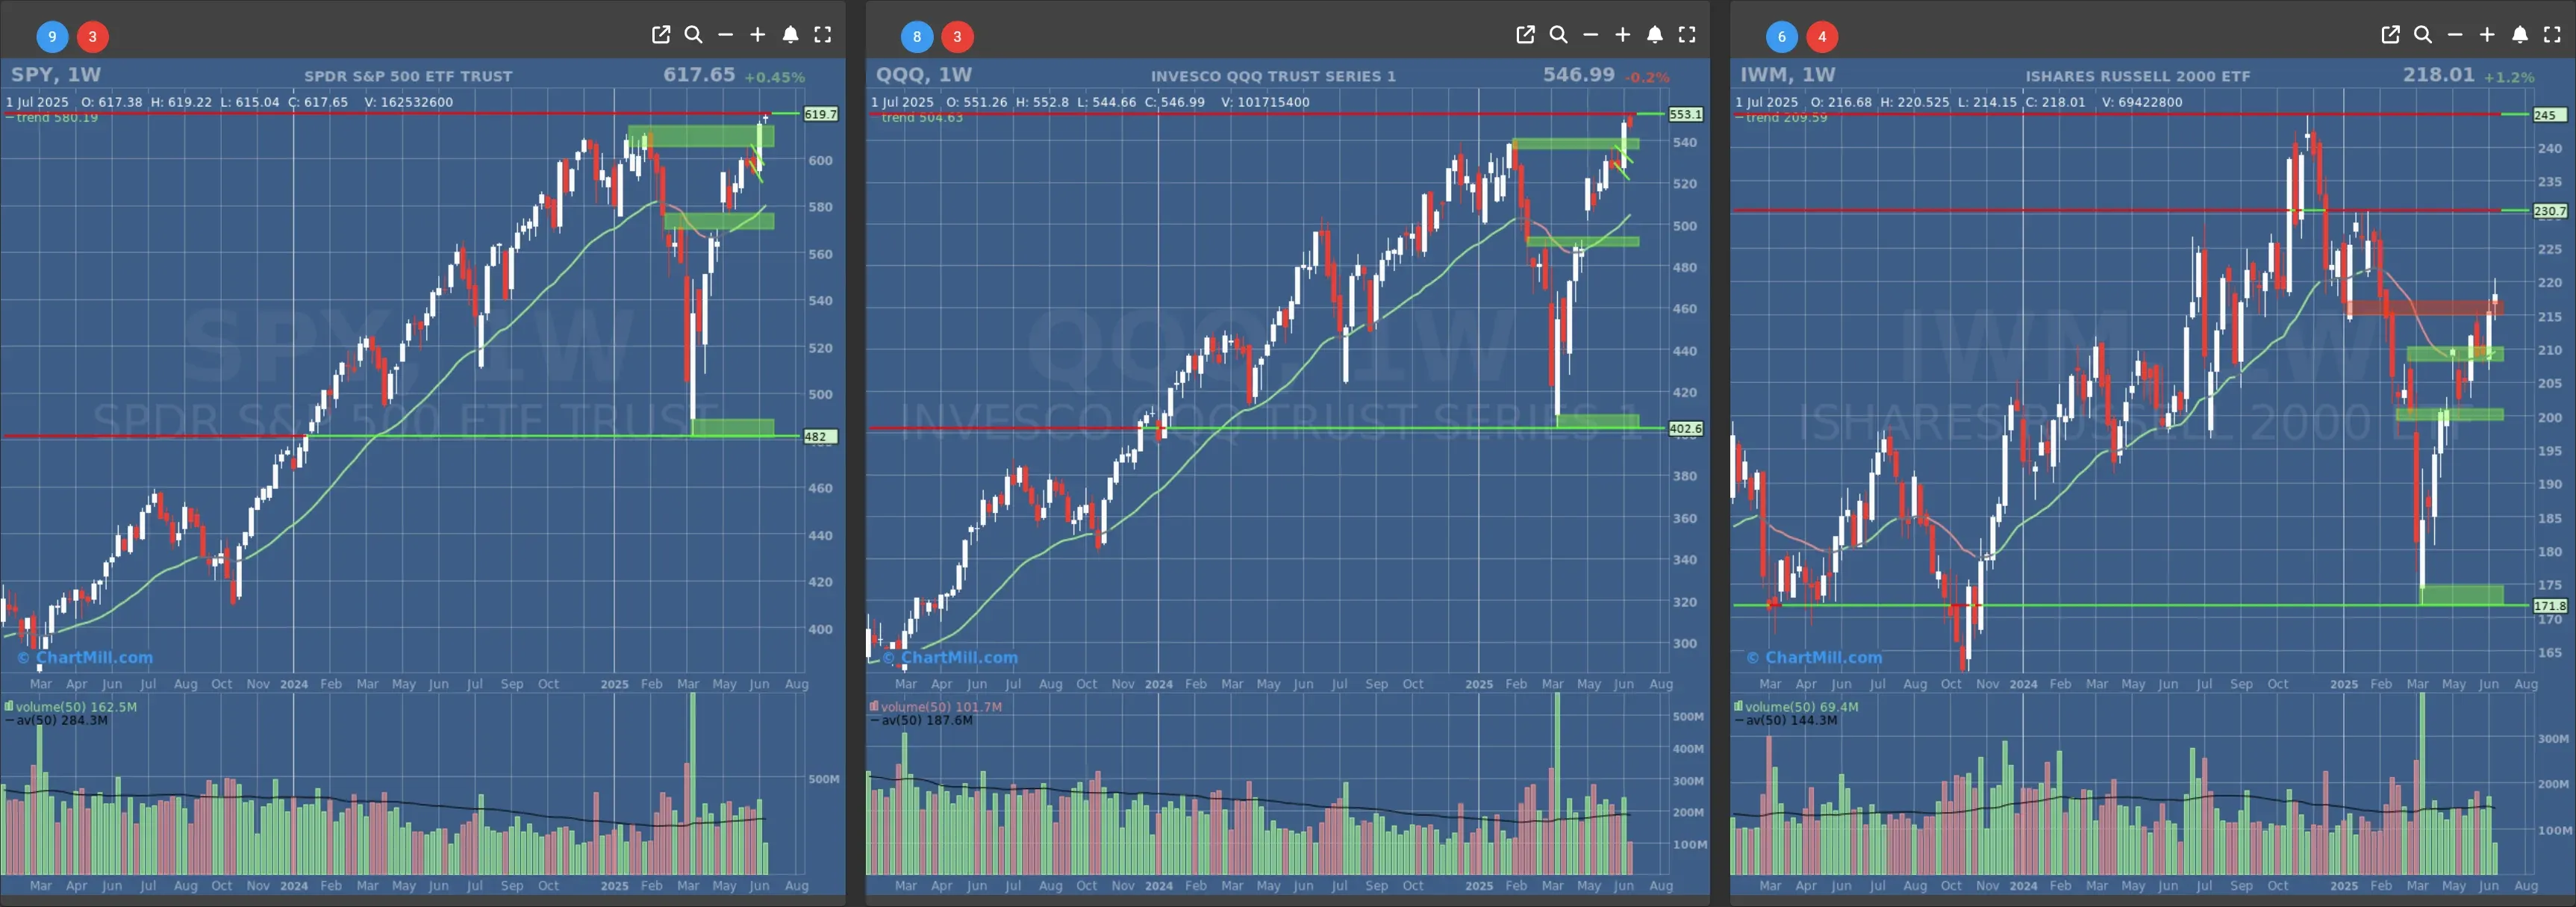
- Long-Term Trend: Positive (no change)
- Long-Term Trend: Positive (no change)
- Long-Term Trend: Positive (changed from neutral) - not confirmed, weekcandle closes on friday
Daily Market Breadth Analysis – July 01, 2025 (After Market Close)
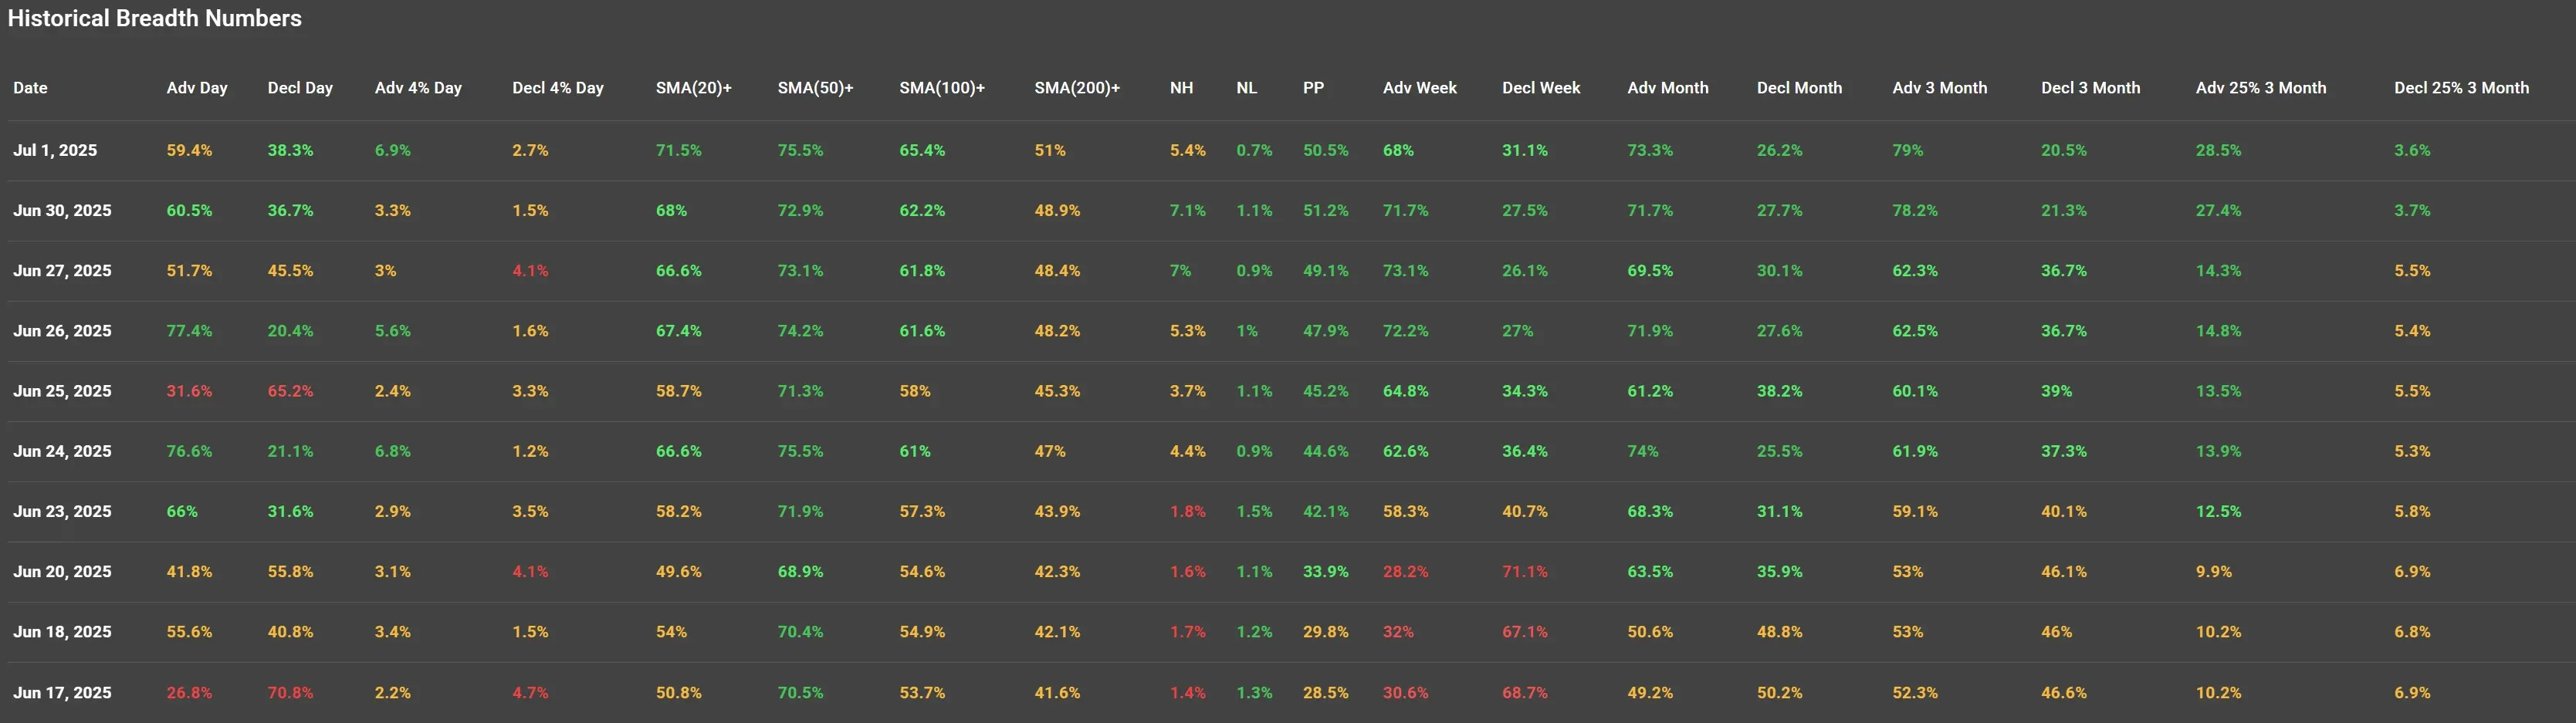
Market internals for Monday, July 1, 2025, suggest that bulls are still in control, but not quite marching in formation like they were last week. The breadth remains constructive, but the strength is becoming a little uneven beneath the surface.
Let’s dig into what the numbers say and how they compare to Friday’s robust finish.
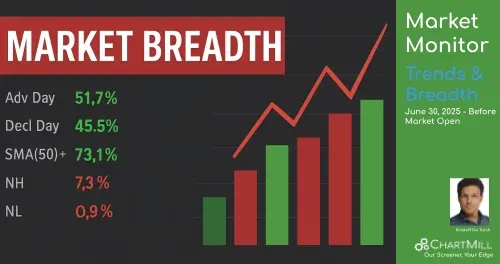
Advancers vs. Decliners: Still Positive, But Softening
After Friday’s solid 60.5% advancers, Monday cooled slightly to 59.4%, while decliners crept up to 38.3%. Not a red flag, but a small signal that the upside thrust might be running out of steam, or taking a well-earned pause after the strong June finish.
More notably, the number of stocks advancing more than 4% rose to 6.9%, doubling Friday’s 3.3%. That’s encouraging, some real strength in select names, even if the index-level movement was muted. Meanwhile, only 2.7% of stocks fell more than 4%, which is still relatively low and stable.
Moving Average Participation: Strength Persists Across Timeframes
Here's where the bullish picture still holds up clearly. The percentage of stocks trading above key moving averages ticked higher across all key timeframes:
-
Above 20-day SMA: 71.5% (up from 68%)
-
Above 50-day SMA: 75.5% (up from 72.9%)
-
Above 100-day SMA: 65.4% (up from 62.2%)
-
Above 200-day SMA: 51% (up from 48.9%)
Crossing above 50% on the 200-day SMA is a key milestone. It tells me the market isn’t just riding short-term momentum, it’s now broadly showing long-term technical strength.
This kind of across-the-board advance usually aligns with market-wide buying pressure, not just a few mega caps dragging everything up.
New Highs and Lows: Stable, But Not Exciting
-
New Highs (NH): 5.4%
-
New Lows (NL): 0.7%
New highs came down slightly from 7.1% on Friday, but it’s still a healthy margin over the new lows. Nothing dramatic, just a little consolidation after Friday’s exuberance. Ideally, we’d want NH to accelerate from here to signal another leg higher. For now, it’s “good enough.”
Weekly and Monthly Breadth Trends: Longer-Term Trends Hold Strong
Looking at the weekly and monthly advancing trends, there's confirmation of strong participation across timeframes:
-
Weekly Advancers: 68% (vs. 71.7% on Friday)
-
Monthly Advancers: 73.3% (vs. 71.7% on Friday)
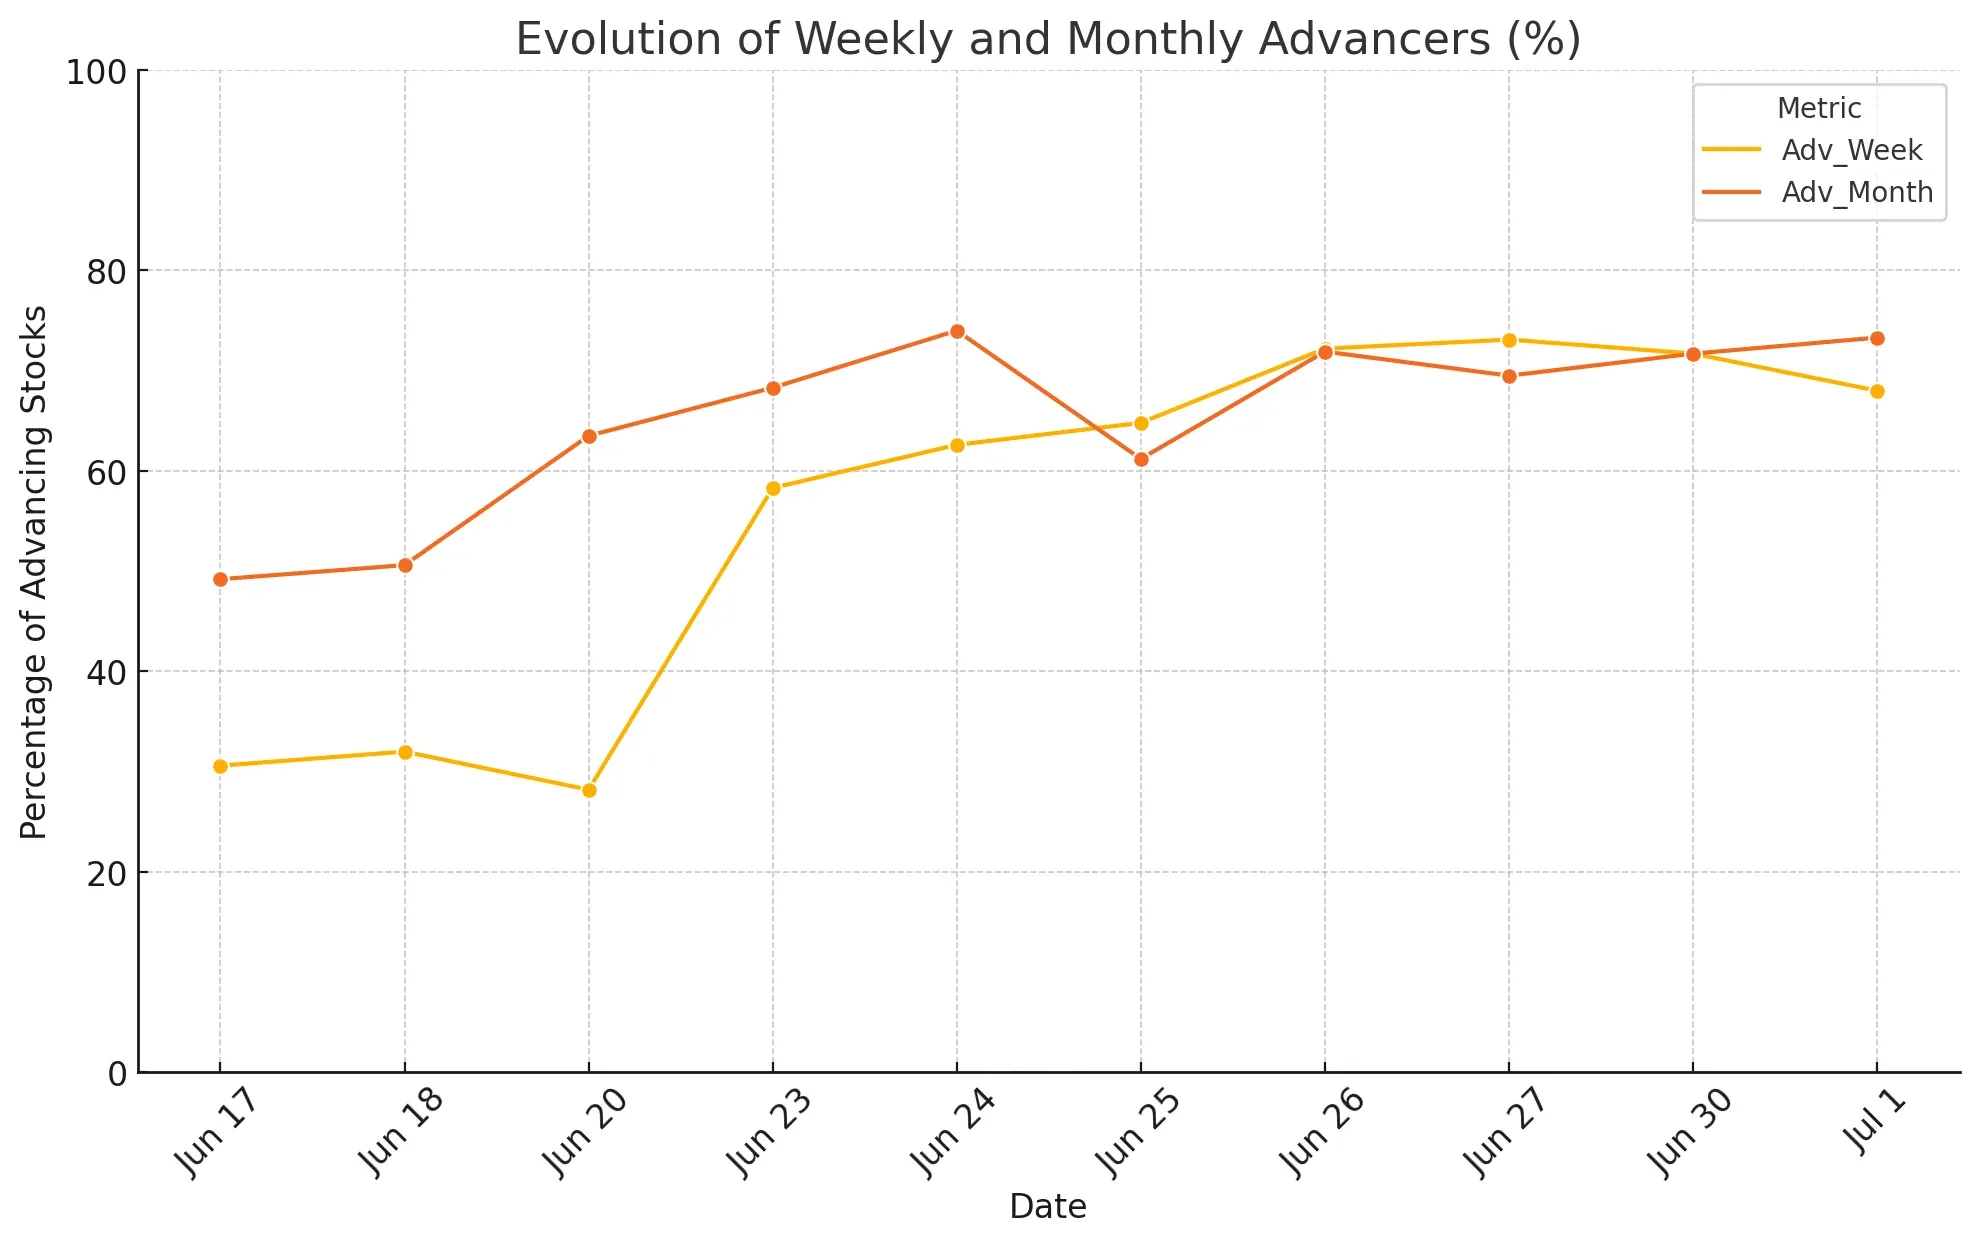
We’ve now seen four straight sessions where more than 68% of stocks are up on the month, and over 70% are trading above their 20-day SMAs. That’s not just a bounce, that’s sustained broad participation.
The Takeaway: Solid Internals, But Watch for Signs of Fatigue
The market breadth remains healthy, make no mistake. Participation across all timeframes is expanding, new highs still outnumber new lows, and the long-term moving average stats look impressive.
But some metrics, like fewer new highs and a slight drop in the weekly momentum, hint that we could be entering a consolidation phase.
This cooling is not entirely unexpected. After June’s ramp-up and with a shortened holiday week ahead (hello July 4th), it’s natural for traders to de-risk slightly. What I’ll be watching tomorrow is whether the strength re-accelerates or quietly stalls.
One thing’s clear: as of Monday, the bulls are still in charge, but they may be shifting from a sprint to a slow jog.
Kristoff - Co-founder, ChartMill
Next to read: Market Monitor News, July 02
223.08
+2.05 (+0.93%)
556.22
+5.42 (+0.98%)
625.34
+4.89 (+0.79%)
Find more stocks in the Stock Screener
IWM Latest News and Analysis
 2 days ago - ChartmillMarket Monitor Trends and Breadth July 02 BMO
Breadth Check: Market Still Holding Up — But the Momentum Is Looking a Bit Tired
 3 days ago - ChartmillMarket Monitor Trends and Breadth July 01 BMO
Market Breadth Holds Strong as Quarter Ends With Momentum
 4 days ago - ChartmillMarket Monitor Trends and Breadth June 30 BMO
Stocks Hold the Line, but Under the Surface? Mixed Signals Persist
 7 days ago - ChartmillMarket Monitor Trends and Breadth June 27
Market Breadth Roars Back: Bulls Reclaim Control, But Will They Hold the Line?
 8 days ago - ChartmillMarket Monitor Trends and Breadth June 26
Breadth Falters Again as Bulls Lose Steam After One-Day Comeback
 9 days ago - ChartmillMarket Monitor Trends BMO (SPY, QQQ, IWM) and Breadth June 25
Breadth Bounces Back: The Rally Finds Broader Legs
 10 days ago - ChartmillMarket Monitor Trends BMO (SPY, QQQ, IWM) and Breadth June 24
Market breadth bounces back, more stocks trading above key averages as bullish momentum builds after last week's chop.
 11 days ago - ChartmillMarket Monitor Trends BMO (SPY, QQQ, IWM) and Breadth June 23
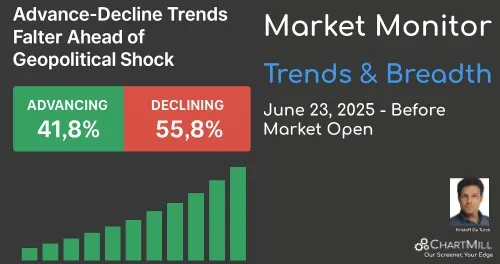
Market internals weaken ahead of U.S. strike on Iran; advance-decline ratios and breadth metrics flash growing risk aversion.
 14 days ago - ChartmillMarket Monitor Trends (SPY, QQQ, IWM) and Breadth June 20
Steady But Fragile: Breadth Signals a Market in Flux
 16 days ago - ChartmillMarket Monitor Trends (SPY, QQQ, IWM) and Breadth June 18
The Market Breathes Out Again – But It’s a Nervous Exhale
 17 days ago - ChartmillMarket Monitor Trends (SPY, QQQ, IWM) and Breadth June 17
Friday’s breadth collapse raised some eyebrows, but Monday erased a lot of that doubt.
 18 days ago - ChartmillMarket Monitor Trends (SPY, QQQ, IWM) and Breadth June 16
Sharp Reversal as Breadth Collapses
