Market Monitor Trends and Breadth July 01 BMO
By Kristoff De Turck - reviewed by Aldwin Keppens
Last update: Jul 1, 2025

(All data & visualisations by ChartMill.com)
Daily Market Trend Analysis – June 30, 2025 (After Market Close)
SPY and QQQ are rising steadily. IWM is attempting to break through the resistance level at $215.
Short Term Trend
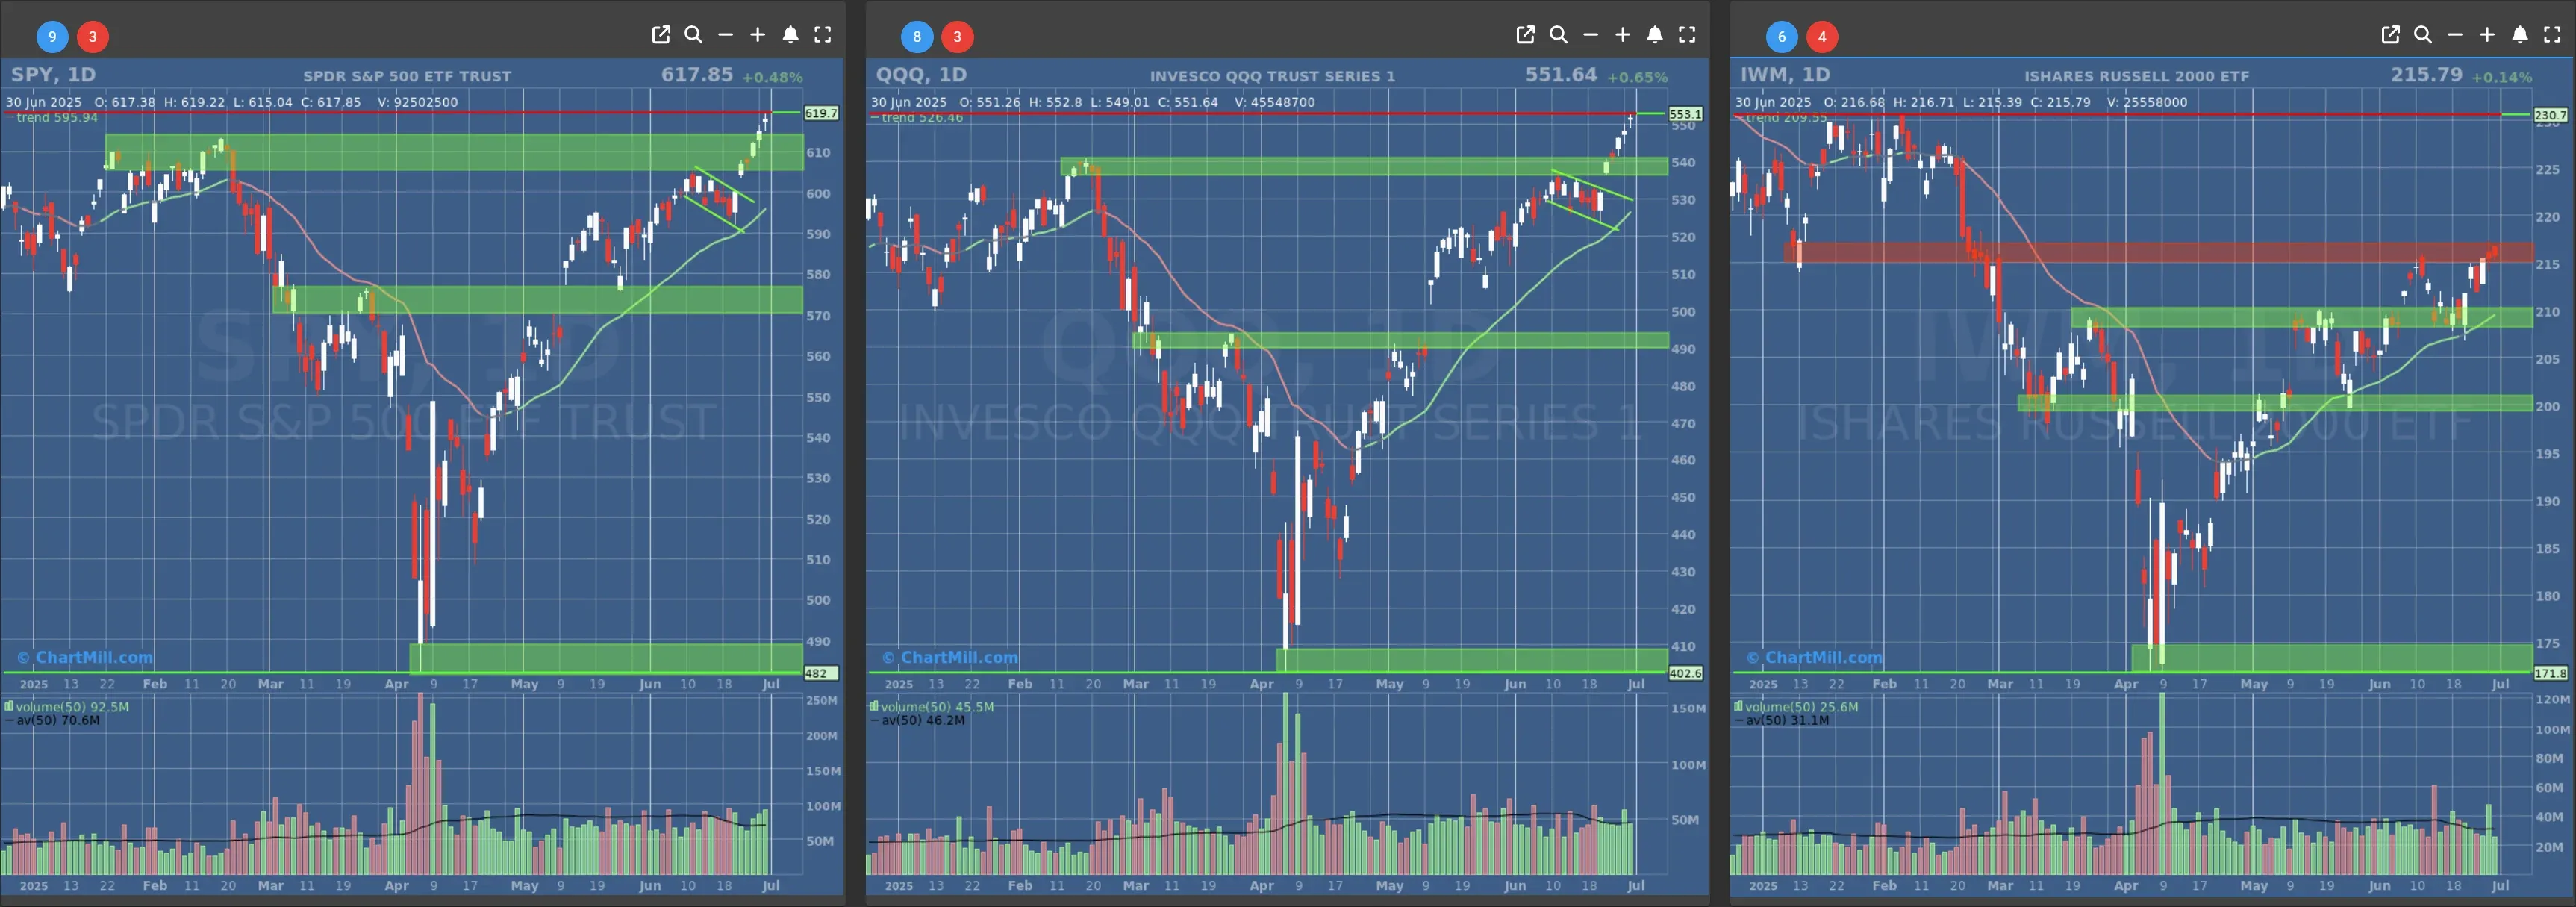
- Short-Term Trend: Bullish (no change)
- Next Support at $600 to $610
- Next Resistance at /
- Volume: Above Average (50)
- Pattern: Hanging Man Candle
- Short-Term Trend: Bullish (no change)
- Next Support at $540
- Next Resistance at /
- Volume: At Average (50)
- Pattern: Hanging Man Candle
- Short-Term Trend: Bullish (no change)
- Next Support at $210
- Next Resistance at $215 to $220
- Volume: Below Average (50)
- Pattern: Down Day, struggling at resistance
Long Term Trend
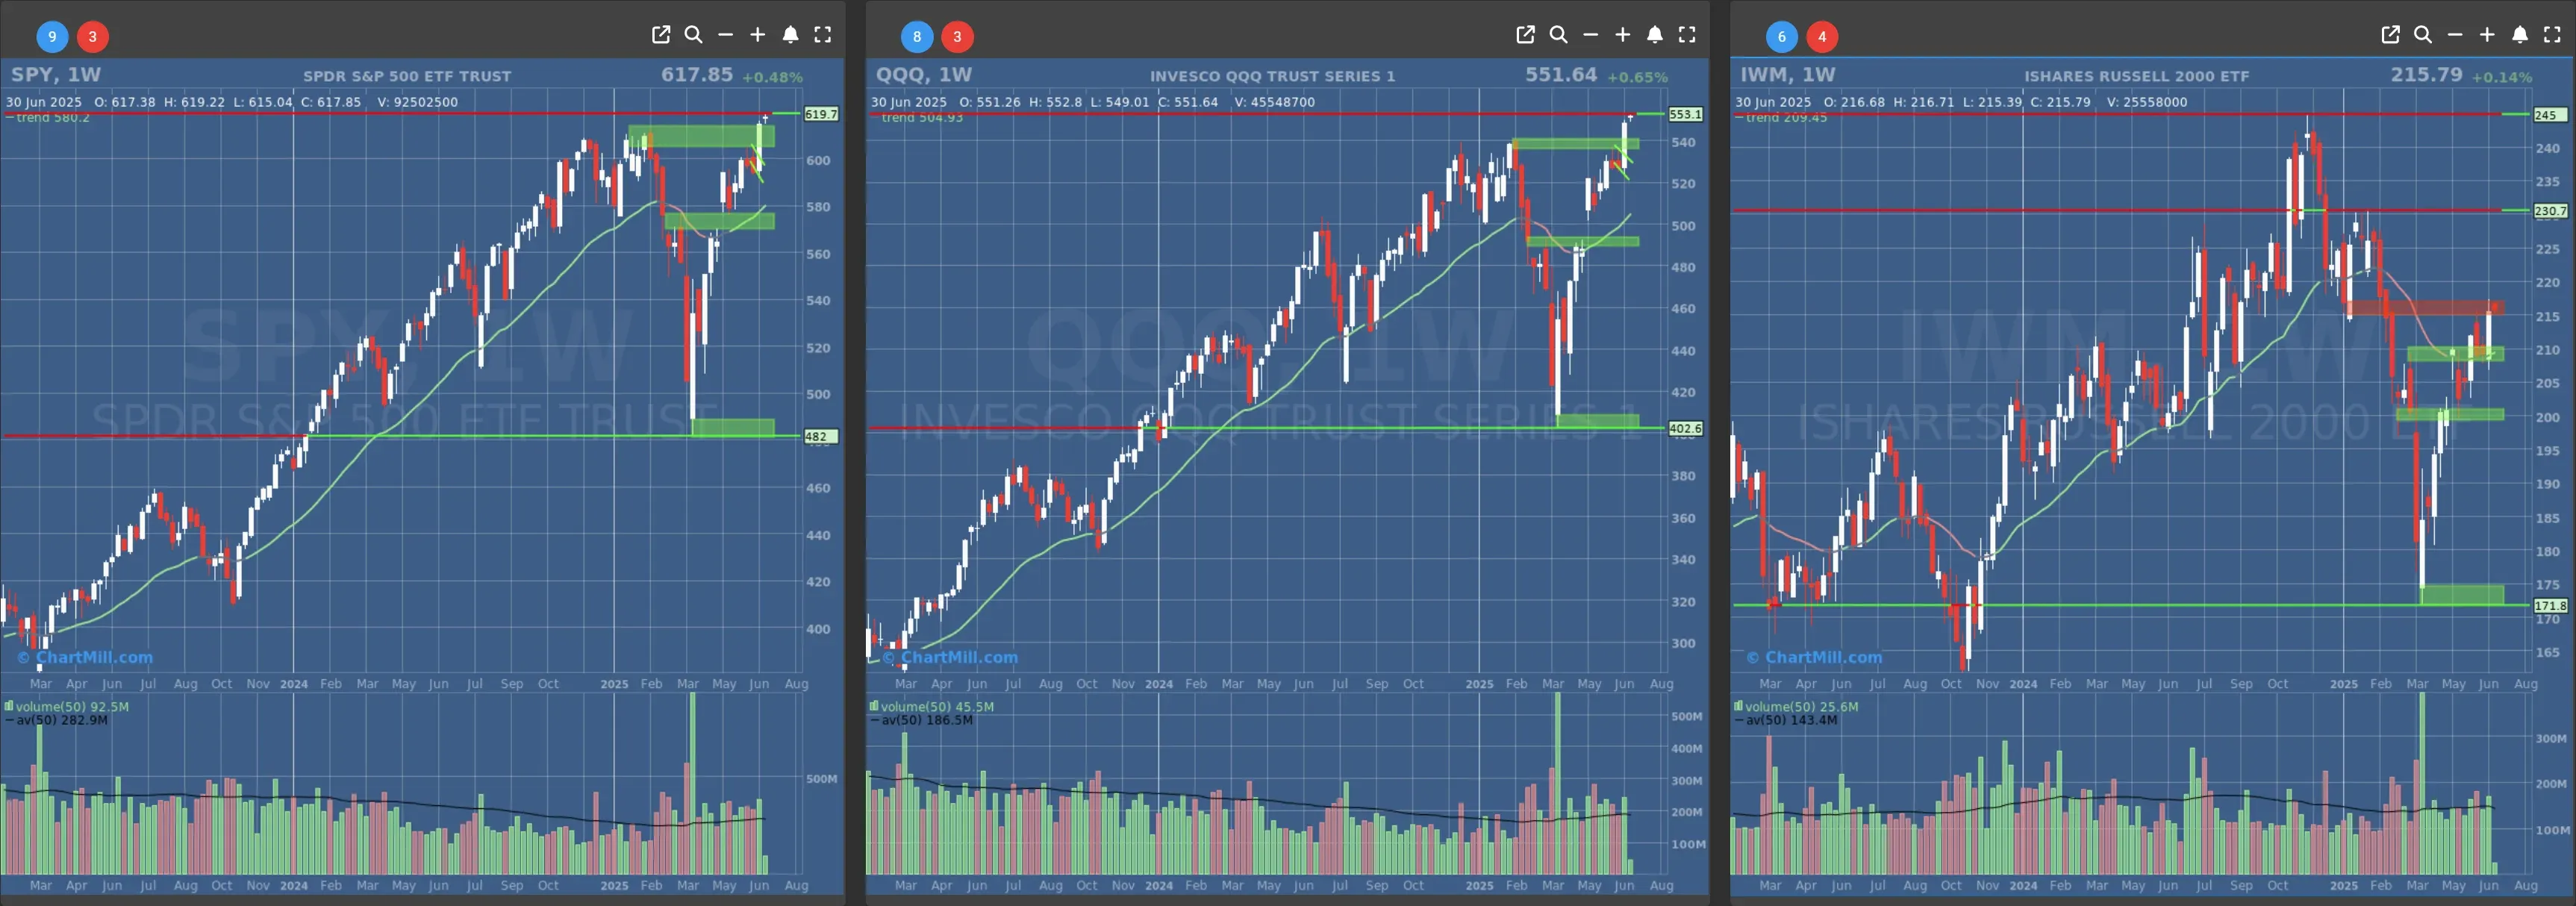
- Long-Term Trend: Positive (no change)
- Long-Term Trend: Positive (no change)
- Long-Term Trend: Positive (changed from neutral) - not confirmed, weekcandle closes on friday
Daily Market Breadth Analysis – June 30, 2025 (After Market Close)
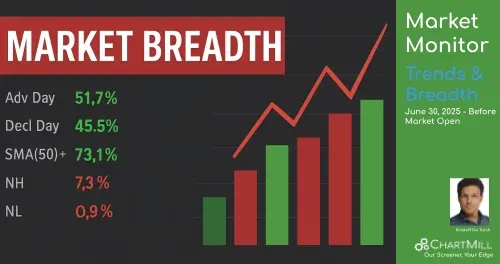
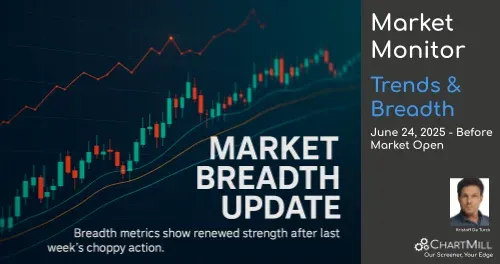
Market Breadth Holds Strong as Quarter Ends With Momentum
The last trading day of June capped off a powerful quarter with another broadly positive market breadth session, suggesting continued momentum, though not without some signs of underlying divergence.
As I dig through the numbers for June 30, 2025, I see strength on the surface, but with a few indicators flashing amber for the attentive eye.
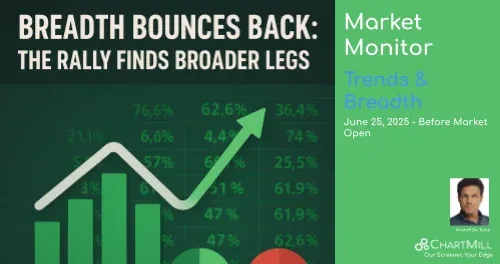
Green to Close Q2: Breadth Favors Bulls Again
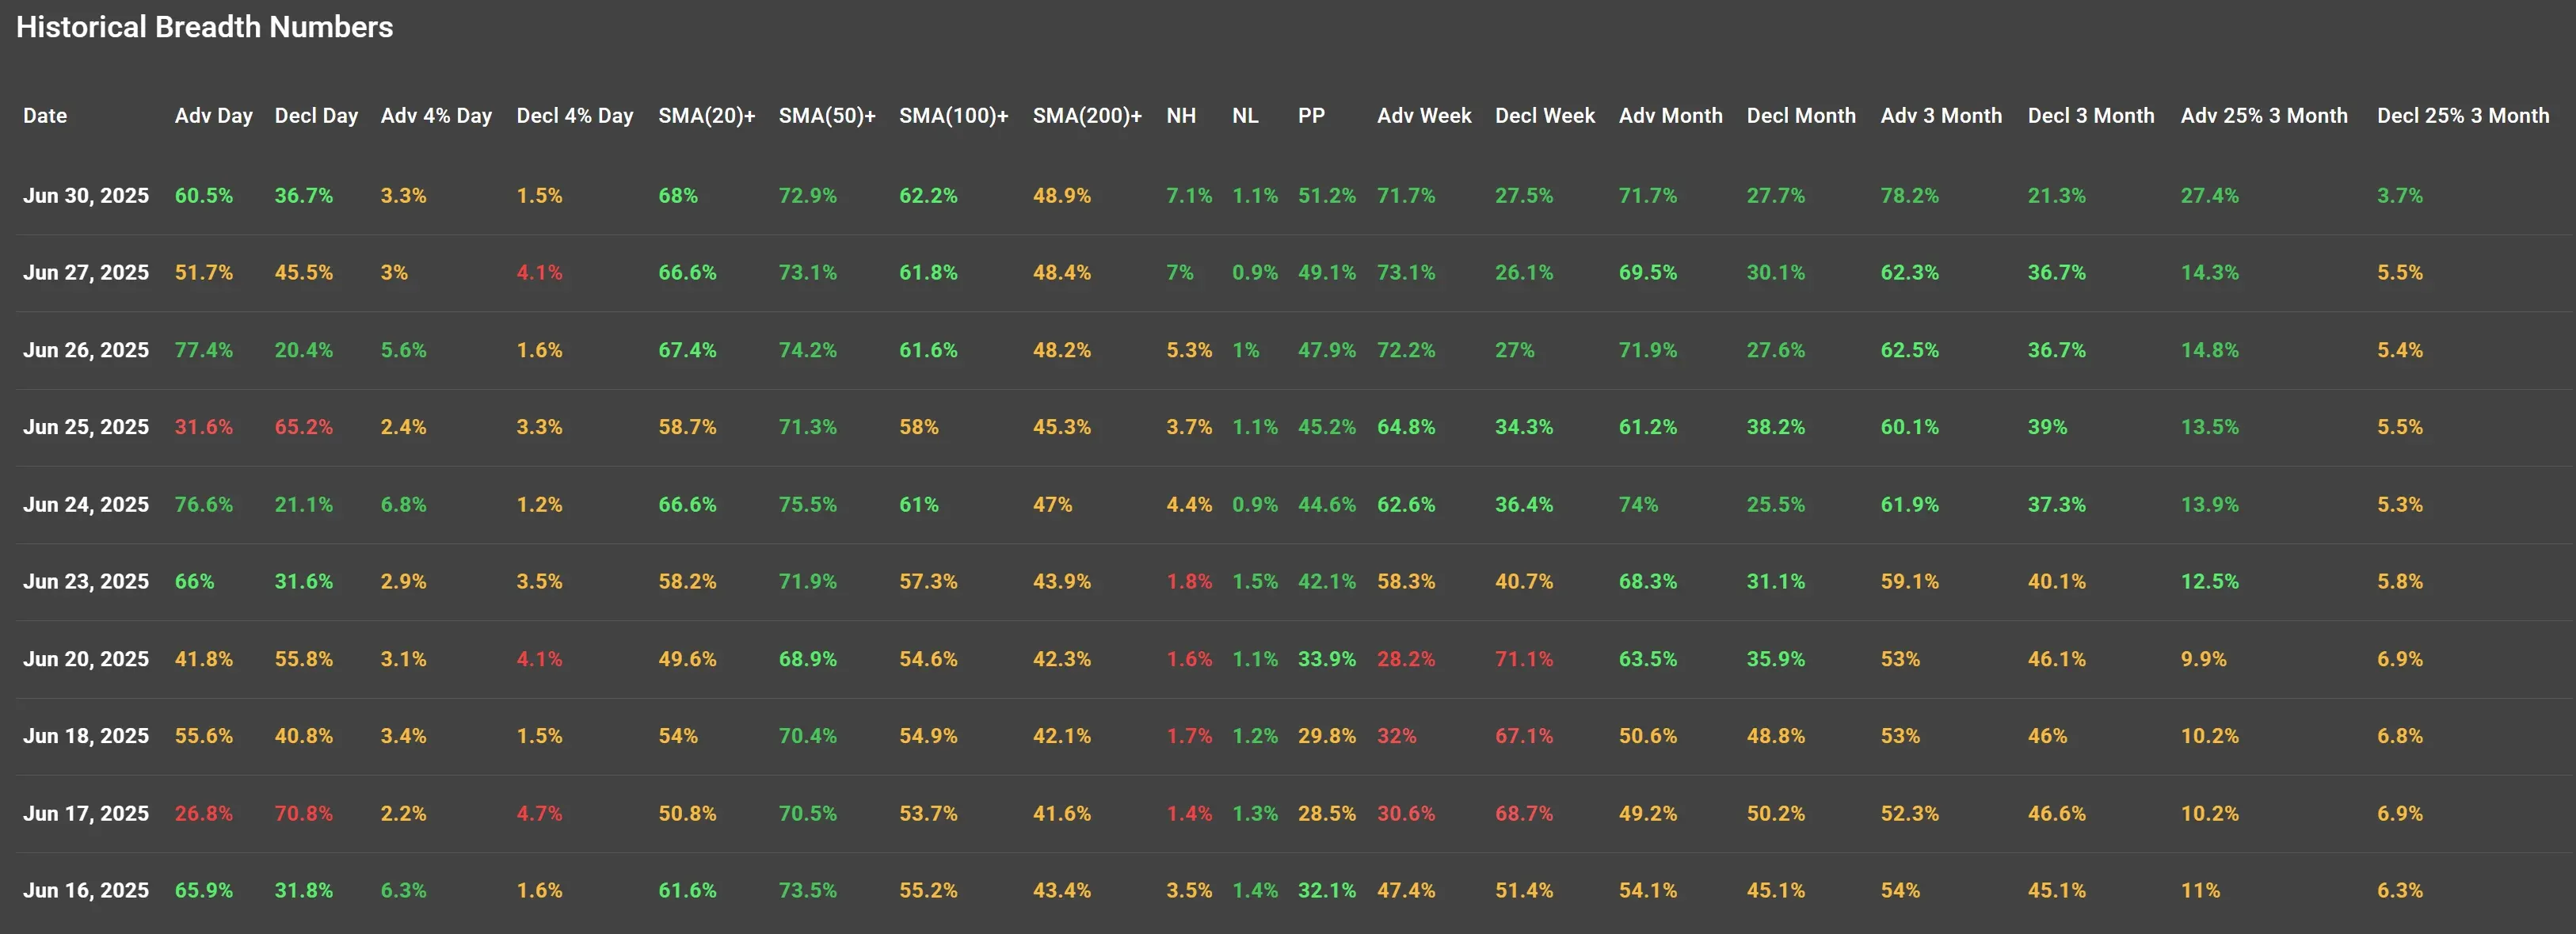
On June 30, 60.5% of stocks advanced, while only 36.7% declined, a solid breadth reading that confirms the ongoing bullish momentum we've seen over the past week. This is now the third out of the last five sessions showing advancing stocks exceeding 60%, and the second time this week (after June 26’s 77.4%) that breadth outpaced even the headline indices.
But let’s not stop at the surface...
Only 3.3% of stocks rose more than 4%, and just 1.5% declined more than 4%, both low figures, implying the day lacked significant high-momentum breakouts or breakdowns. In other words, this was a steady market lift, not a rip-your-face-off rally.
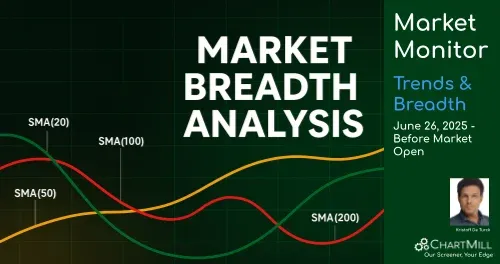
Moving Averages: A Quiet but Important Shift
When analyzing how many stocks are trading above their respective moving averages:
SMA Level % Above on Jun 30 Trend from Jun 24
SMA(20) 68% ↑ from 66.6%
SMA(50) 72.9% ↓ from 75.5%
SMA(100) 62.2% ↑ from 61%
SMA(200) 48.9% ↑ from 47%
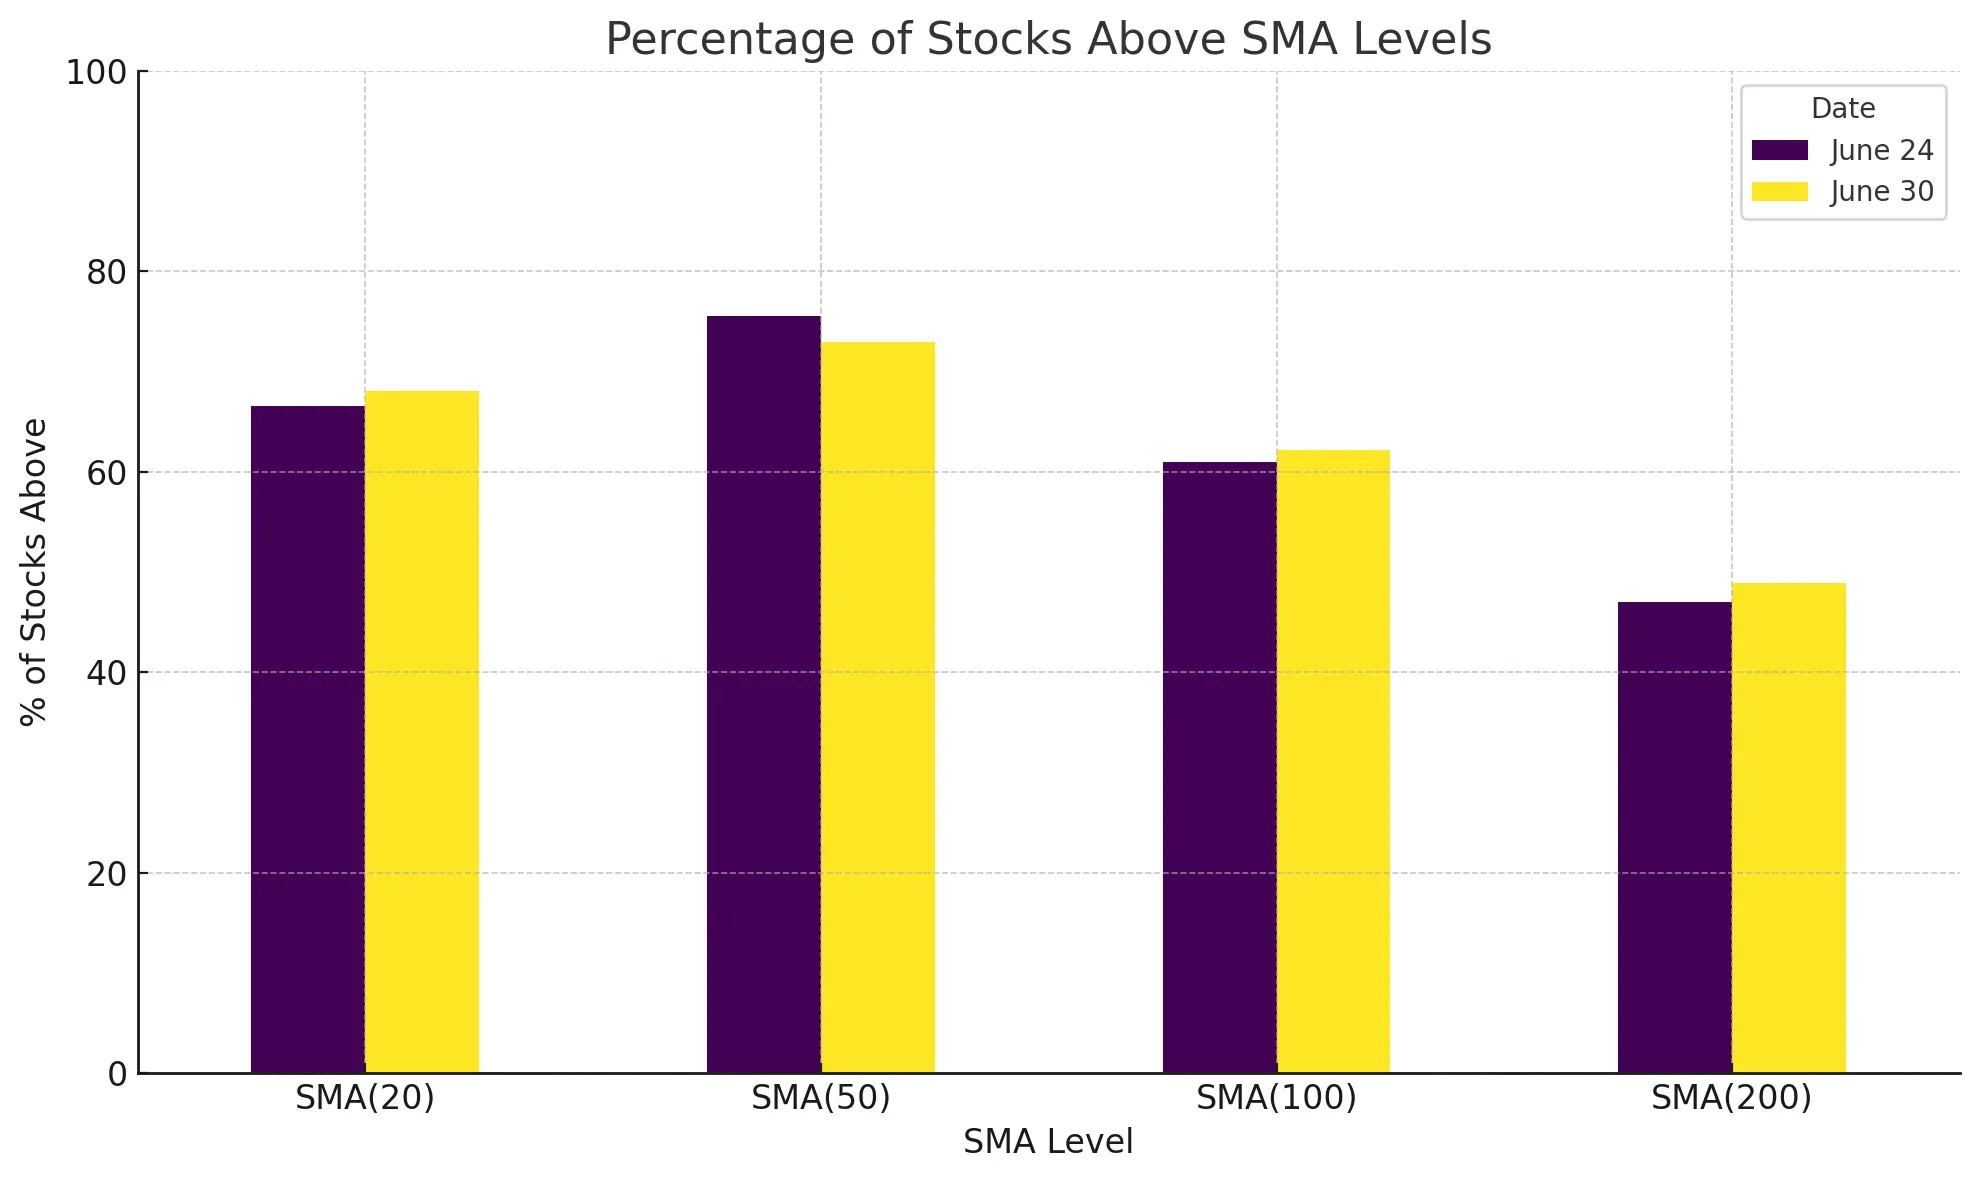
The percentage of stocks above their 200-day SMA (arguably the most telling long-term trend indicator) climbed slightly to 48.9%, the highest since June 16. While still under 50%, the trajectory is promising.
The market continues inching toward longer-term breadth support, but we're not there yet.
Meanwhile, the shorter-term SMAs (20/50/100) remain strong overall, though the slight dip in SMA(50)+ suggests some near-term consolidation, possibly a reflection of the slow summer-style melt-up.
NH/NL: New Highs Wake Up, New Lows Flatten
We also saw an uptick in New Highs (7.1%), the best figure of the 10-day span and an encouraging sign that leadership is re-emerging. On the flip side, New Lows (1.1%) remain subdued, flatlining in a healthy range.
This signals low internal deterioration, which is a necessary condition for sustained upside.
Week and Month View: Broader Participation Confirmed
On a weekly basis, Advancers beat Decliners 71.7% to 27.5%, reinforcing that the strong finish wasn’t a one-day wonder.
The monthly picture remains firm too:
-
Advancers (Month): 71.7%
-
Decliners (Month): 27.7%
This is the most bullish Adv/Decl monthly spread we’ve seen in weeks.
Even the 3-month view looks good: Advancers at 78.2%, with Decliners at just 21.3%, that’s about as solid a medium-term breadth setup as you’ll find.
And the Adv 25% 3M (stocks up 25%+ in the last 3 months) came in at 27.4%, the highest number on the 10-day chart.
This confirms that underlying strength is spreading into more stocks, and importantly, into more strongly trending names—a bullish undertone for active traders and momentum strategies.
Final Take: Broad Strength with a Hint of Rotation
So what does all this mean for your portfolio?
Despite the bullish headlines and record index levels, the real story is this: breadth is holding up nicely, but it’s not euphoric. Leadership is still forming, momentum breakouts are controlled, and participation across timeframes is widening.
It’s a constructive backdrop, especially with the quarter-end window dressing now in the rear-view mirror.
If this tone holds into the shortened holiday week, we could see some rotation-driven setups emerge, particularly among stocks above their 100- and 200-day SMAs, which are quietly regaining ground.
Stay nimble, and don’t chase, but this is a breadth landscape worth respecting.
Kristoff - Co-founder, ChartMill
Next to read: Market Monitor News, July 01
221.03
+3.02 (+1.39%)
550.8
+3.81 (+0.7%)
620.45
+2.8 (+0.45%)
Find more stocks in the Stock Screener
IWM Latest News and Analysis
 a day ago - ChartmillMarket Monitor Trends and Breadth July 02 BMO
Breadth Check: Market Still Holding Up — But the Momentum Is Looking a Bit Tired
 2 days ago - ChartmillMarket Monitor Trends and Breadth July 01 BMO
Market Breadth Holds Strong as Quarter Ends With Momentum
 3 days ago - ChartmillMarket Monitor Trends and Breadth June 30 BMO
Stocks Hold the Line, but Under the Surface? Mixed Signals Persist
 6 days ago - ChartmillMarket Monitor Trends and Breadth June 27
Market Breadth Roars Back: Bulls Reclaim Control, But Will They Hold the Line?
 7 days ago - ChartmillMarket Monitor Trends and Breadth June 26
Breadth Falters Again as Bulls Lose Steam After One-Day Comeback
 8 days ago - ChartmillMarket Monitor Trends BMO (SPY, QQQ, IWM) and Breadth June 25
Breadth Bounces Back: The Rally Finds Broader Legs
 9 days ago - ChartmillMarket Monitor Trends BMO (SPY, QQQ, IWM) and Breadth June 24
Market breadth bounces back, more stocks trading above key averages as bullish momentum builds after last week's chop.
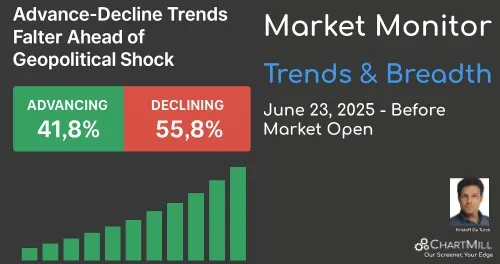 10 days ago - ChartmillMarket Monitor Trends BMO (SPY, QQQ, IWM) and Breadth June 23
Market internals weaken ahead of U.S. strike on Iran; advance-decline ratios and breadth metrics flash growing risk aversion.
 13 days ago - ChartmillMarket Monitor Trends (SPY, QQQ, IWM) and Breadth June 20
Steady But Fragile: Breadth Signals a Market in Flux
 15 days ago - ChartmillMarket Monitor Trends (SPY, QQQ, IWM) and Breadth June 18
The Market Breathes Out Again – But It’s a Nervous Exhale
 16 days ago - ChartmillMarket Monitor Trends (SPY, QQQ, IWM) and Breadth June 17
Friday’s breadth collapse raised some eyebrows, but Monday erased a lot of that doubt.
 17 days ago - ChartmillMarket Monitor Trends (SPY, QQQ, IWM) and Breadth June 16
Sharp Reversal as Breadth Collapses
