Doom and gloom...
One glimpse at the weekly charts of the main US stock market indices says it all. The least you can say is that 2022 has started off in a bad way. The S&P500 lost almost 6% on a weekly basis. We have to look back to the period before April 2020 to find comparable figures. That poor performance is oddly contrasted with the quarterly earnings reported so far by the companies in the S&P500 where, in about 4/5 of the cases, earnings were well above analyst expectations.
The decline should be seen in the light of rising inflation and the announcement of interest rate hikes associated with it. As a matter of fact, the outlook is becoming increasingly gloomy.... Some analysts (Goldman Sachs) even expect 5 rate hikes in 2022, with speculation of a first rate increase of 50 basis points.
Hedge fund manager Bill Ackman, among others, believes that such a first rate increase is more than necessary to stop the strong inflationary growth (inflation has reached its highest level in 40 years). It would also send a strong signal that the Fed is serious about tackling inflation and minimizing its impact on the most vulnerable. The comments on next wednesday's interest rate decision are thus certainly eagerly awaited.
Technical View
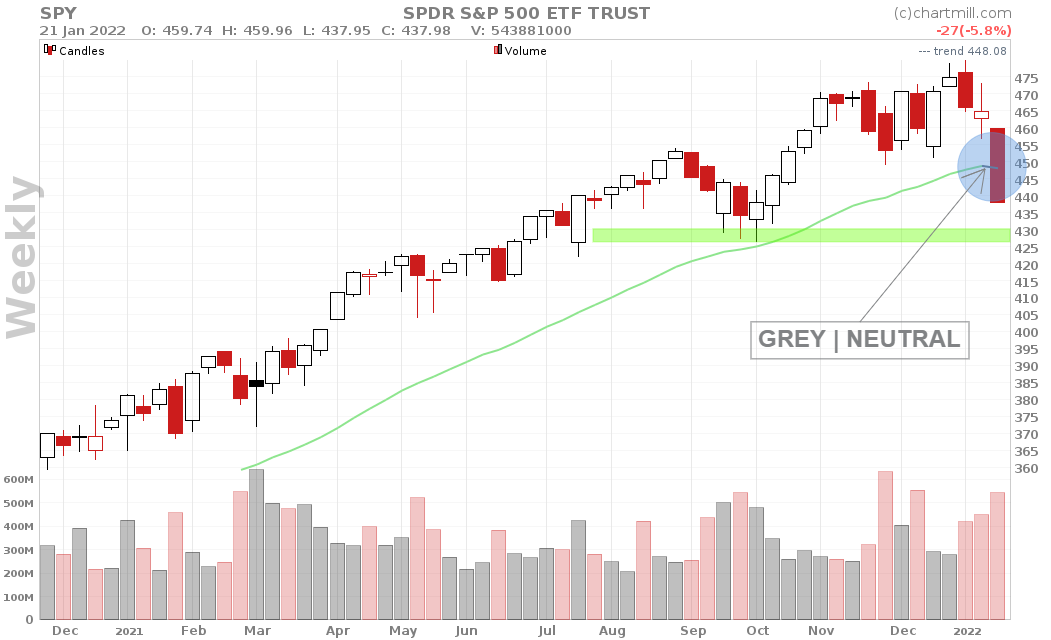
A long red candle and a weekly loss of 5.58%. This is the second week in a row that the ChartMill Trend Indicator has turned gray. Support around $430. The long-term remains neutral for now.

A loss of 7.5% for technology stocks and a closing price ending at the same price level as the previous swing low (+/-$350). This week will be an important one, it is crucial that the QQQ recovers from this price level. A close below the green horizontal bar and a trend indicator that changes in the process from the current gray to red territory would be very negative elements for the long term.
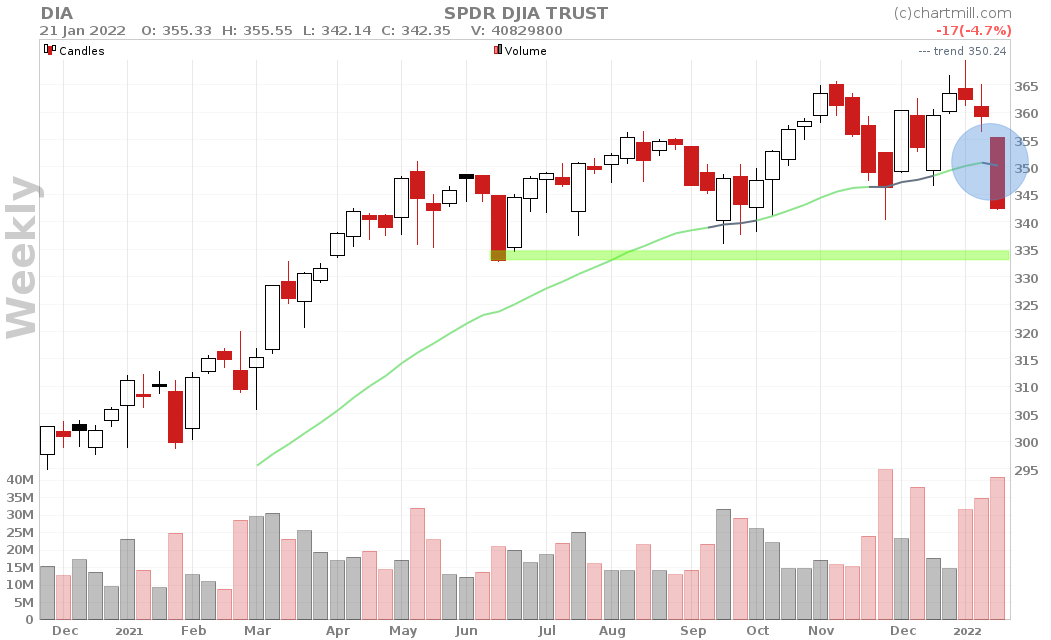
Despite the fact that the DIA also shows a weekly loss of almost 5%, this is still the index that is holding up the best so far. The long-term trend is neutral and there are still some price support levels nearby that could provide some short-term support.
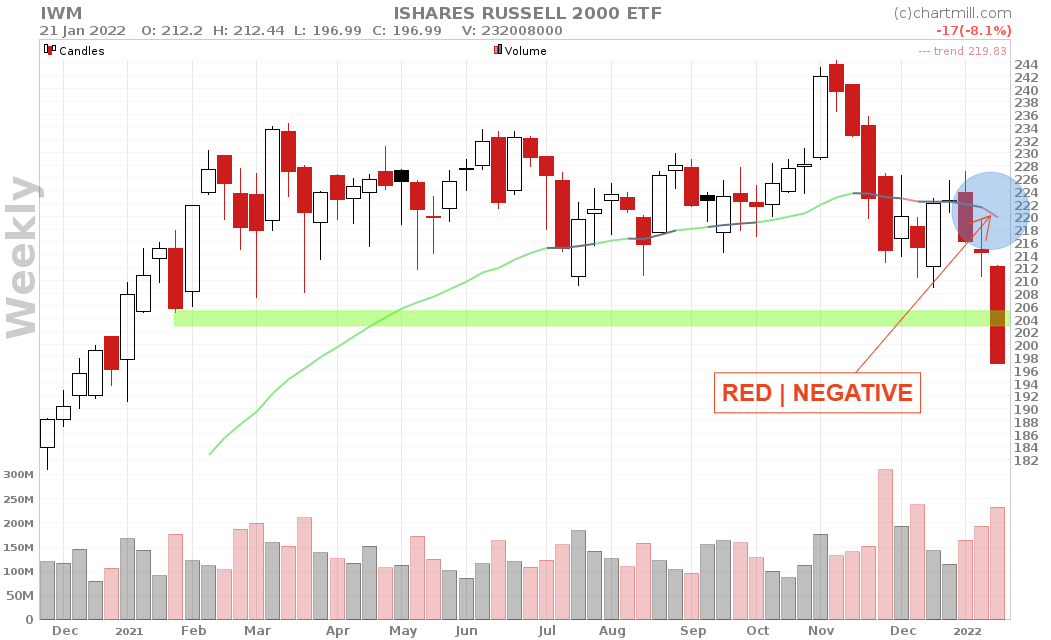
The Russel 2000 is the only index whose long-term picture has already turned to negative. The ChartMill Trend Indicator is turning red for the second consecutive week and the closing price (-8.1%) has clearly broken the last obvious support level downwards.
Conclusion
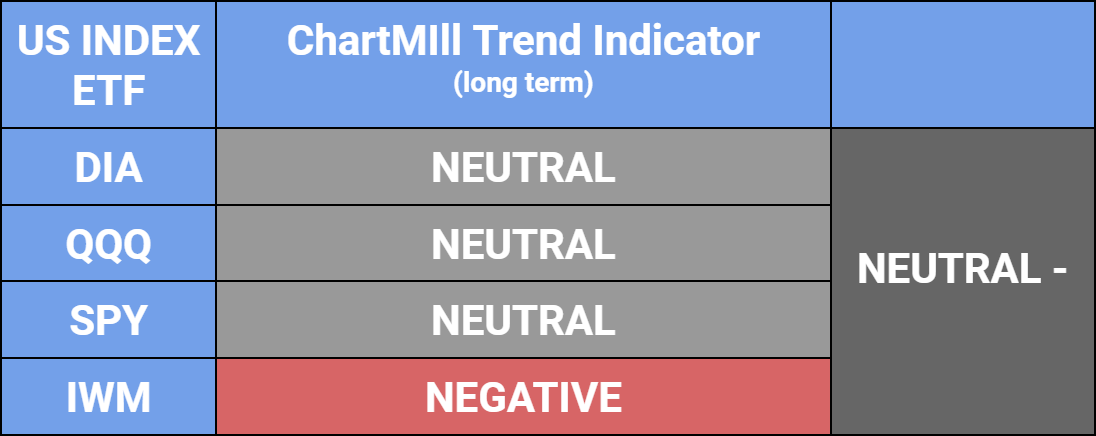
Although the decline is largely driven by sentiment, the numbers are what they are. 3 of the 4 indices are just retaining their neutral status for now based on our technical trend indicator. For the IWM, meanwhile, the long-term switch to negative is a reality. If FED Chairman Jerome Powell succeeds in calming the emotions somewhat next wednesday, this could bring some stability to the market. The question is however, for how long? Soothing words alone are no answer to rising inflation...
As always, trade safe!
The ChartMill Team
![]()
![]()
![]()
![]()