Turbulent times...
The financial markets are jittery, volatility is at an all-time high, and the major stock market ETF-indexes ended lower this week.
This recent increase in nervousness has much to do with the Fed's announcement that bond purchases will be phased out more quickly, the expected end date now being in March 2022. But what was particularly at play was the FED officials' forecast of not two but even three quarter-point interest rate hikes over the course of 2022, in response to the recent report that producer prices rose by more than 9.5% in November compared to last year. The inflationary phantom has thus officially made its appearance....
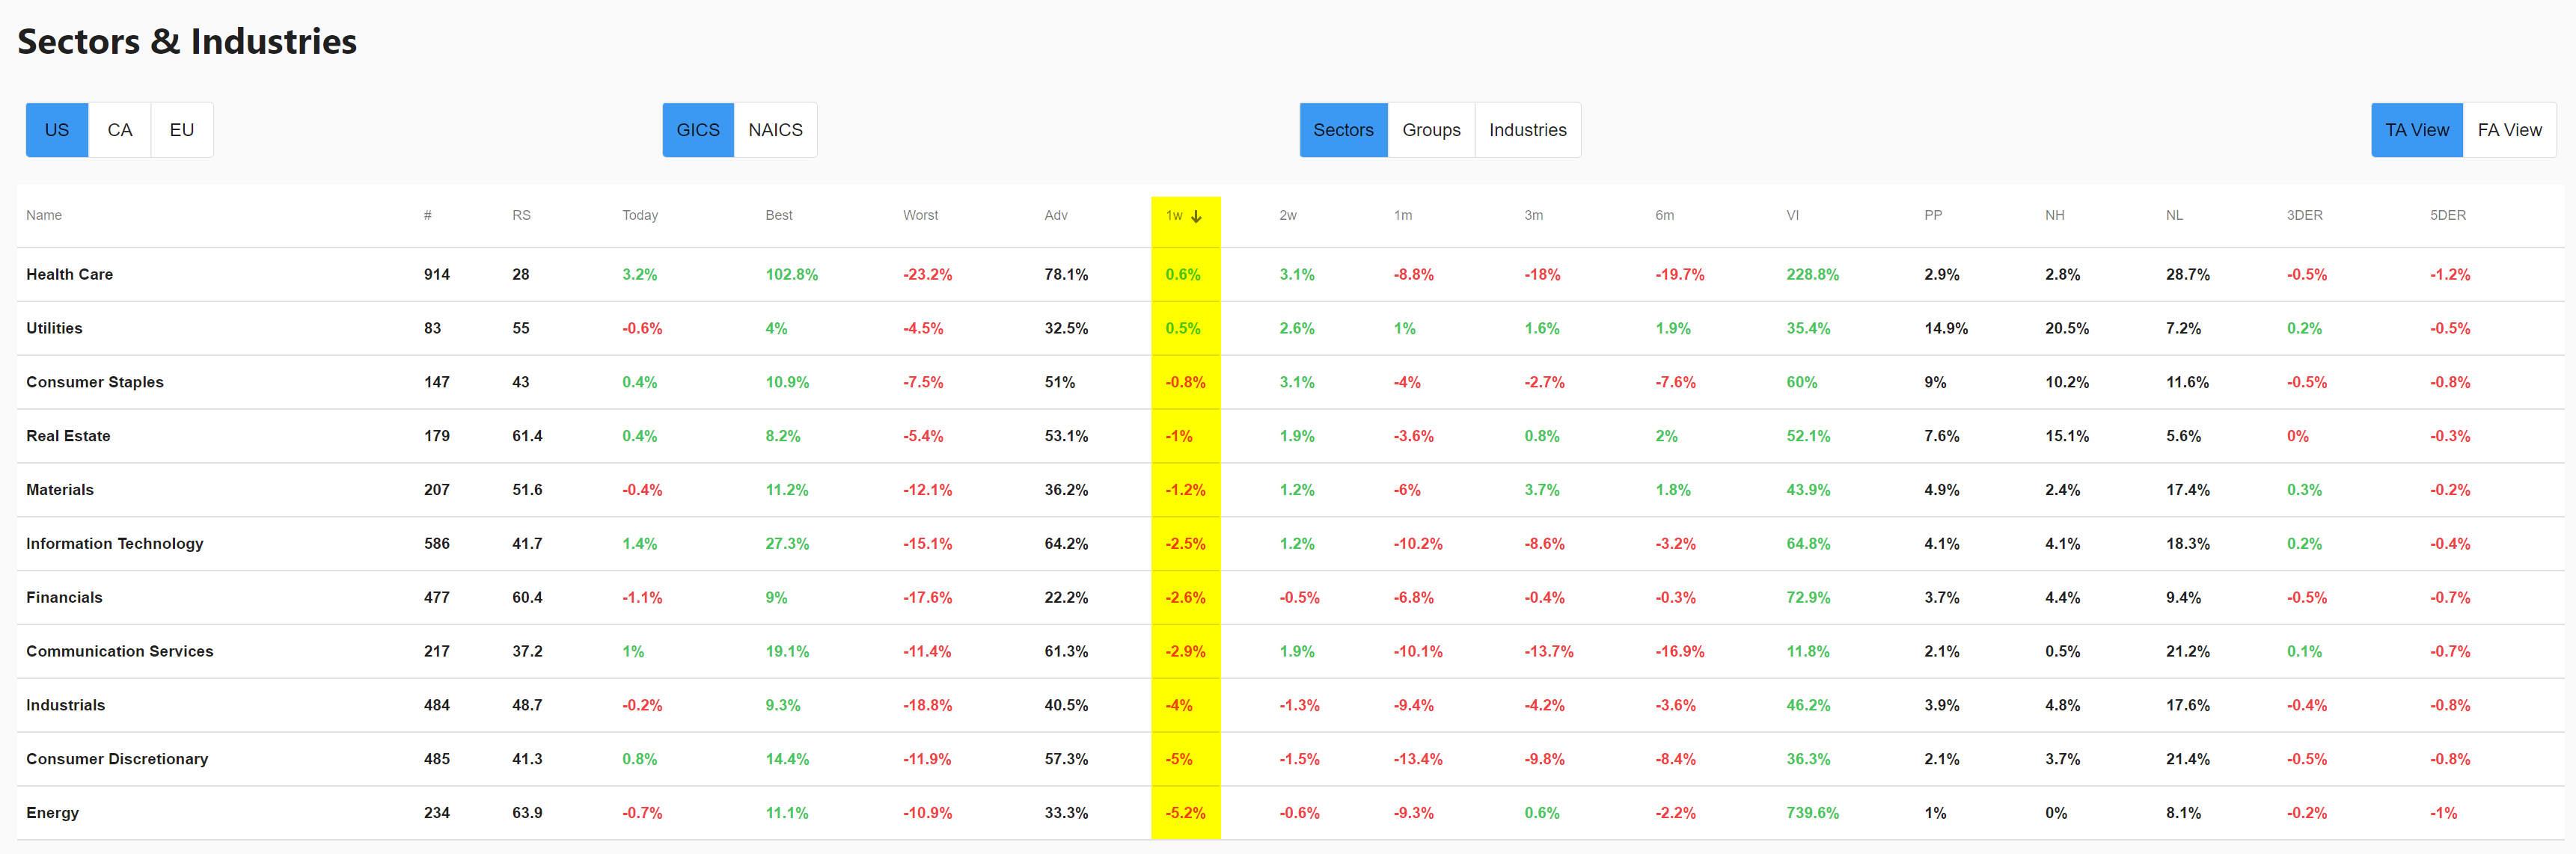
Not surprisingly - if we compare the stock market this week on a sector level - the heaviest losses were recorded by the typical cyclical stocks while the traditionally defensive stocks are on top with even (small) weekly gains for the Healthcare and Utilities sectors.
Add to that the uncertainty that still exists regarding the Omicron variant, of which it may now be assumed that the degree of contagiousness is higher, but where there is still no definitive answer to the seriousness of the symptoms in comparison with the Delta variant. In our previous update end November, we also pointed out that this is a crucial fact and may even determine the direction of the financial markets.
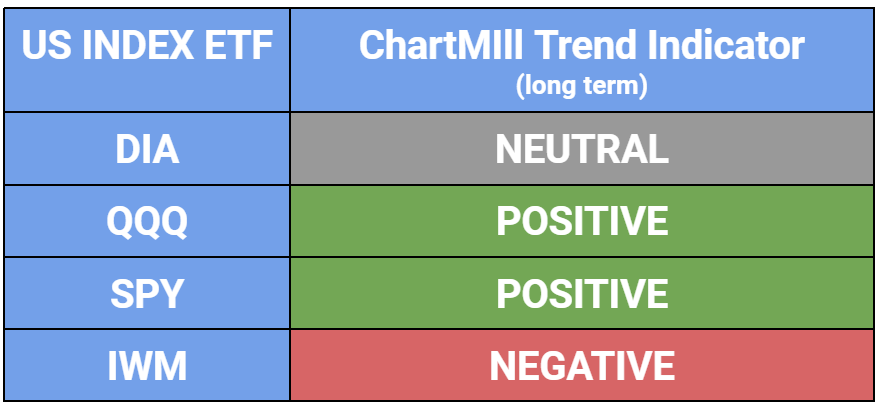
Long-term technical outlook for US index ETFs
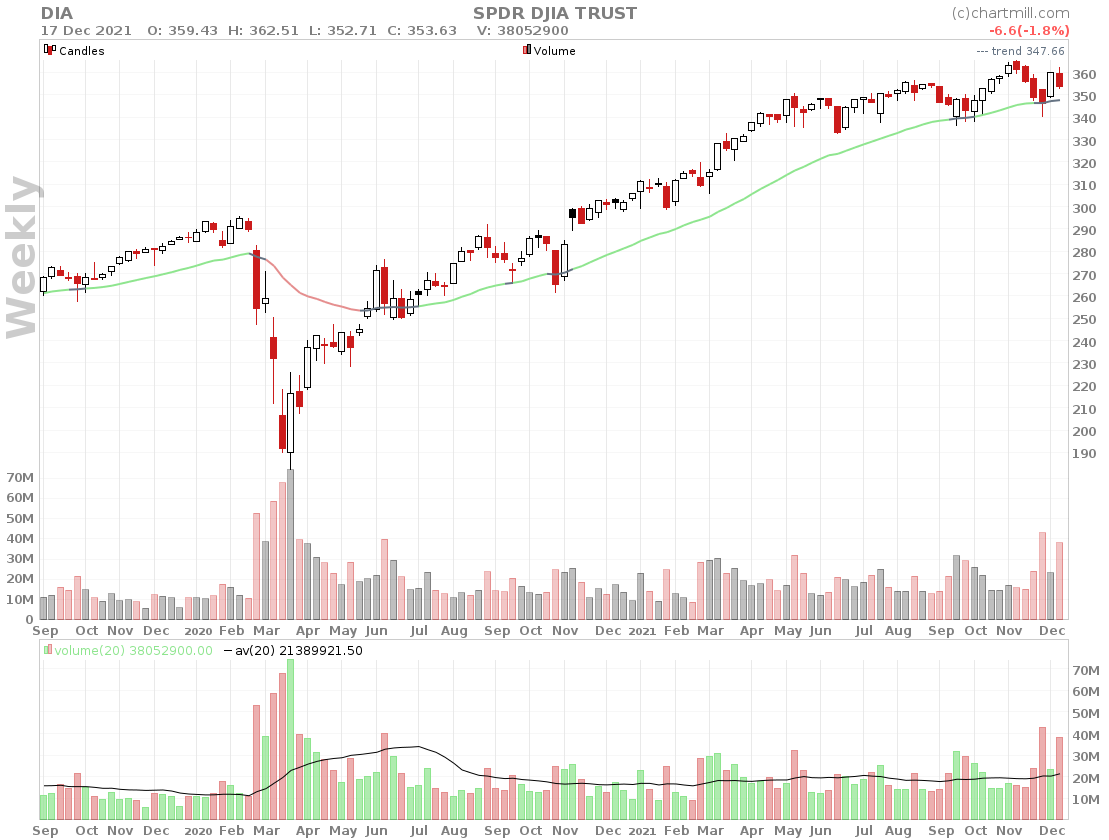
DIA
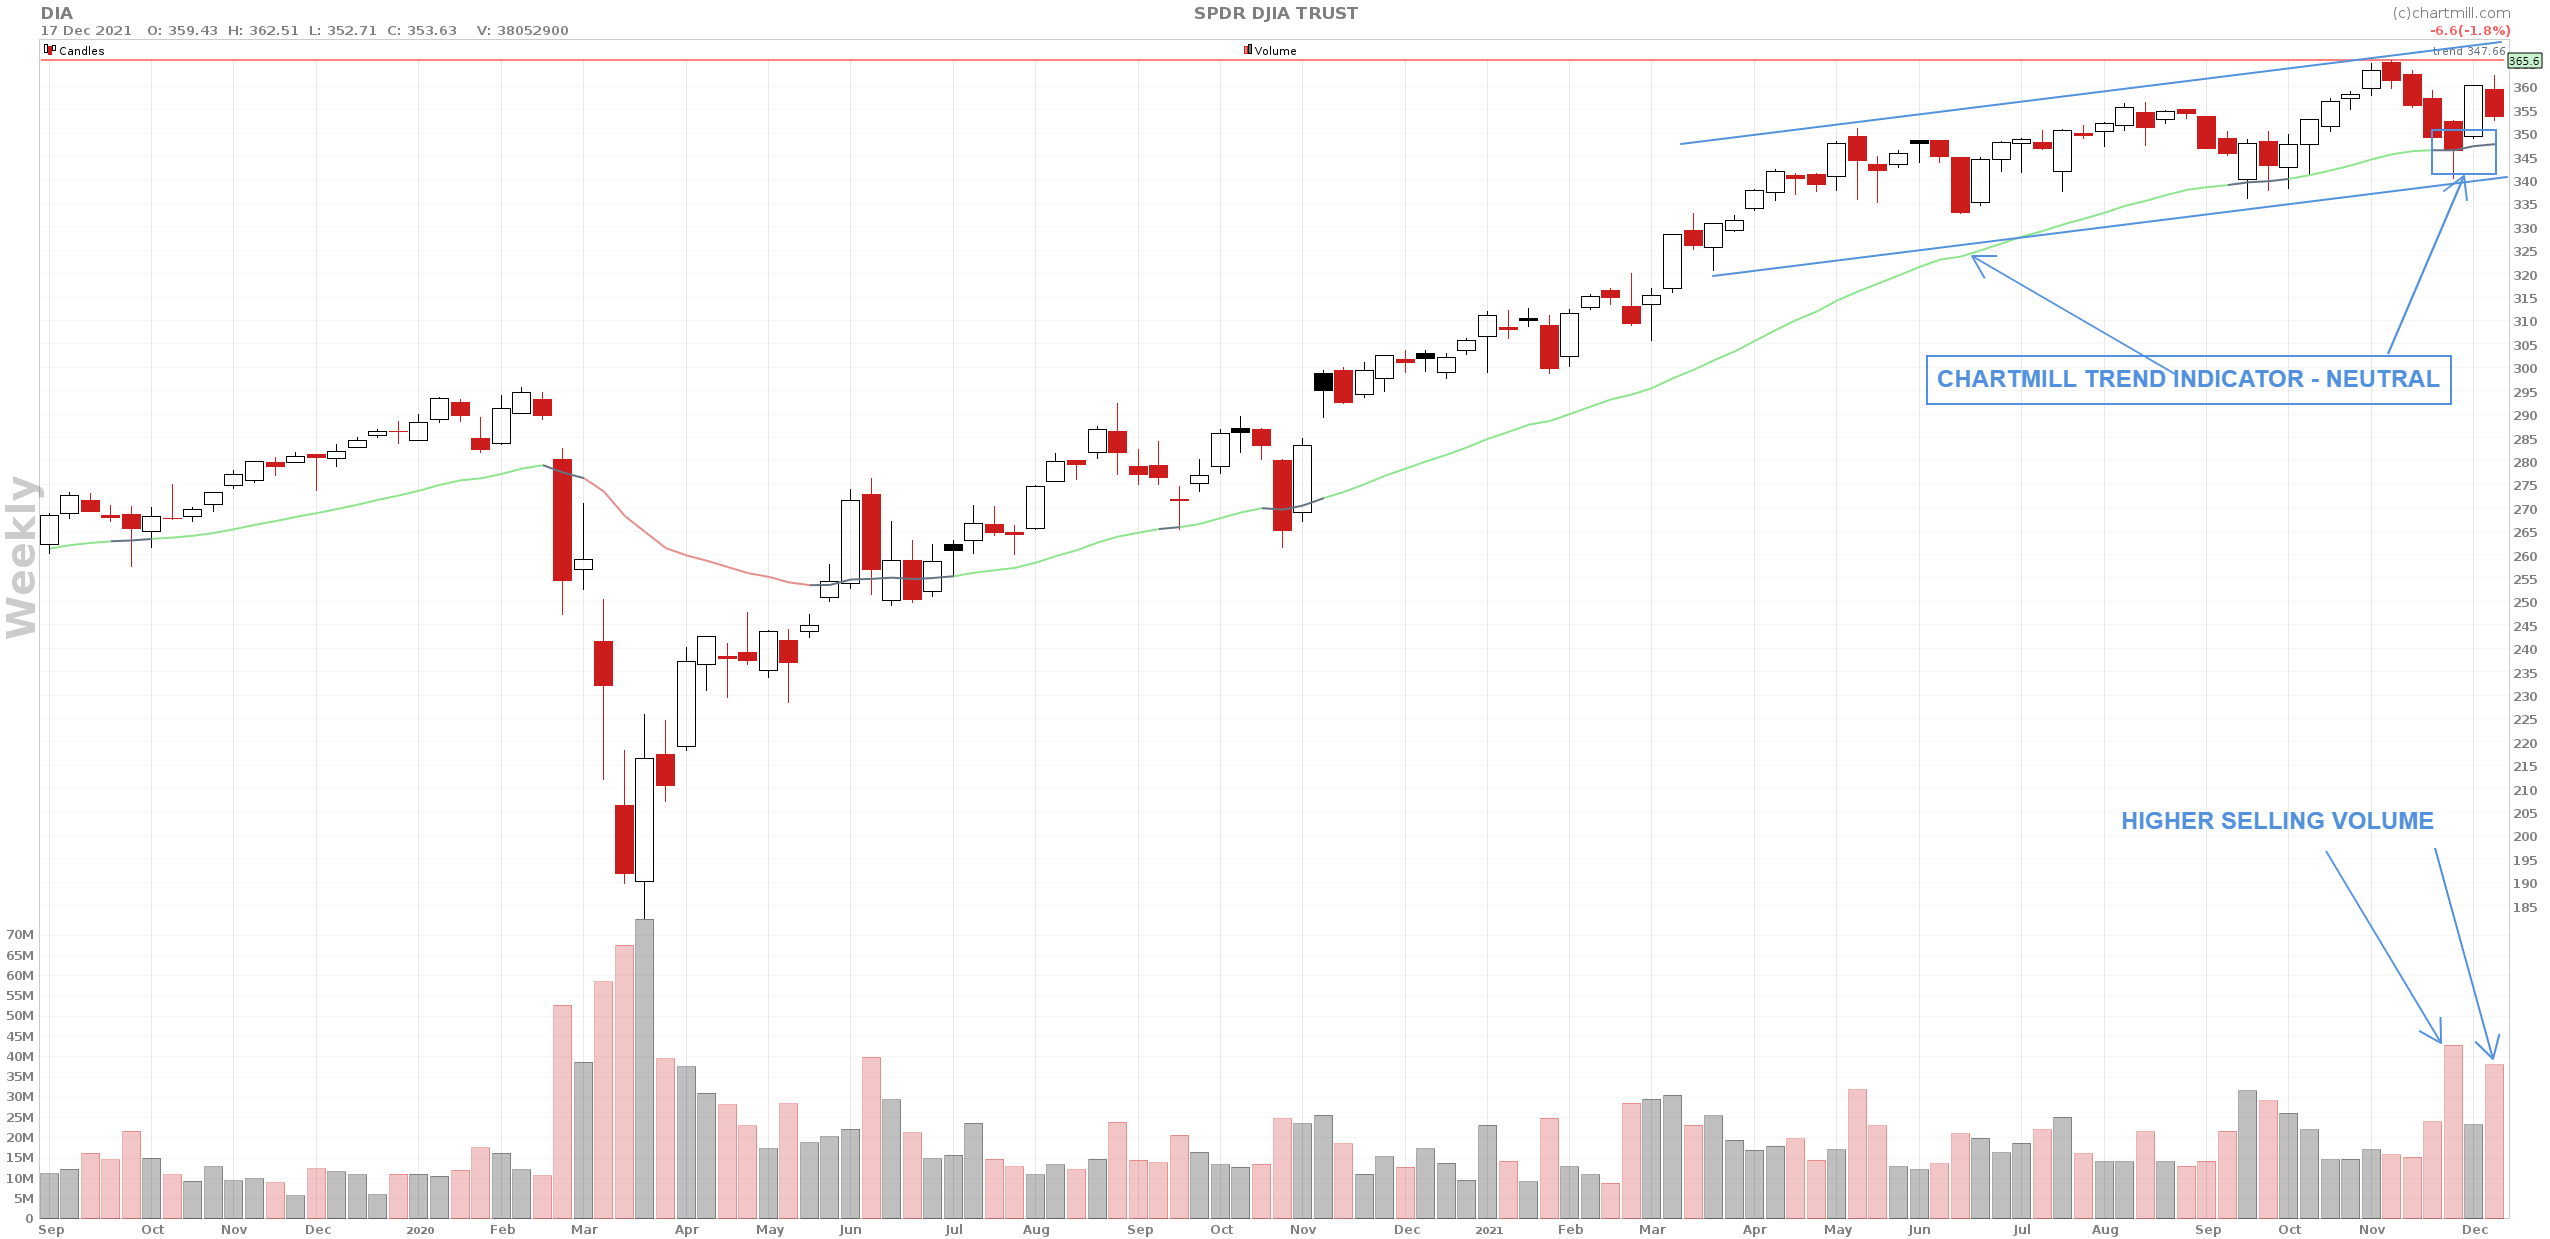
The Dow Jones was able to limit the decline to a weekly loss of -1.8%. Despite this downward movement, the index is still in the middle of its rising trend channel. It should be noted, however, that the long-term picture on the basis of the ChartMill Trend Indicator has fallen from positive to neutral since 05 December. Another striking fact is that the selling volume has been noticeably higher than normal since the beginning of December. See the chart below which is provided with an average volume indicator over the last 20 trading days (black line over volume bars).
QQQ
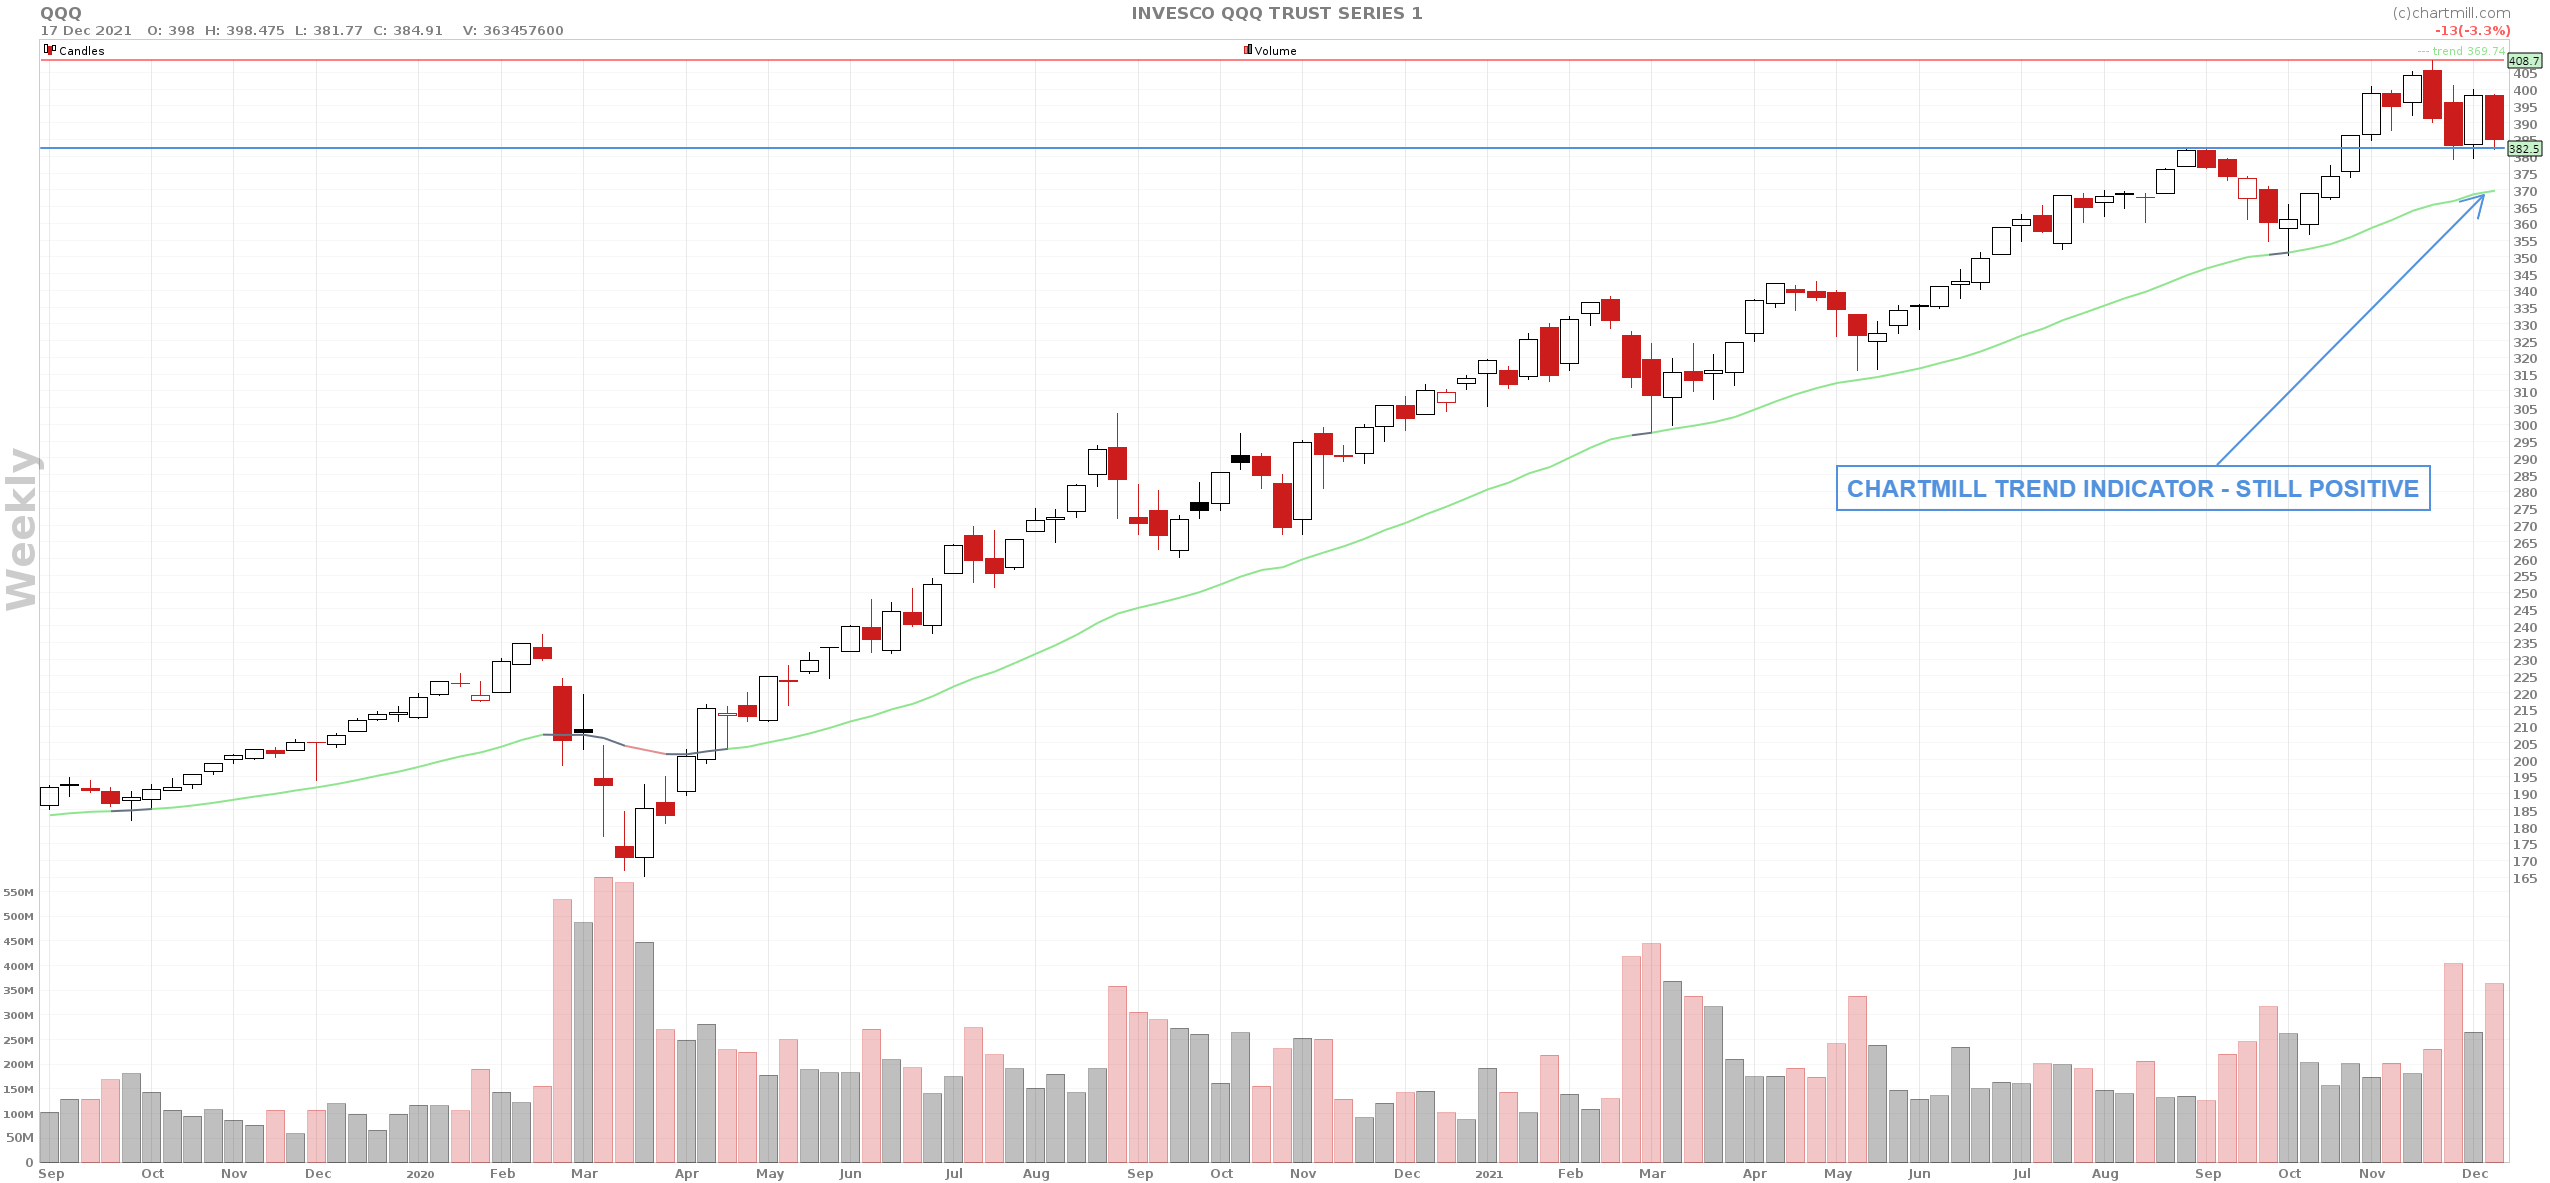
A sharp decline of -3.3% on a weekly basis, After the past trading week, the Nasdaq was barely able to close above the previous breakout level (blue horizontal line). However, the index is still moving within the boundaries of the rising trend channel and, moreover, the long-term trend is still positive. Here too the higher selling volume has been noticeable since the beginning of december.
SPY
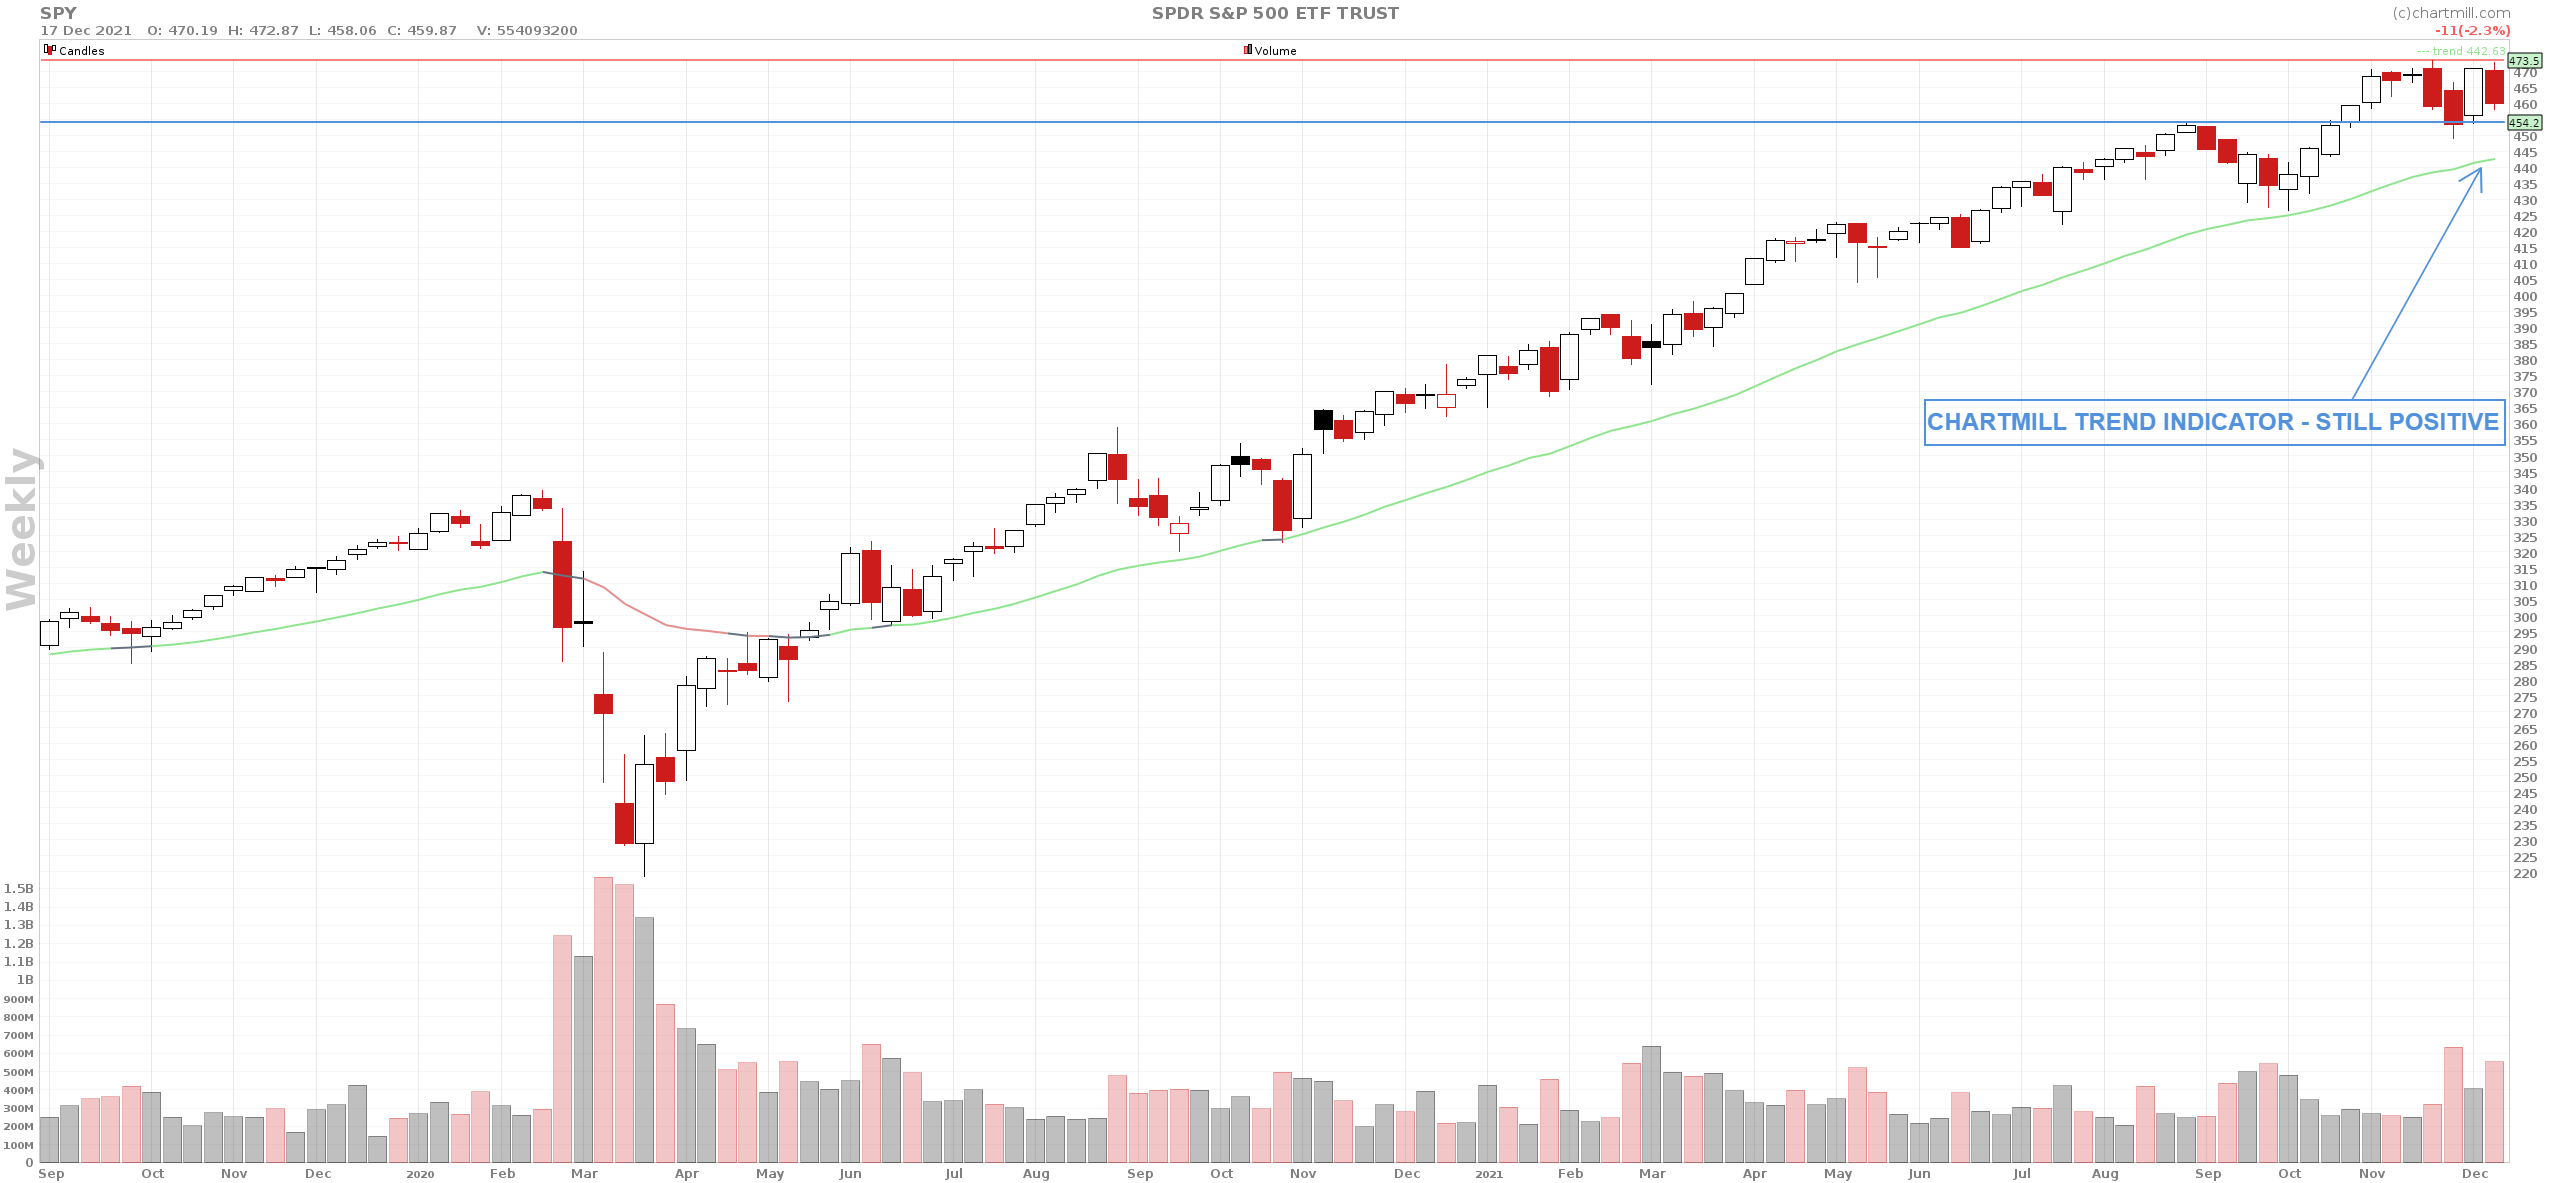
Little different from the QQQ, price-wise the SPY still has a little more room on the downside to the previous breakout level. Here too, the long-term positive trend remains intact.
IWM
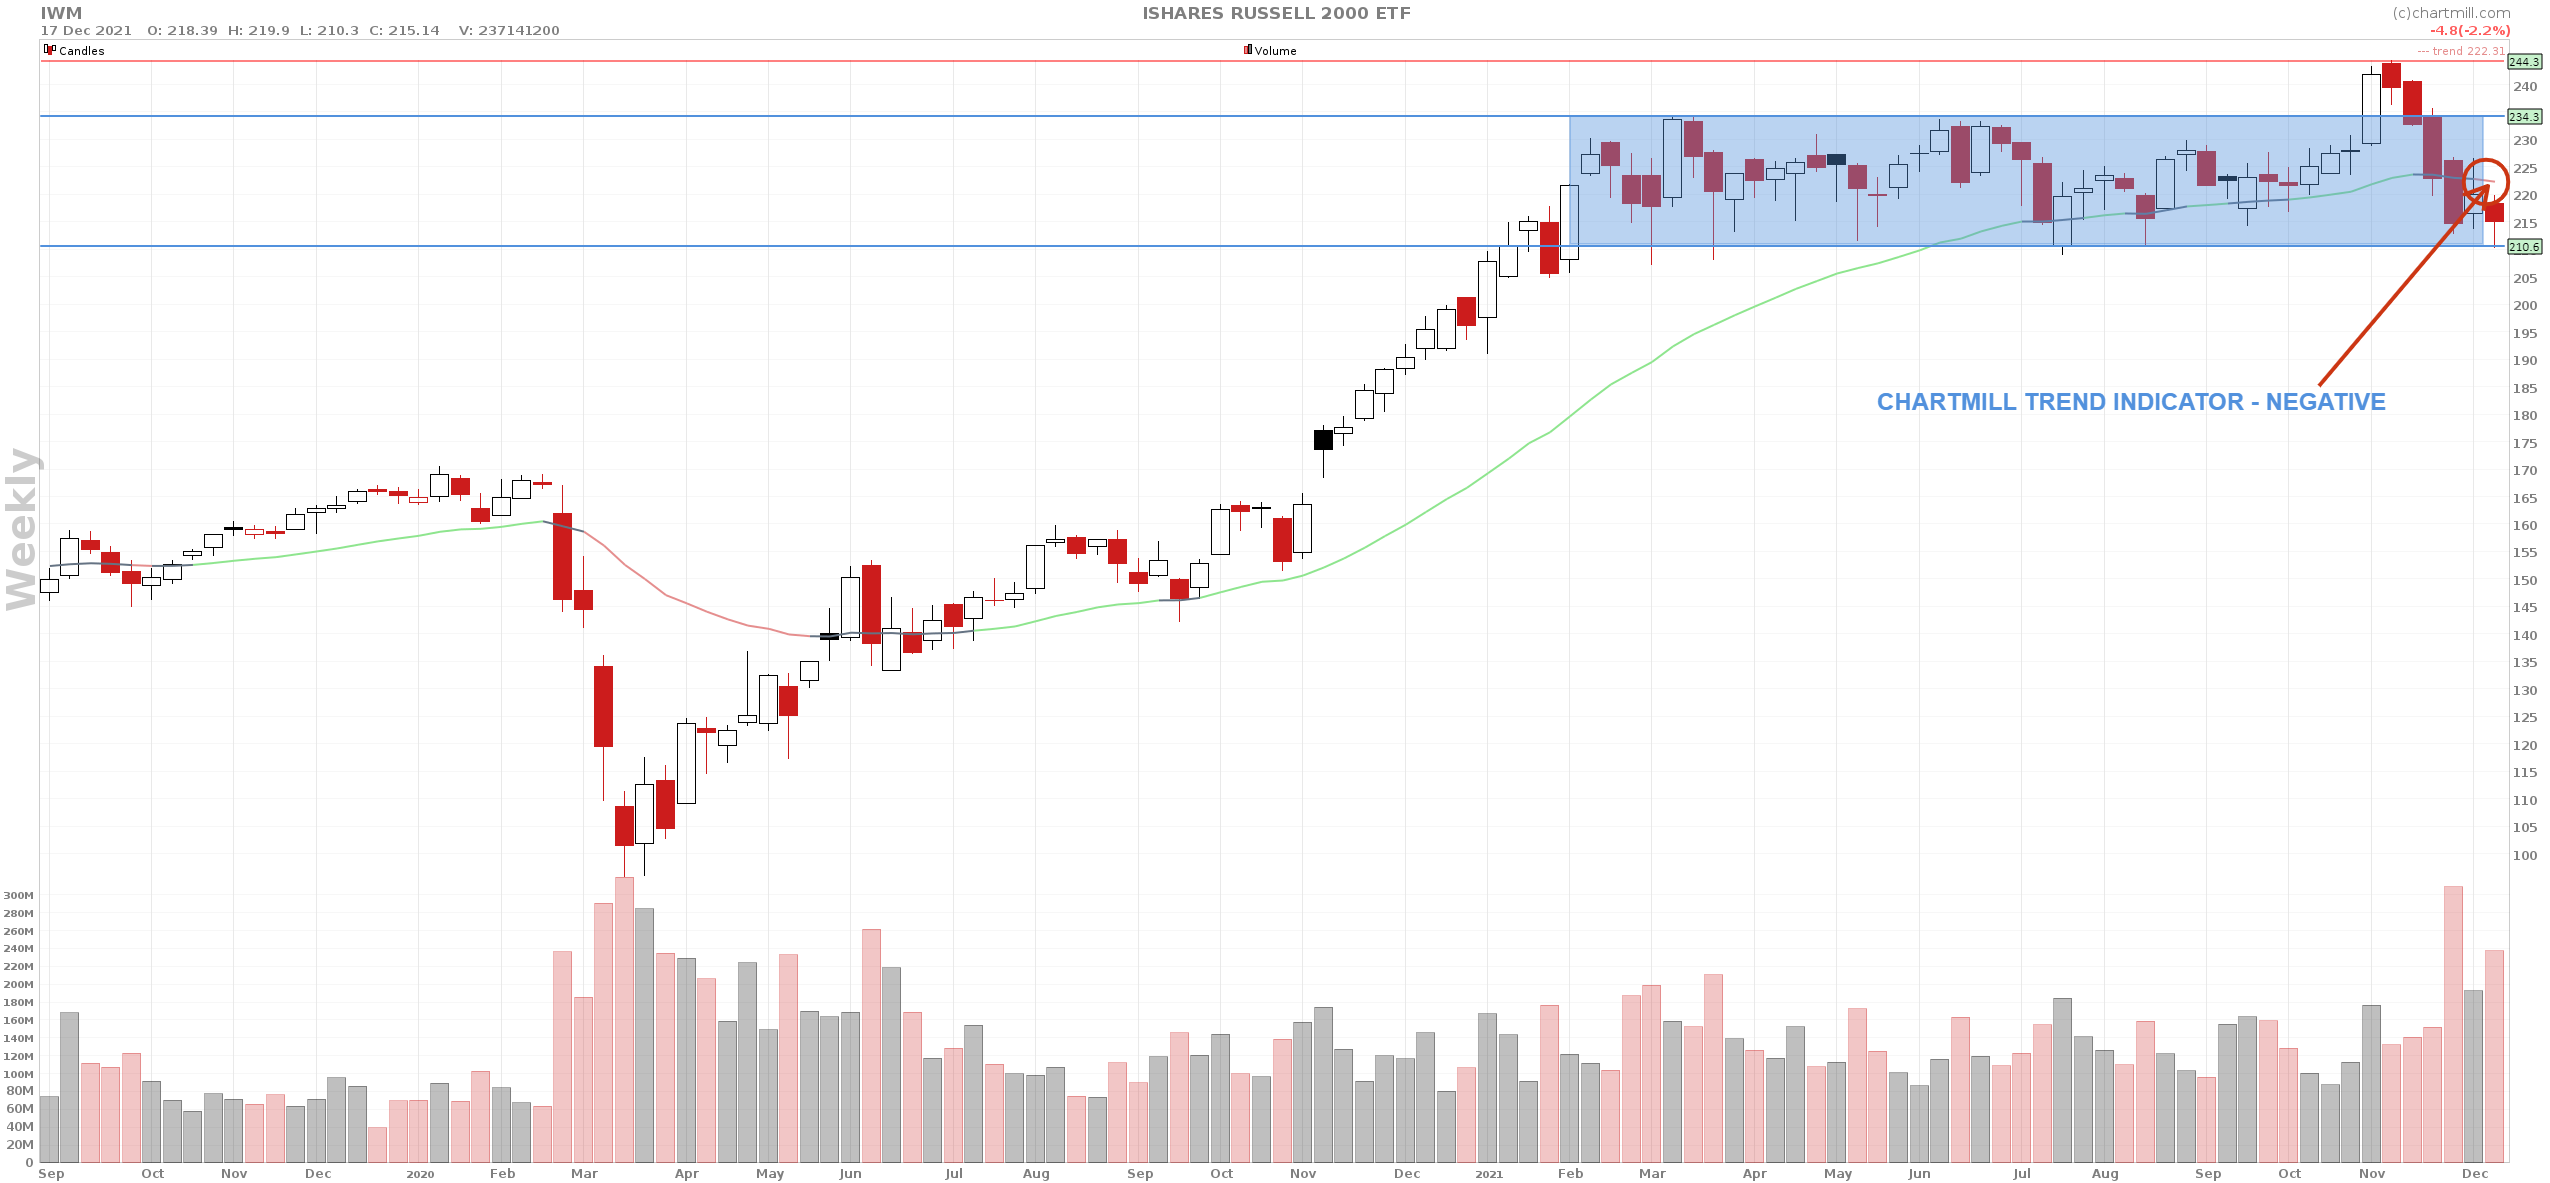
The IWM closed the trading week with a loss of -2.2% and although that is certainly not the worst performance compared to the other US index ETFs one thing stands out. The long-term trend changed from neutral to negative after the last weekly candle.
The last time this happened was March 9, 2020 and it then lasted until May 26, 2020 after which the trend changed again to neutral and finally turned positive on July 20, 2020. The current neutral market period started on November 22 and thus changed to negative since last Friday, December 17. The coming week will be crucial for the Russell 2000 in this respect. A downward continuation movement means a first confirmation of the new negative trend after which the $170 level will come into view for the very first time in a long time.
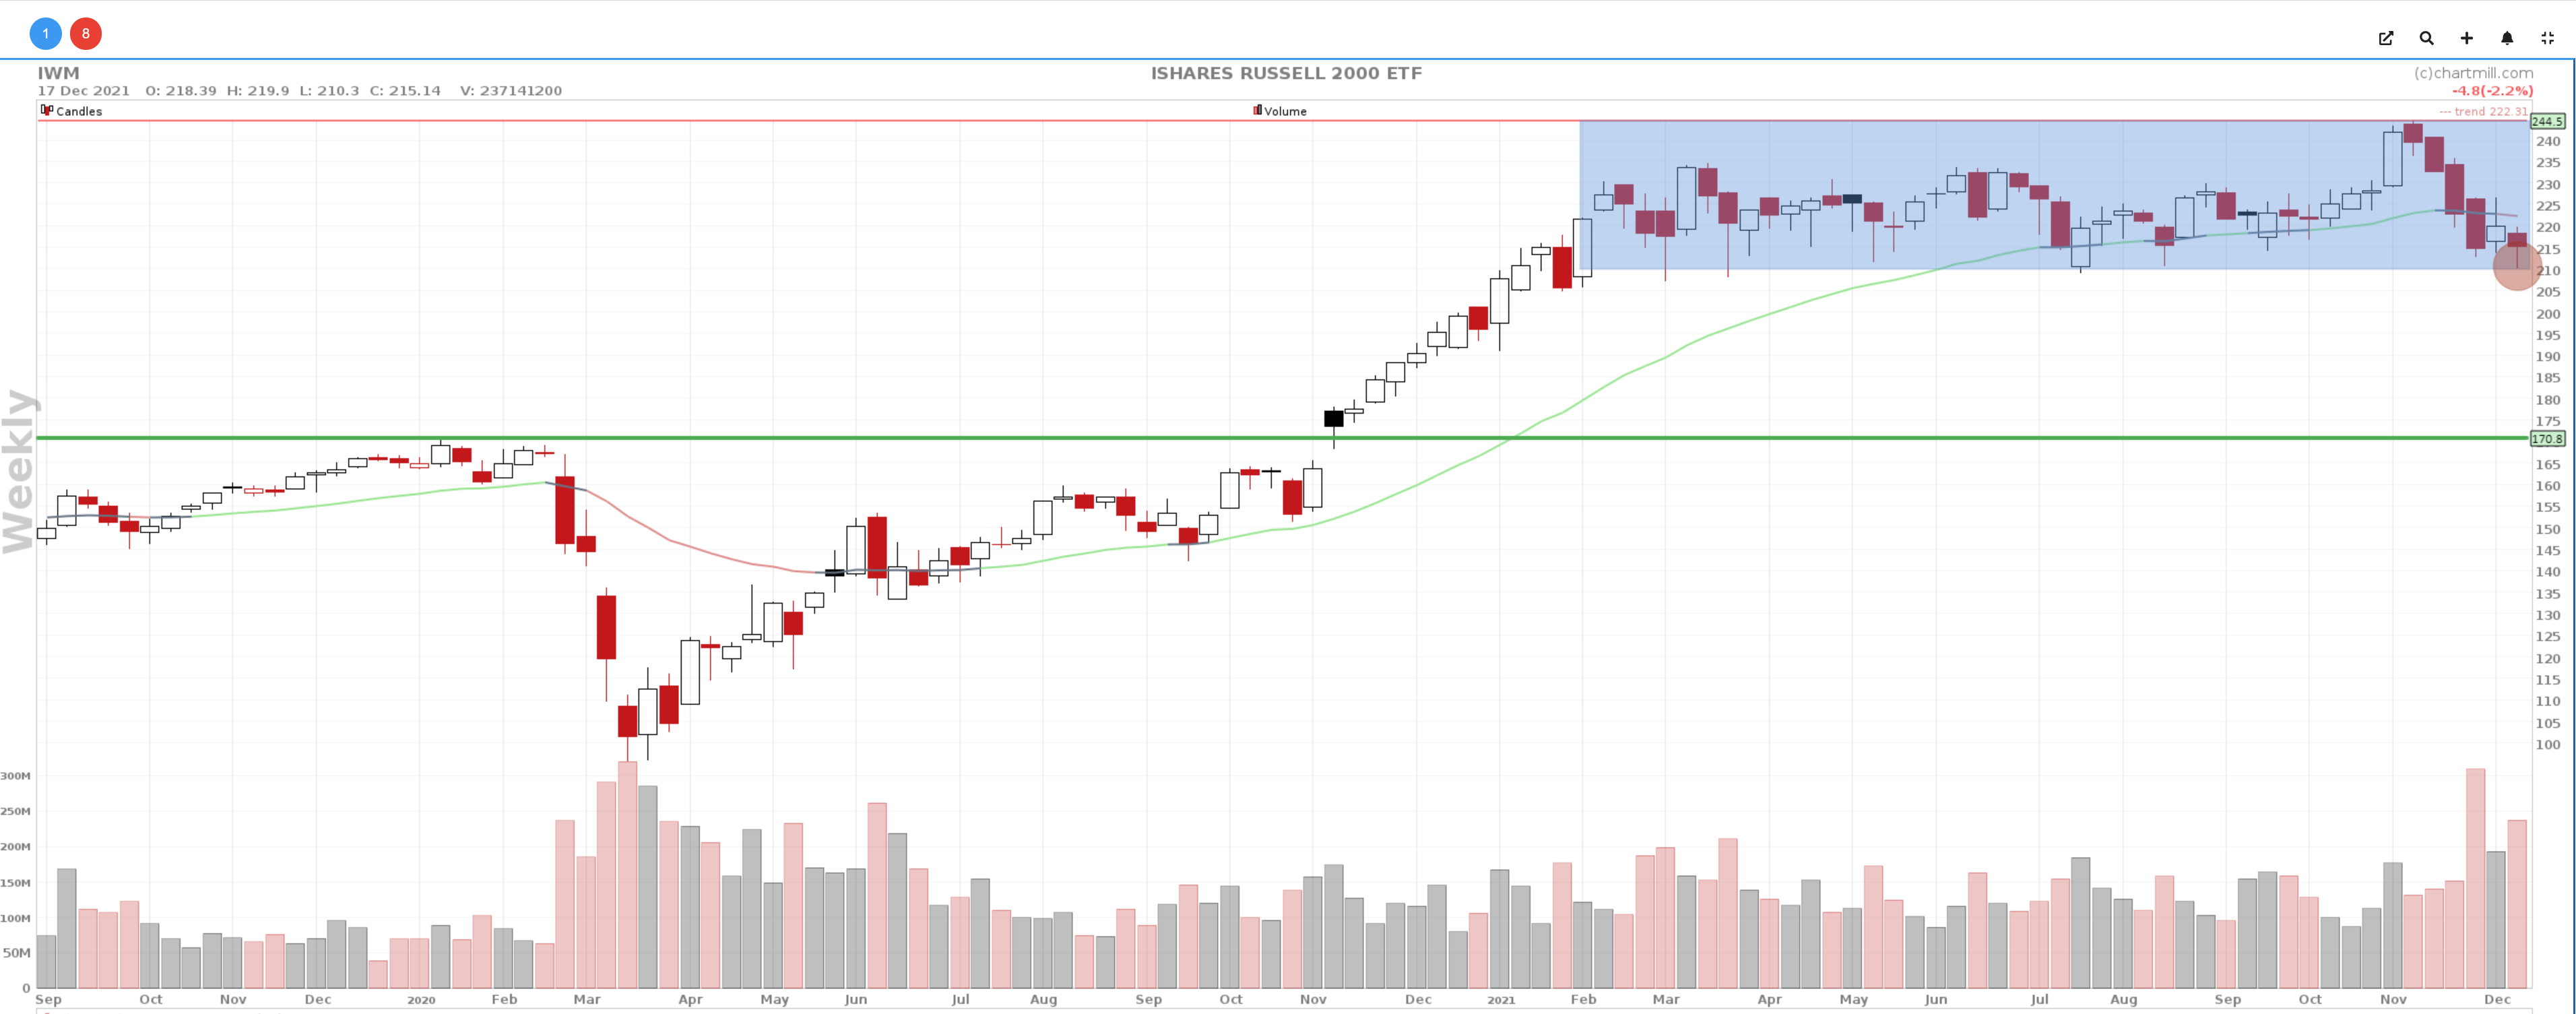
However, we are not there yet... The tide can turn quickly and it would not be the first time that some white rabbit was suddenly pulled out of a hat. The fact that it is currently not the best time to invest in small caps seems rather obvious...
To give some idea, 132 of the 1995 companies in this index showed a new 52-week low last Friday. For the DJIA, that was 1 out of 30 companies while for the SPY, there were only 7 stocks that hit that same new low pricelevel out of over 500 companies. For the Nasdaq, the figure was limited to 2 out of a total of 100 companies.
Summary
The overall long-term technical outlook is no longer positive but needs to be adjusted to neutral+. Vigilance is therefore required, especially if existing support levels are broken, things can get fierce and volatile in the short term. We believe that especially corona-related news will continue to stir the markets in the coming days/weeks. Liquidating positions prematurely is not necessary, but to take new positions in the current stock market climate may seem a bit reckless...
As always, trade safe!
The ChartMill Team
![]()
![]()
![]()
![]()