
We have witnessed a very powerful market rally worldwide over the past few weeks. For the US market, it is the QQQ in particular that stands out. This ETF recently touched the $400 mark for the first time, setting yet another all-time high. For the SPY, DIA and QQQ, this is the fifth consecutive week that the market has closed with positive numbers.

Another noteworthy fact is the substantial catch-up of the IWM ETF (small caps) with a weekly gain of 6%. The ETF managed to overcome the symmetrical triangle pattern that we already drew attention to in our earlier market updates ofSeptember 19 and October 17, 2021.
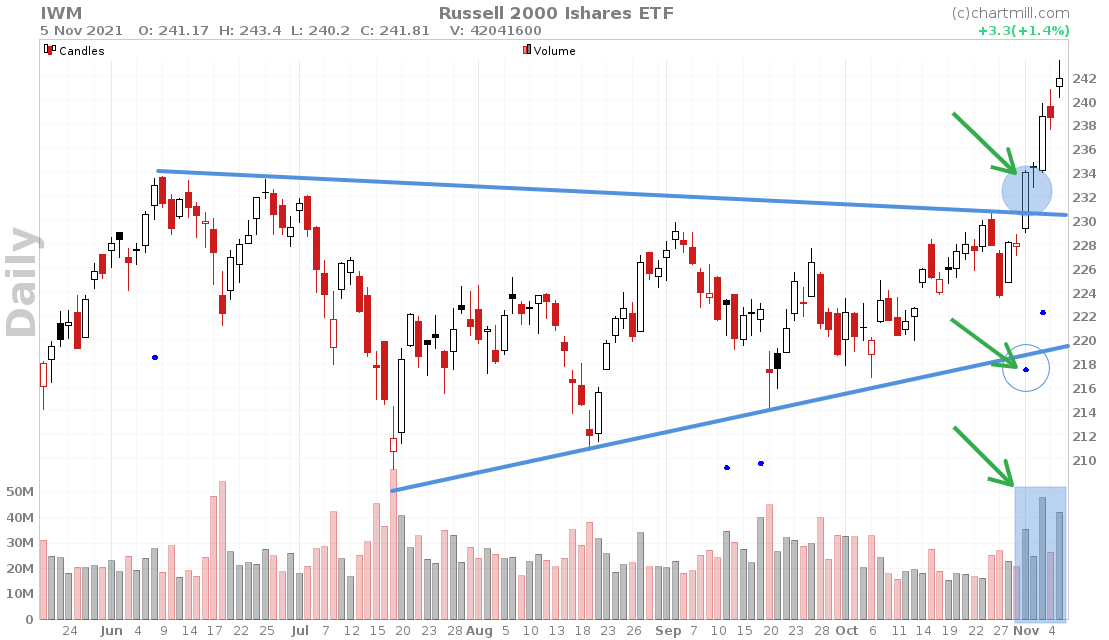
The daily chart above shows the IWM ETF. It is a textbook example of what a good breakout setup should look like. A long white candle with a close near the high of day and some decent volume.
The blue dot below the breakout candle is a pocket pivot signal (described in the book 'Trade Like an O'Neil Disciple' by Dr. Chris Kacher and Gil Morales), it is considered as a price/volume pattern that reveals an interest of large players. More information can be found in this video.
The fact that the current trend is more bullish than ever needs no further explanation. The prices of DIA, SPY and QQQ have been above their SMA20 and SMA50 since mid-October. Where and when a correction will follow is anyone's guess as there are no previous tops available as a reference point. The fear and greed index is firmly in the green with a rating of 85 and an accompanying "extreme greed" quotation. Remember, barely a month ago it was "extreme fear" and thus this indicator once again shows that things can turn in a heartbeat on the stock market.
For the time being, keep in mind that a market that has risen strongly can always continue to rise much more. Resist the temptation to speculate on imminent price corrections. Especially towards the end of the year, where we often have to deal with that typical bullish New Year's rally. Any price corrections at the moment are rather nice opportunities to surf along with the bullish trend. In this regard, keep an eye on the former resistance zones. Resistance which turns into support and vice versa is one of the basic principles in technical analysis and price action strategies. This applies as much to indices as to individual shares.
Some recent swing trading ideas from our screener
The bullish market conditions have caused ChartMill to provide us with some very nice swing trading candidates, using the breakout screen filter. All of these setups are visible on our Instagram page where they are posted as trading ideas before the opening of the market. I'll go over a few of them to conclude this market update.
The first one we'll take a closer look at is the S&P Smallcap Value ETF SPDR (ticker: SLYV). This trading idea was posted on our Instagram account on date of November 02 before the market opened. The selected ETF was one of the results that came out of this screen filter on November 2.
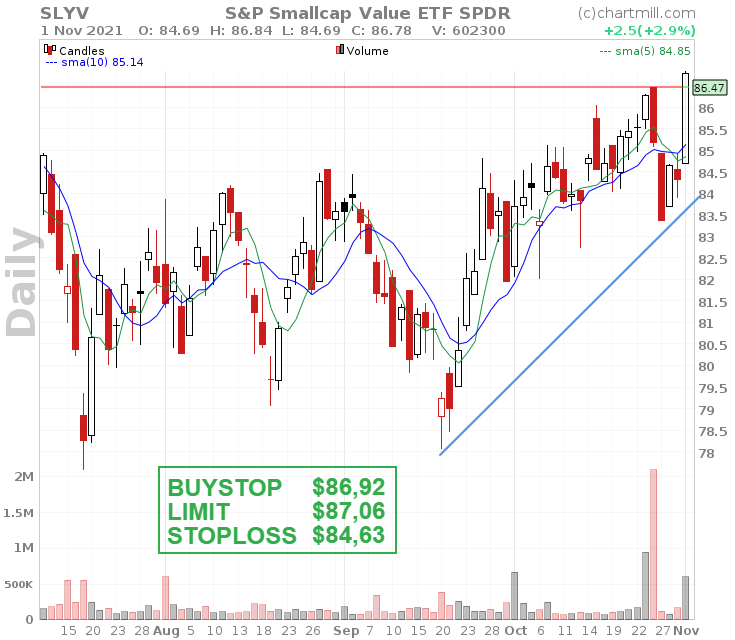
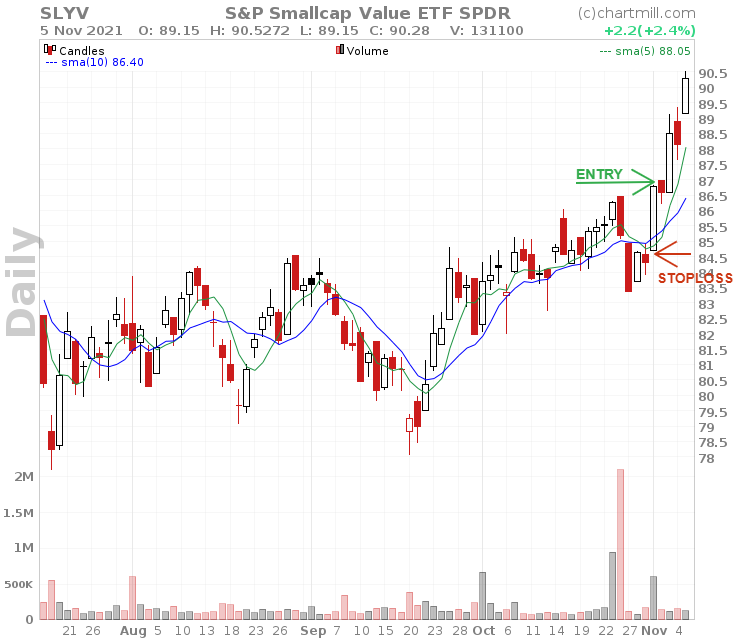
A long white candle breaking through the current existing resistance. Volume was more than double compared to the previous trading day. The buy stop at $86.92 was slightly above the high of the breakout candle ($86.84). Below is the chart from last Friday, November 05, 2021.
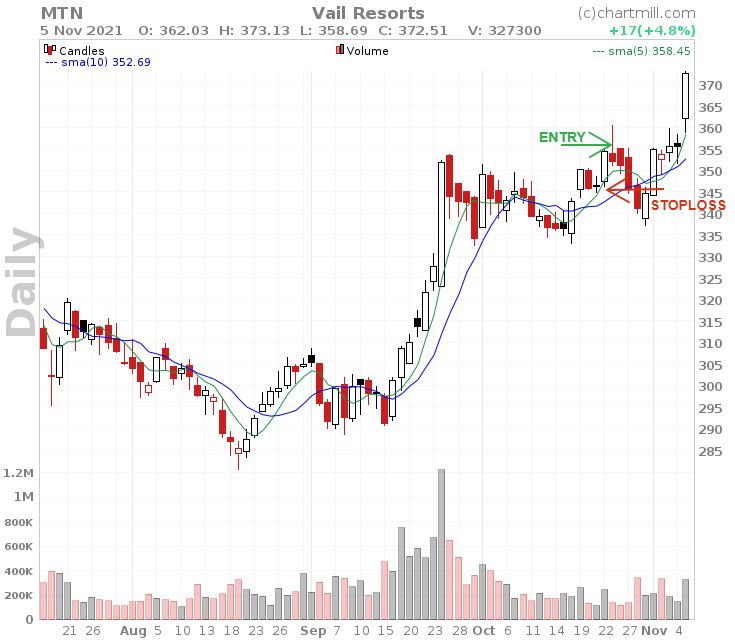
MTN was another breakout setup idea of October 22, 2021 and part of this screen filter on date of October 22, 2021. The close ended just above the existing trading range, so the breakout had been valid. The stoploss at $345.88 was quite aggressive just below the breakout candle.
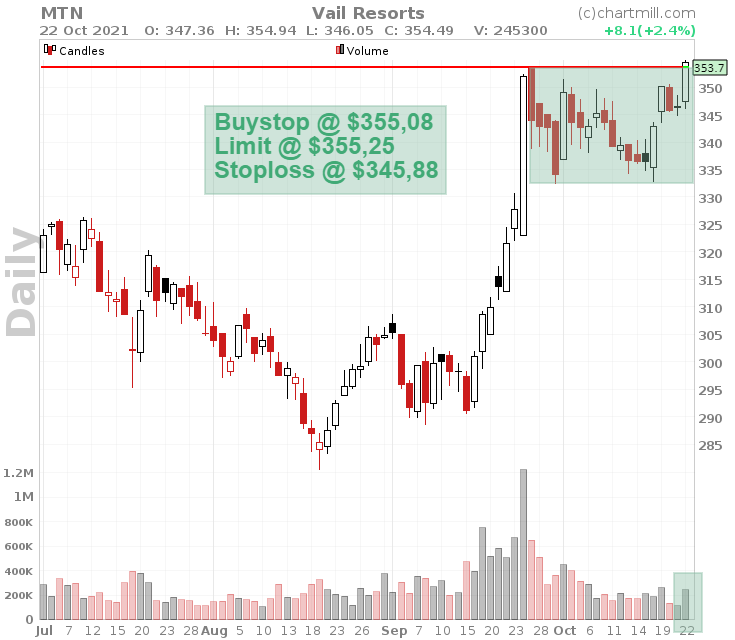
The day after this breakout candle the entry level was triggered. Initially things looked promising but by the end of the trading day all gains had evaporated and a doji candle appeared. Another two days later the stoploss was reached. In the meantime the price has been moving higher with a new breakout last Friday and an increase of 4.8%. It's always a bummer when the price picks up after the stoploss is triggered, but that's JUST the way it is...
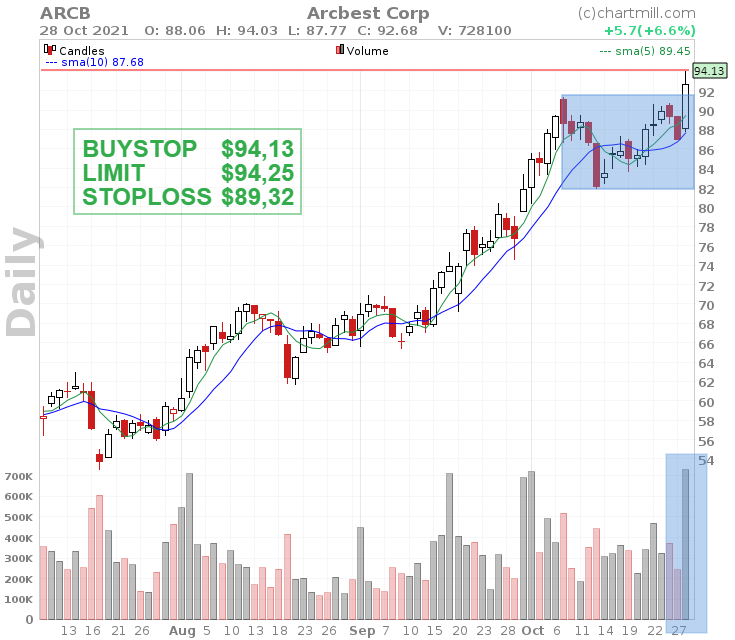
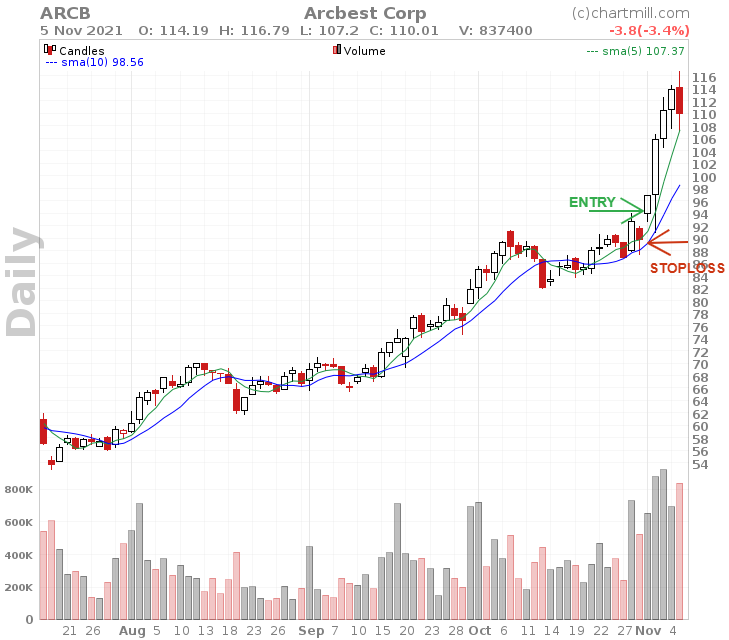
We end on a positive note with Arcbest Corp, a breakout setup which was published on October 28, 2021 (link to the screen filter used to find and select ARCB). The breakout occurred - as in the past - with strongly increased volume. The stoploss was placed just below the SMA5 level (green rising line).
Meanwhile, the stock has continued to rise nicely. Last Friday however, the stock did fall by 3.4%, I am now especially keeping an eye on the 5SMA where the stock found support on Friday.
Bear in mind that with over 21,000 shares in our database, it is simply impossible to just manually find each and every one of these setups. That is precisely where the added value of a good stockscreener like ChartMill resides. In the current market conditions, ChartMill was able to provide us with a few very decent breakout setups every day. In this article you can find some more insights on the filters used to arrive at these candidates.
Obviously selection is only one part of a trading strategy. That's why I will explain the entire workflow in one of the following videos where screening, selection, analysis and follow-up of open positions will be dealt with.
Last but not least... This screen filter is available to all users (free and paying members). Free users can see all the results of the screen as long as they have credits (every registered free user gets 6000 free credits every month). If you want to use ChartMill unlimited and ad-free, check out our monthly or annual subscription plans.
Trade safe!
The ChartMill Team
![]()
![]()
![]()
![]()