

Tuesday’s first session after the long weekend brought a broad risk-off move: SPY and QQQ broke back below their short-term trend gauges, and the breadth dashboard deteriorated sharply versus Friday. The longer-term uptrend is still intact, but the short-term internal damage is now hard to ignore.
Index overview (SPY, QQQ, IWM)
Short Term (Daily)
Long Term (Weekly)

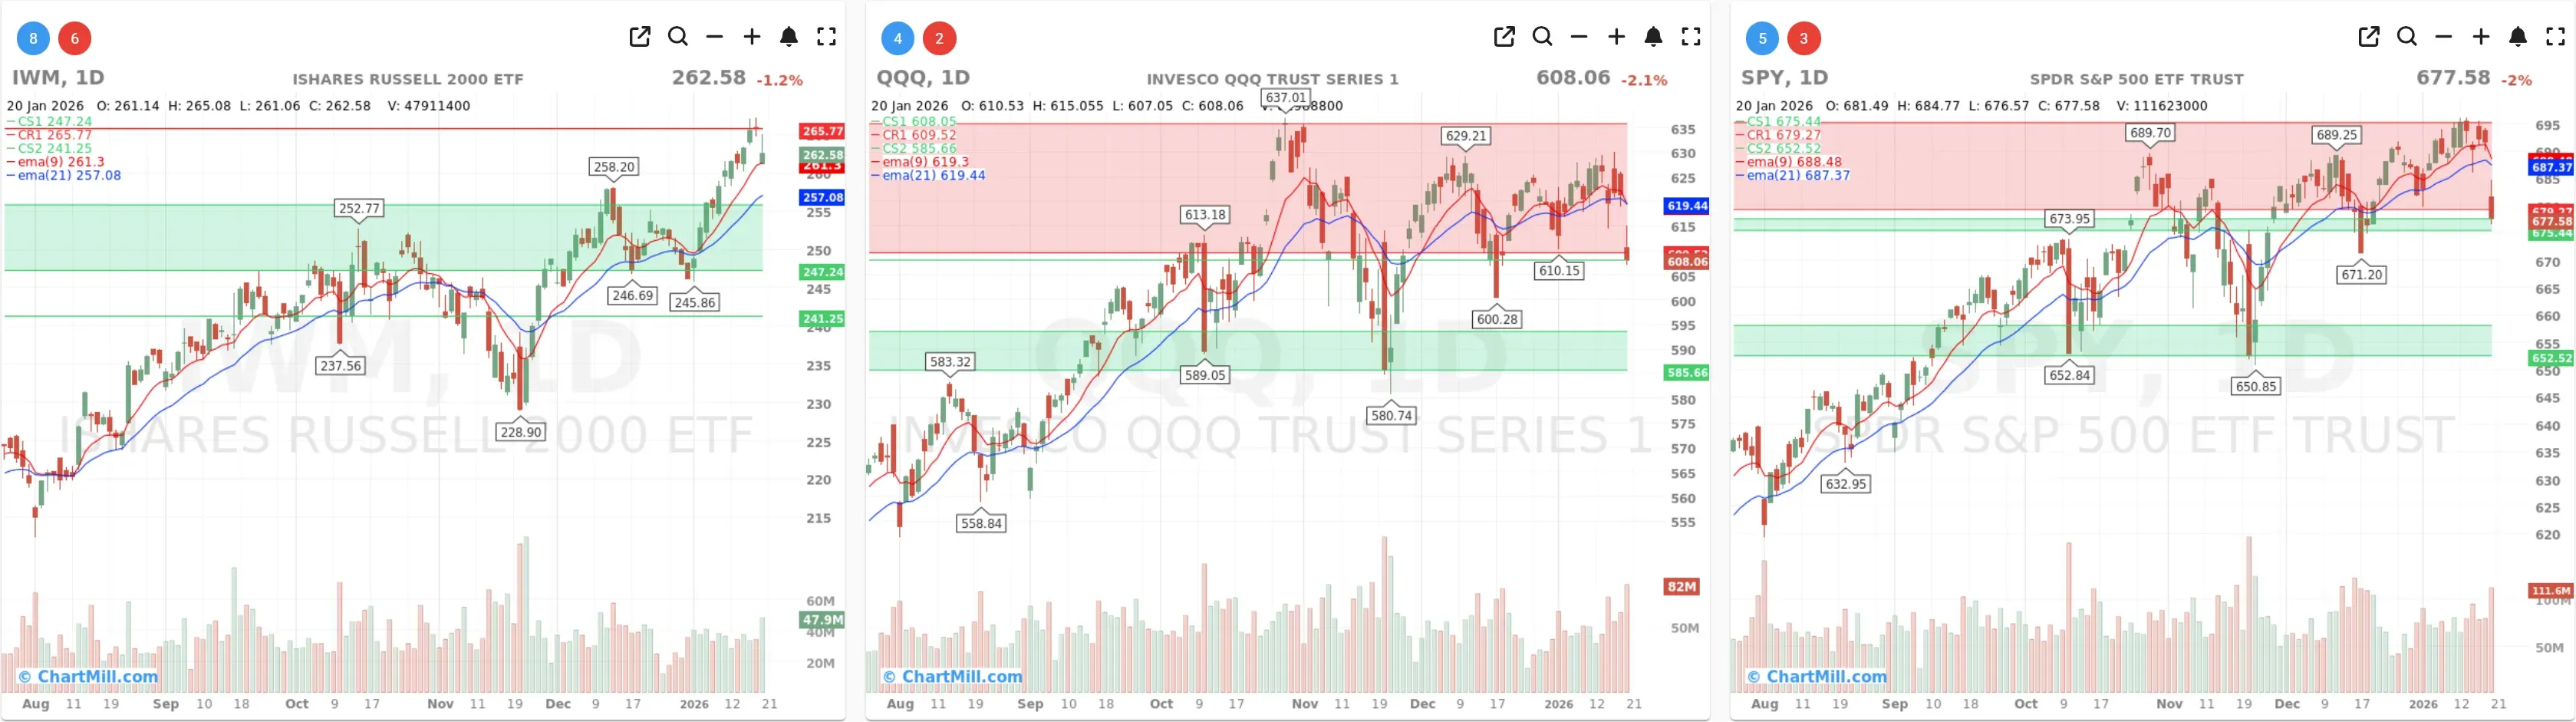
SPY
SPY dropped about -2% and, importantly, lost both EMA9 and EMA21 on the daily chart. That’s a clean “trend check” fail for the short-term tape: momentum shifted from “buy-the-dip” to “sell-the-rip until proven otherwise.”
On the weekly chart, SPY still sits in an uptrend (30-week trend remains supportive), but this week’s pullback is a reminder that the market was stretched near the highs and vulnerable to a volatility reset. The near-term focus is whether SPY can quickly reclaim the EMA zone; if not, support levels from the recent consolidation become the next battleground.
QQQ
QQQ was weakest, down roughly -2.1%, and it also broke below EMA9/EMA21 on the daily. The drop pushed price into/near a clearly defined support area on the chart.
Weekly trend remains positive, but QQQ is now behaving like a market that’s transitioning from “trend continuation” into “range with downside probes.” If buyers don’t defend this area promptly, the next move often becomes a deeper mean-reversion toward lower weekly support zones.
IWM
IWM fell about -1.2%, but relative to SPY/QQQ it held up better. On the daily, it’s still above its rising EMA21 and closer to a “controlled pullback” than a breakdown.
On the weekly chart, IWM continues to look constructive in the bigger picture. If there’s a silver lining today, it’s that small-caps are not the epicenter of the selling—at least not yet.
Takeaway: After the holiday, large-caps—especially tech—took the hit, while small-caps remained comparatively resilient. That’s a meaningful “leadership tell” to monitor over the next few sessions.
Breadth dashboard: the internal picture worsened fast
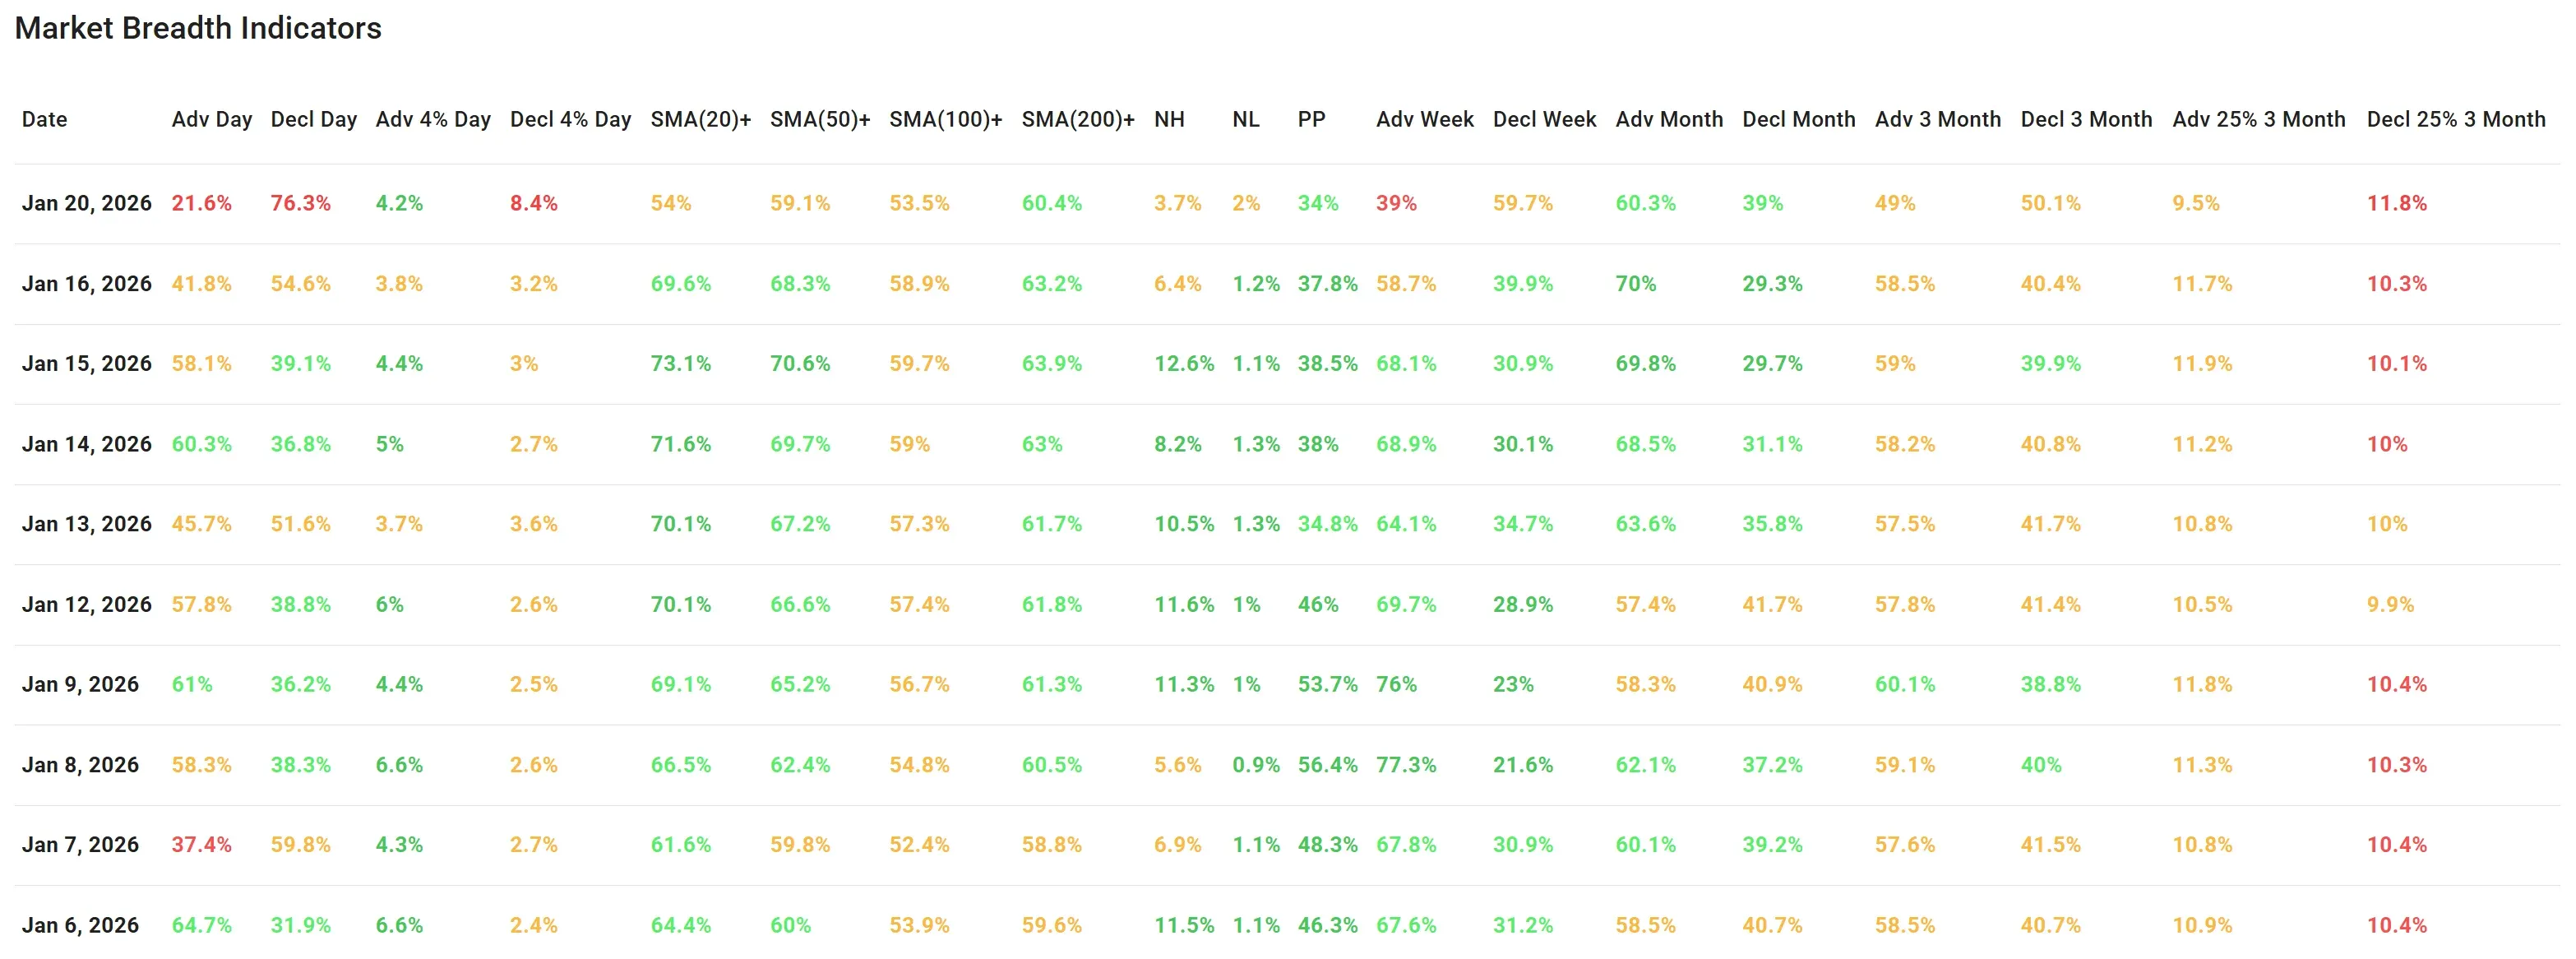
The breadth table for Jan 20 shows a decisive shift toward distribution:
-
Advancers vs decliners: only 21.6% advanced vs 76.3% declined — a one-day breadth shock, and notably worse than Friday’s already-soft 41.8% / 54.6%.
-
Big movers (±4%): 8.4% of stocks fell >4%, versus 4.2% rising >4%. That’s a classic “risk-off expansion” day (more downside volatility than upside opportunity).
Participation (stocks above moving averages) collapsed:
-
SMA(20)+: 54% (down hard from 69.6% Friday)
-
SMA(50)+: 59.1% (from 68.3%)
-
SMA(100)+: 53.5% (from 58.9%)
-
SMA(200)+: 60.4% (from 63.2%)
That SMA20+ drop is the key message: short-term participation got hit immediately, which aligns perfectly with SPY/QQQ losing their EMA bands.
What changed versus the previous breadth read (Jan 16)?
Friday already hinted at cooling—decliners were still ahead and the “big up day” count was muted. But Tuesday’s session was different in character:
-
The market didn’t just drift lower? it broadened lower.
-
New highs fell (3.7% from 6.4%) and new lows rose (2% from 1.2%). Not extreme, but directionally the wrong way.
-
Short-term trend pressure increased: PP slipped to 34% (from 37.8%), confirming fewer stocks are in strong technical shape.
Weekly breadth flipped negative: 39% advancing week vs 59.7% declining week. That’s a big swing from Friday’s 58.7% / 39.9% and it reinforces that today wasn’t “noise”—it changed the weekly tone.
Longer horizons are less damaged but weakening:
-
Monthly: still positive (60.3% adv month / 39% decl month) but notably less robust than Friday (70% / 29.3%).
-
3-month: now basically a coin flip (49% adv / 50.1% decl), down from Friday’s clearly positive skew (58.5% / 40.4%).
Large movers over 3 months (±25%): losers now edge winners (11.8% decl vs 9.5% adv), a subtle but important sign that downside tails are growing.
Interpreting the move: price confirmed what breadth was warning about
Because Monday was closed (MLK Day), this was the market’s first chance to reprice after a pause and it did so aggressively. I don’t need a single headline to explain today’s internal footprint: this was systematic de-risking, not a narrow sector wobble.
The charts and breadth agree:
-
SPY/QQQ broke short-term trend, and
-
breadth participation snapped lower, especially at the 20-day level.
My breadth trend rating (1–7)
3 — neutral-negative bias.
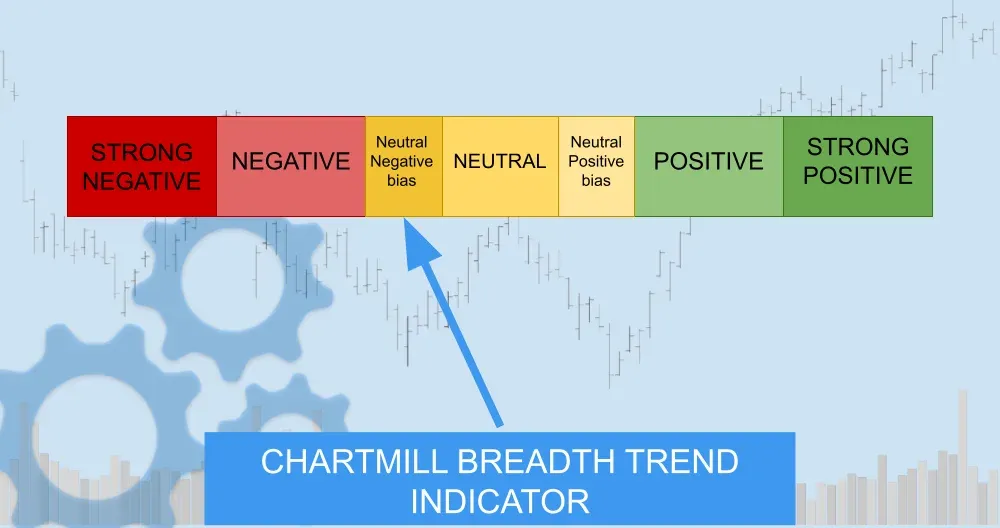
The long-term structure is still constructive (SMA200+ above 60% and weekly trends still positive on the major ETFs), but the short-term deterioration is sharp enough that I treat the tape as “risk management first” until we see stabilization (reclaiming EMAs, improved advance/decline, fewer >4% decliners).
What I’m watching next
If this is a normal pullback within an uptrend, I want to see: improving adv/decl, shrinking 4% decliners, and SPY/QQQ reclaiming their EMA zone quickly.
If those don’t show up, the odds rise that this becomes a deeper digestion phase where rallies get sold and leadership narrows further.
Kristoff
Next to read: Frozen Tundra and Hot Cash: Trump’s Greenland Gambit Meets Netflix’s $83 Billion Bet