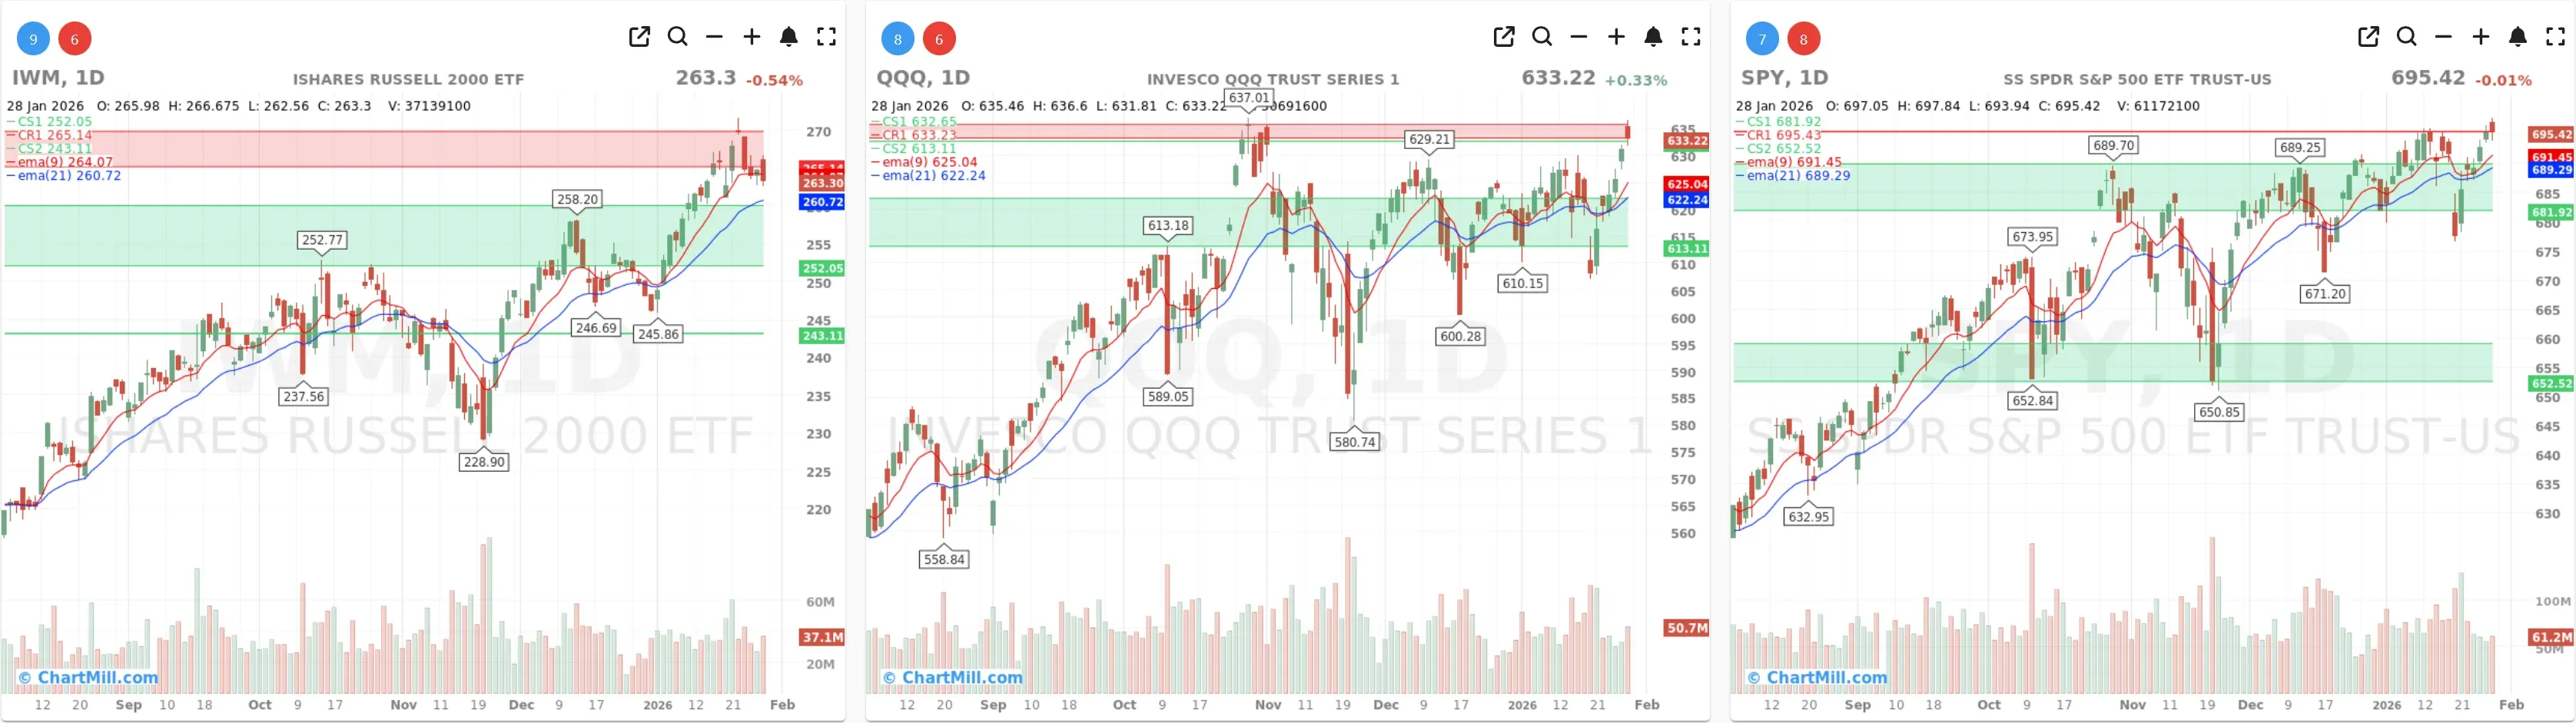
Index overview (SPY, QQQ, IWM)
Short Term (Daily)
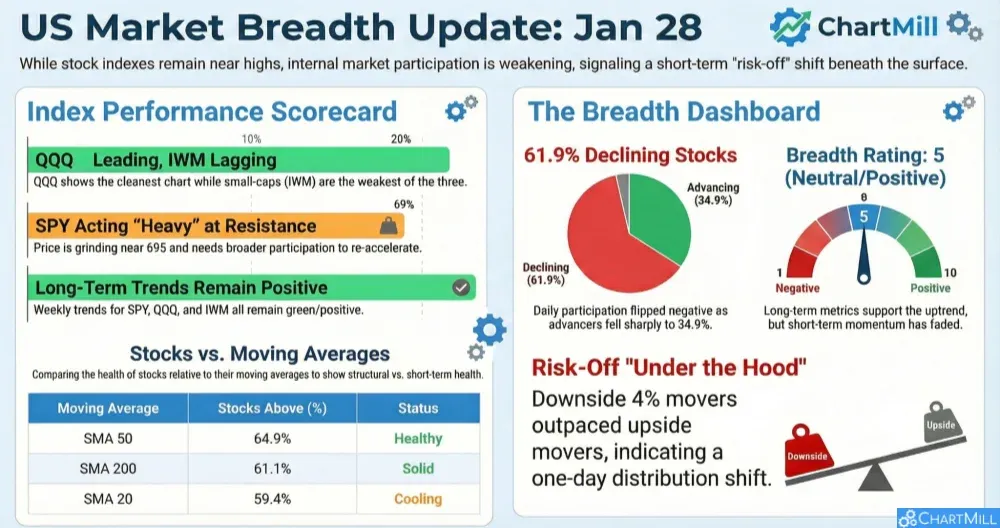
Index prices remain constructive near the highs, but participation weakened sharply on Jan 28. Decliners dominated, downside 4% movers outpaced upside movers, and several “stocks above key SMAs” gauges cooled off. This looks like rotation / digestion beneath the surface, yet it does reduce the short-term tailwind we saw building in the prior update.
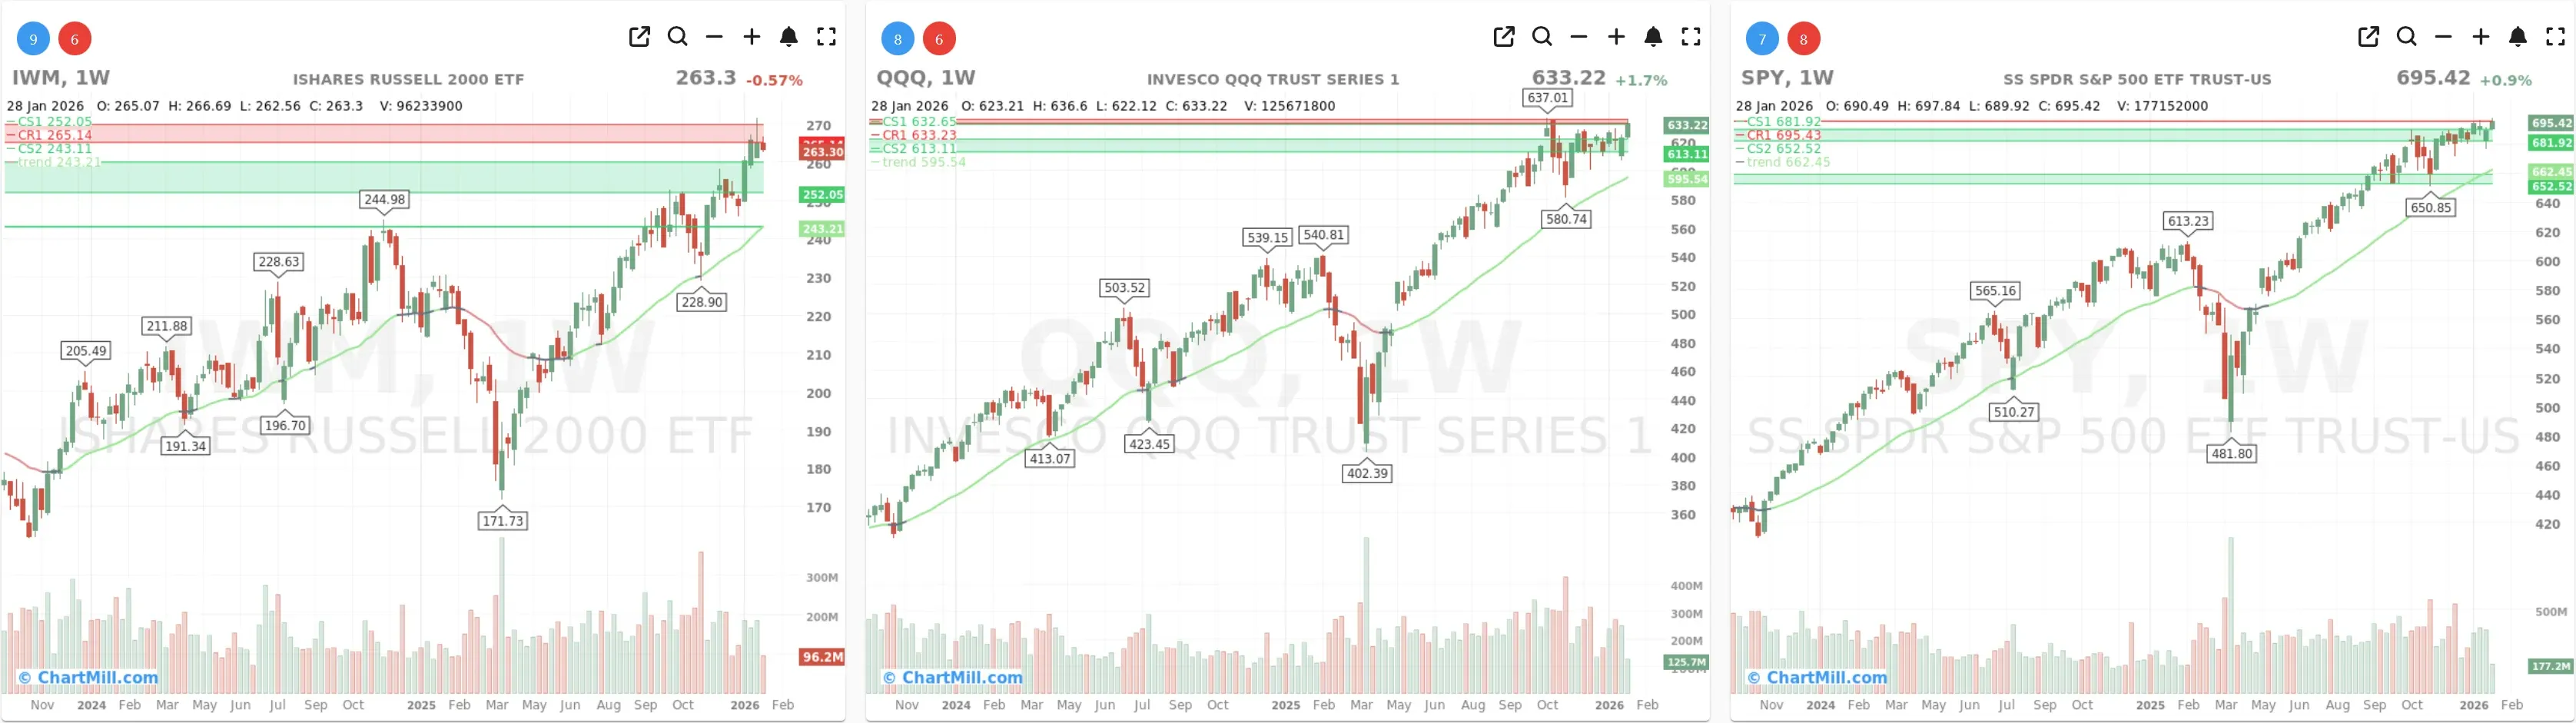
Long Term (Weekly)
SPY
Daily: Essentially flat, still above EMA9 and EMA21, and pressing the ~695 resistance area. The trend is intact, but price is now acting “heavy” at the top, more grind than thrust.
Weekly: Long-term trend remains green (positive). Price is pushing into overhead resistance, which often invites choppier trade and sector rotation rather than broad, clean continuation.
Takeaway: SPY is behaving like a market that can go higher, but needs broader participation to re-accelerate.
QQQ
Daily: QQQ closed higher and is comfortably above EMA9/EMA21, pushing into/through the upper resistance zone. This is the cleanest chart of the three.
Weekly: Long-term trend is green, and price is hovering right at the upper band.
Takeaway: Strength is increasingly concentrated in growth/mega-cap leadership, which is supportive for indexes but not ideal for breadth.
IWM
Daily: IWM slipped and is below EMA9 but still above EMA21, a normal pullback structure after a strong run, but clearly the weakest of the three on the day.
Weekly: Long-term trend is green, but price is stalling just beneath/inside a resistance band after a strong advance.
Takeaway: Small-caps are pausing, and that pause showed up clearly in the breadth numbers.
Breadth dashboard (Jan 28 vs. prior day context)
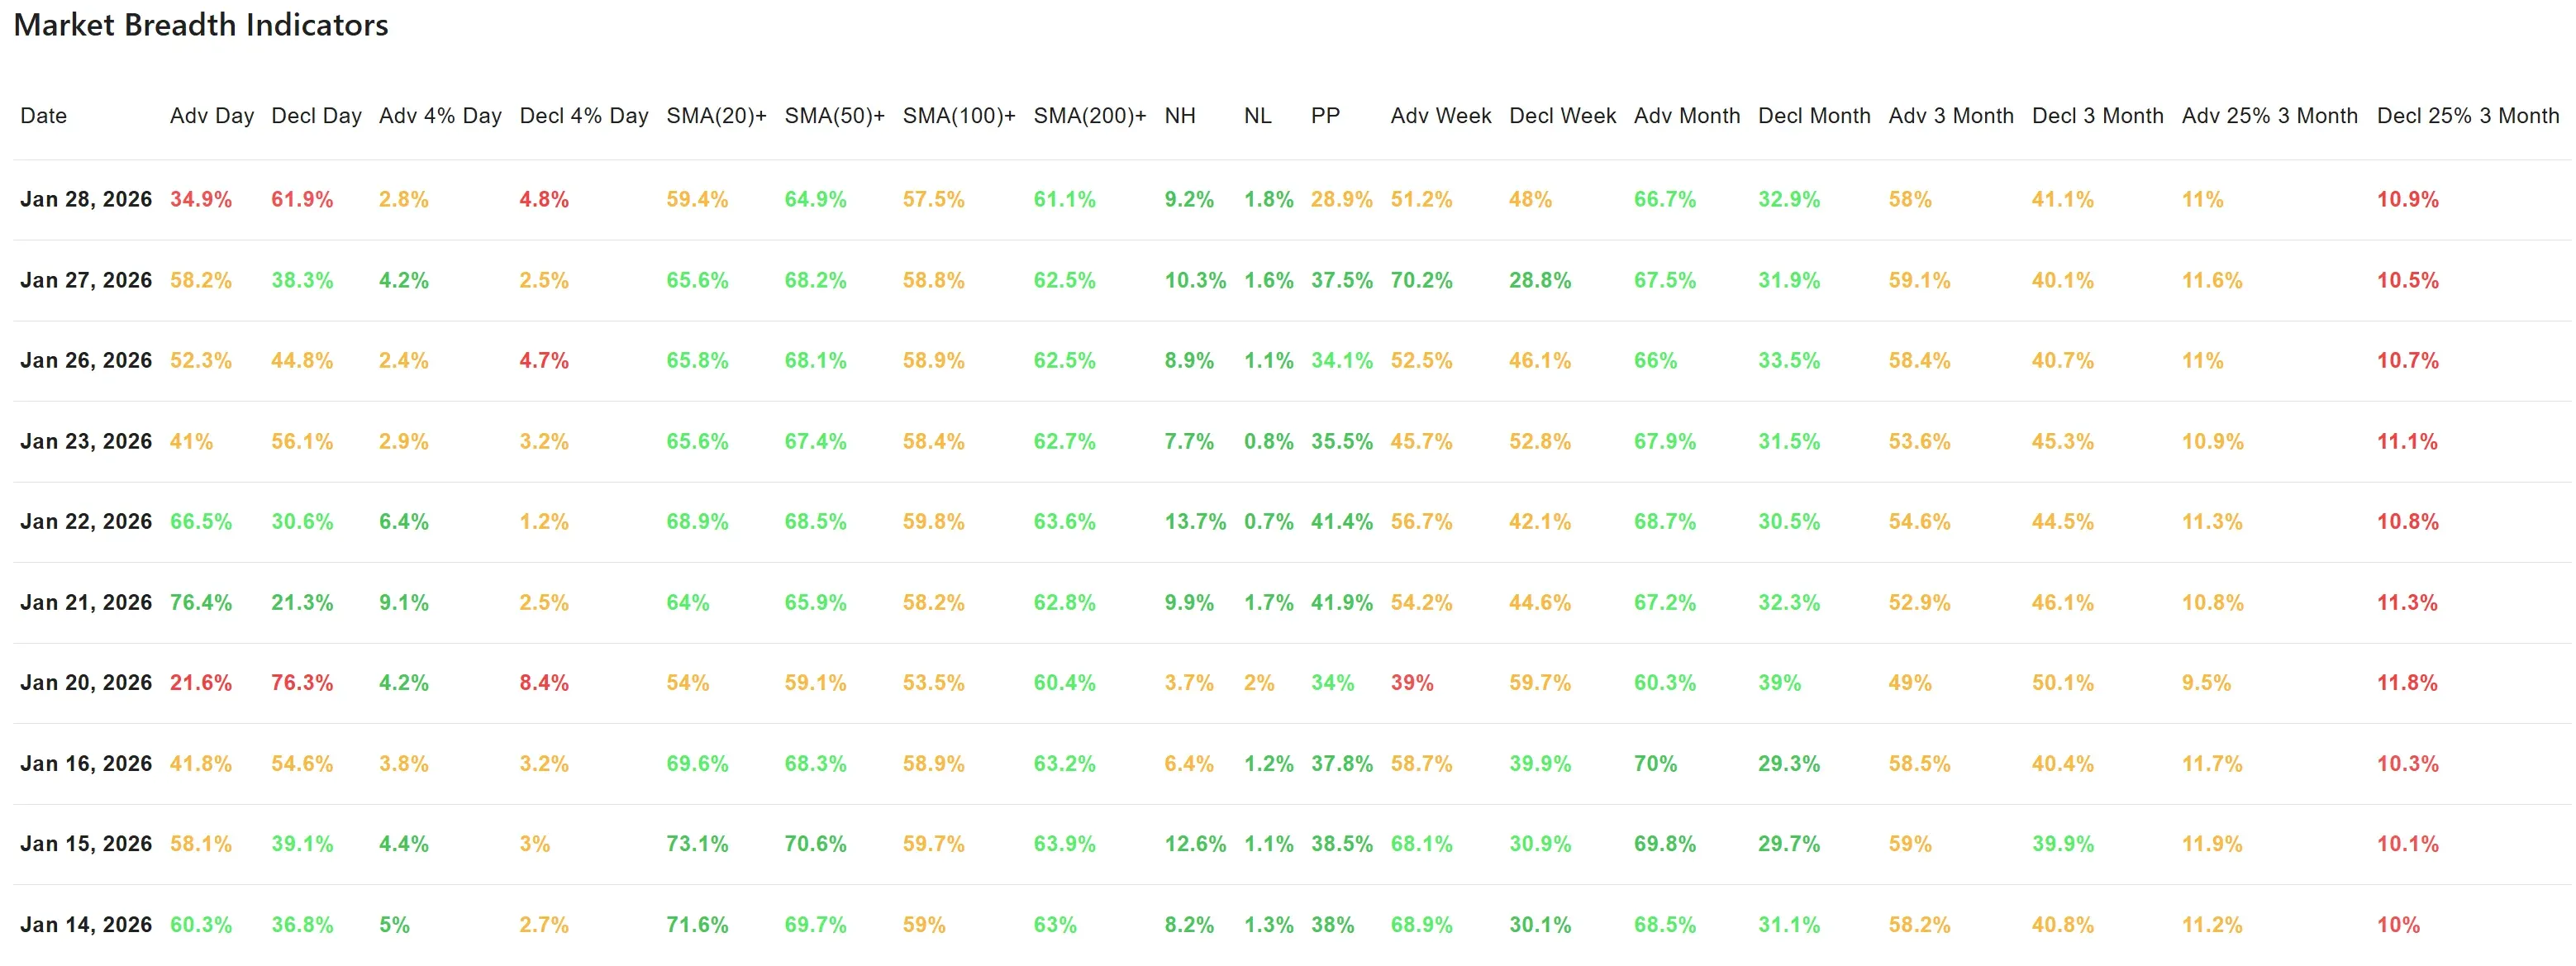
Daily participation flipped negative
-
Advancing stocks: 34.9% (down sharply)
-
Declining stocks: 61.9%
-
4% movers: Upside 2.8% vs downside 4.8%
That’s a meaningful “risk-off under the hood” shift versus the prior session, where advancers led and upside 4% movers were stronger. It’s not capitulation but it is distribution-leaning for a day.
“Stocks above key moving averages” cooled
-
SMA(20)+: 59.4% (down notably from the mid-60s)
-
SMA(50)+: 64.9% (still healthy)
-
SMA(100)+: 57.5%
-
SMA(200)+: 61.1%
Interpretation: the market remains structurally fine (50/200-day breadth still solid), but shorter-term participation lost momentum, matching the “stall at resistance” look in SPY/IWM.
New highs vs new lows still constructive
-
New Highs: 9.2%
-
New Lows: 1.8%
This is an important stabilizer. Even though today’s advance/decline was weak, the new-low list remains contained, which argues for a pullback/digestion narrative rather than broad breakdown risk.
Longer-term breadth still supports the uptrend
-
Advancing week: 51.2% vs Declining week 48% (nearly balanced)
-
Advancing month: 66.7% (strong)
-
Advancing 3-month: 58% (still favorable)
This aligns with the weekly trend backdrop: the primary trend remains up, but the market is increasingly prone to rotation days where indexes look fine while many stocks sag.
What changed vs the previous update?
In the prior session, breadth was acting like it was re-accelerating (better participation and stronger upside thrust). Today did the opposite: a sharp one-day breadth fade while SPY/QQQ stayed near highs.
That combination typically means:
-
leadership is narrowing (QQQ strength vs IWM weakness),
-
the market is digesting gains near resistance,
-
and stock-pickers will feel more chop beneath the surface even if the indexes don’t show it.
Breadth trend rating (1–7)
Rating: 5 — neutral with a positive bias.
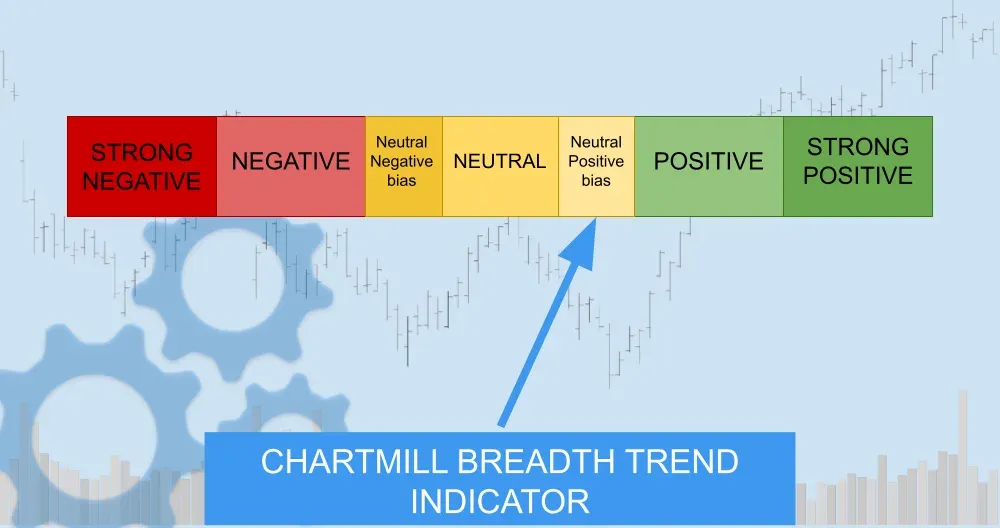
The longer-term metrics (month/3-month breadth, low new-lows, healthy % above 50/200-day) still support the uptrend, but today’s negative daily participation + heavier downside movers is a clear short-term caution flag.
If this persists for 2–3 sessions, the rating would likely slip toward 4 (neutral); if participation snaps back while SPY/QQQ break cleanly higher, it can quickly revert to 6 (positive).
Kristoff
Next to read: The Fed Hits Pause — and the AI Spending Arms Race Hits the Gas