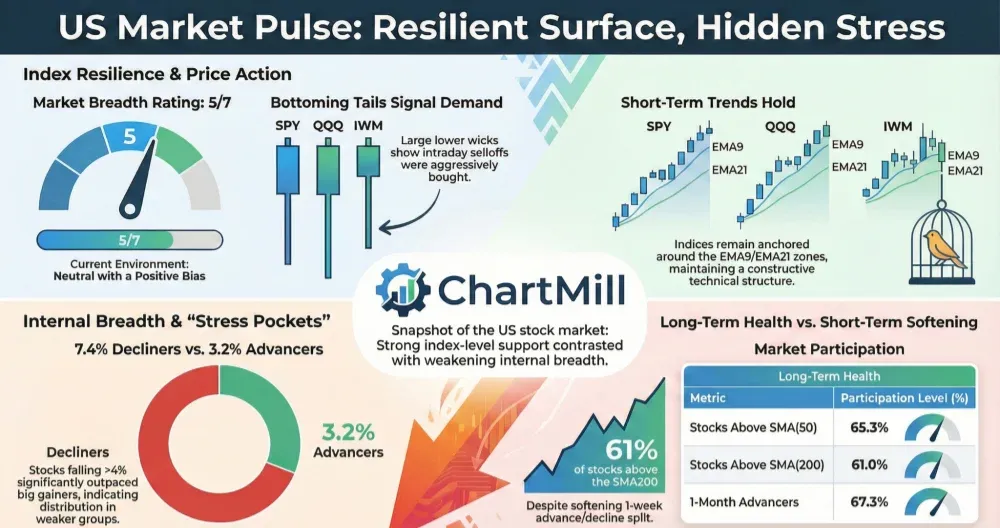

The major indexes remain in solid uptrends and are holding above key moving averages, but today’s breadth improved only marginally and still shows “stress pockets” beneath the surface. The rise in >4% decliners and a weaker 1-week advance/decline split suggest rotation and digestion near highs rather than a broad-based expansion.
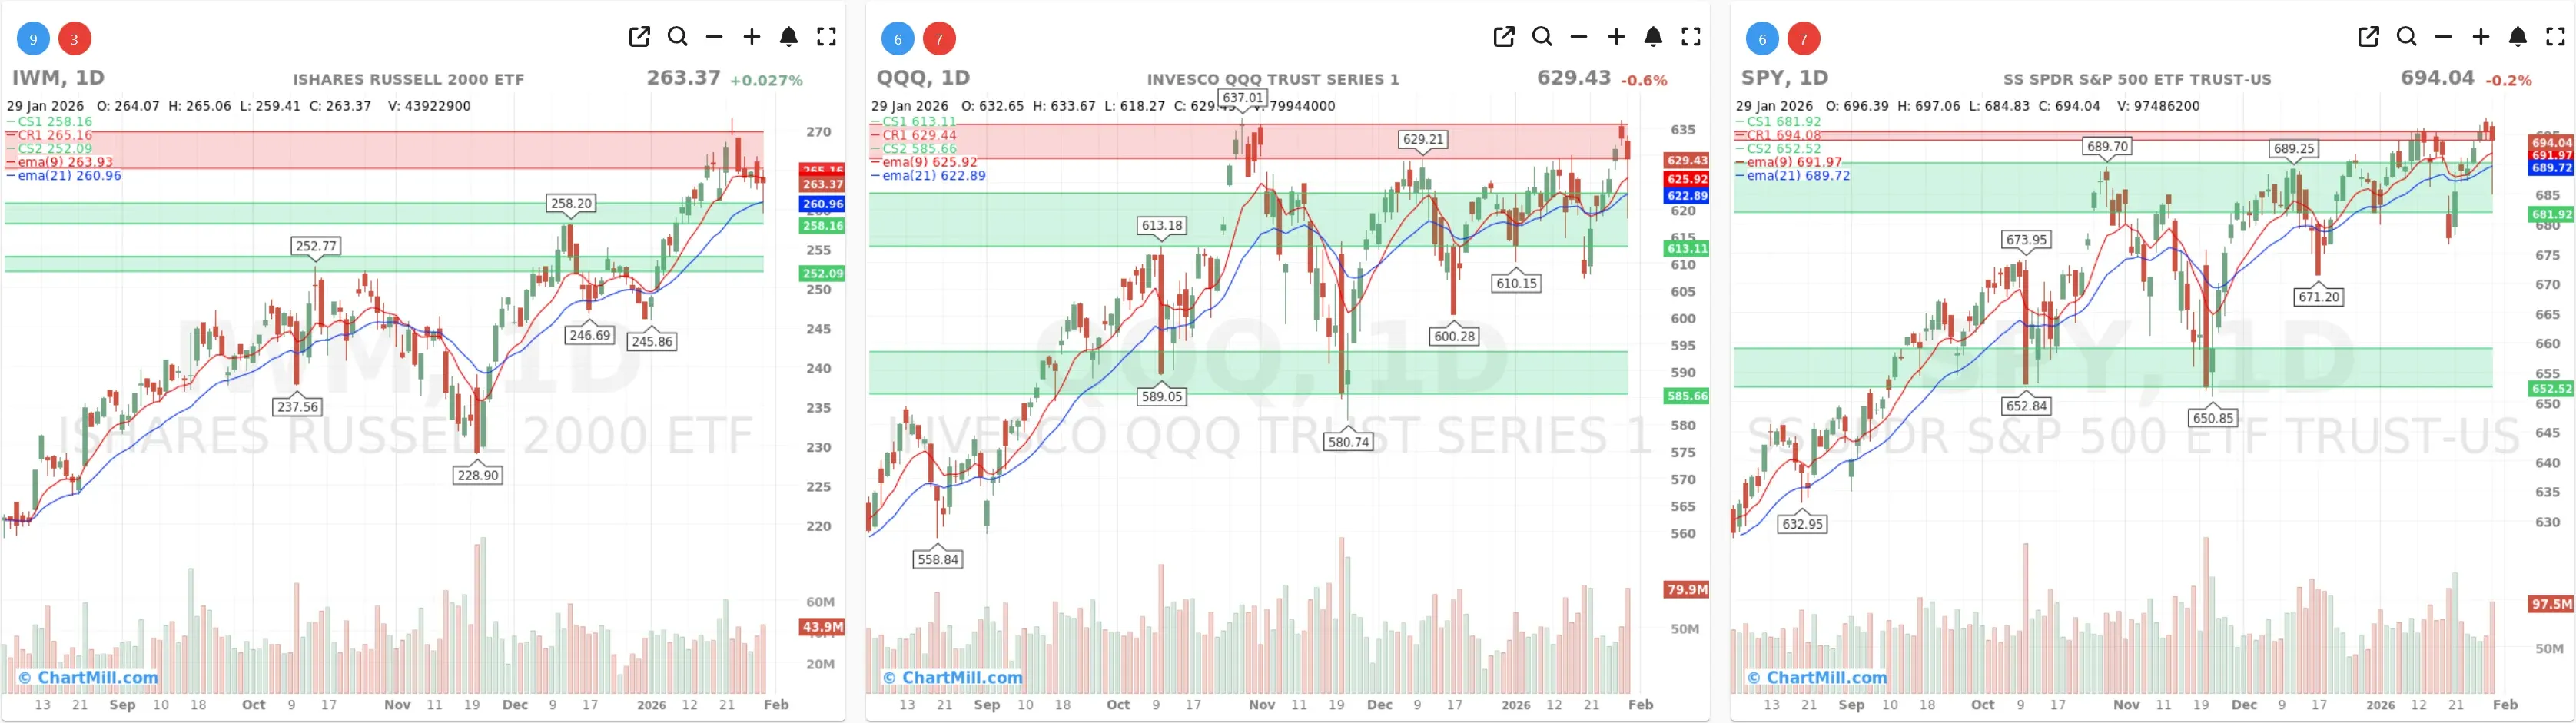
Index overview (SPY, QQQ, IWM)
Short Term (Daily)
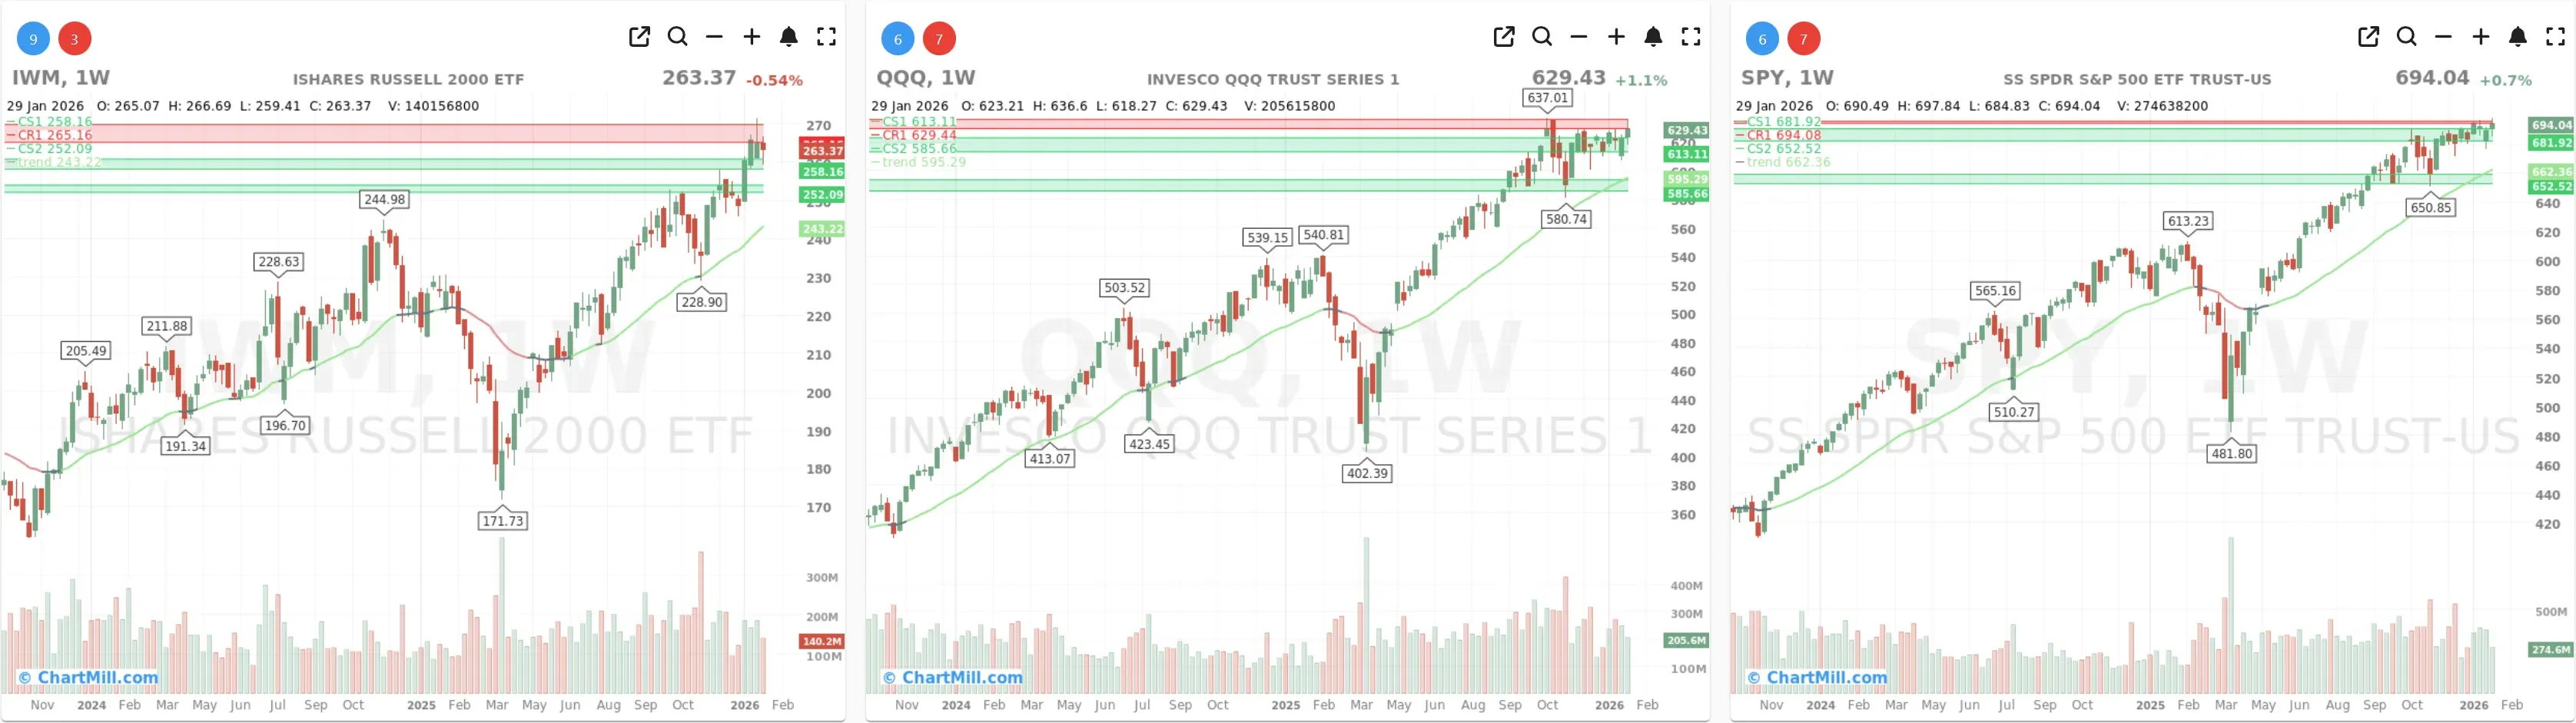
Long Term (Weekly)
SPY
SPY’s daily candle tells the story: a large lower wick (bottoming tail) signals a sharp intraday selloff that got aggressively bought back before the close. That kind of “flush-and-reverse” price action typically reflects two-sided volatility: weak hands getting forced out, then stronger demand stepping in near support.
Despite the chaos, SPY still held its short-term trend structure (price staying anchored around the EMA9/EMA21 zone), which is why the day reads more like violent digestion than a clean breakdown.
Takeaway: The trend is still intact, but the market is emotionally charged, expect follow-through attempts to be choppy unless breadth improves.
QQQ
QQQ also printed a prominent lower tail, showing that tech saw heavy intraday pressure and then a decisive rebound. This is especially notable because QQQ is operating near overhead supply/resistance on the weekly view, where false breaks and fast reversals are common. The tail suggests buyers are still defending dips, but it also confirms that sellers are active and willing to press.
Takeaway: Bulls are still present, but the intraday volatility spike is a warning that leadership is being tested near resistance.
IWM
IWM’s candle is arguably the most “telling”: it shows a deep intraday push lower followed by a meaningful rebound, leaving a clear bottoming tail as well. Since IWM has been stalling under resistance, this kind of action often indicates failed sell-through, sellers tried to break it down, but couldn’t keep it there. Still, repeated whipsaws around resistance can also mean the market is indecisive and needs broader participation to resolve upward.
Takeaway: Small caps showed dip buyers stepping in, but the price action remains erratic until a clean break (or rejection) resolves the range.
What these tails imply (in breadth terms)
Big bottoming tails across all three indexes are consistent with the current breadth read: indexes held up, but the internals showed stress pockets (notably elevated >4% decliners).
In other words: index-level support buying is real, but beneath the surface the market is still rotating and shaking out weaker areas.
If we see another session with similar lower wicks and improving adv/decl and fewer big decliners, that’s often the start of a renewed breadth push. If tails persist while breadth keeps weakening, it can also mean distribution masked by strong index-level dip-buying.
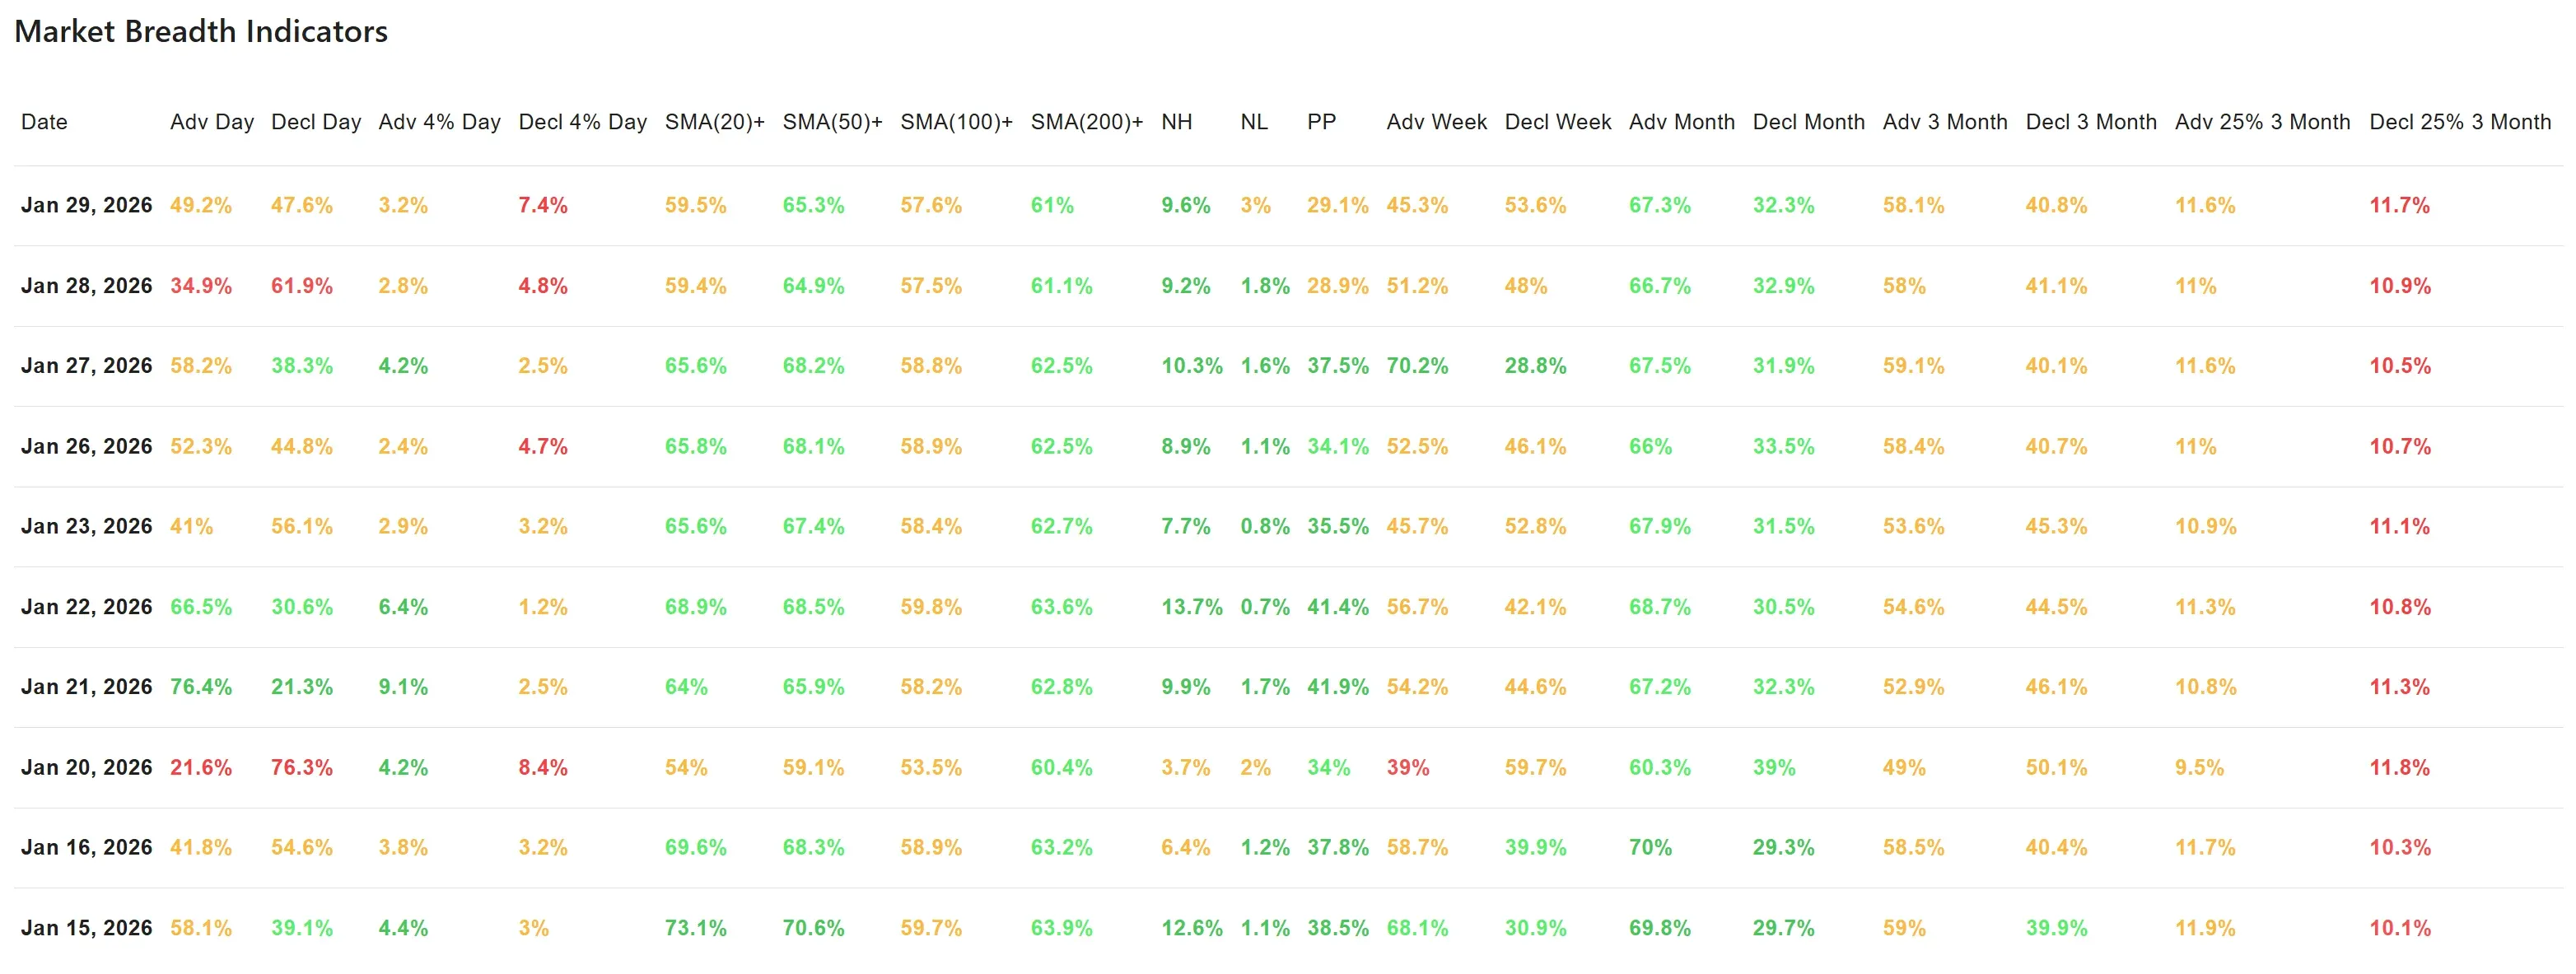
Market breadth (latest session: Jan 29, 2026)
Daily breadth: “flat on the surface, rougher underneath”
-
Advancers vs Decliners: 49.2% vs 47.6% → essentially neutral day breadth.
-
Big movers (>4%): 3.2% advanced >4%, while 7.4% declined >4% → this is the key tell.
Even though the headline advance/decline split looks balanced, the skew toward large down-moves suggests distribution in weaker groups and/or profit-taking in extended names. This matches what we see in the indexes: holding up, but not effortlessly broad.
Trend participation remains healthy (especially intermediate/long-term)
-
Above SMA(20): 59.5%
-
Above SMA(50): 65.3%
-
Above SMA(100): 57.6%
-
Above SMA(200): 61.0%
This is still a bullish participation backdrop, particularly with SMA50+ > 65% and SMA200+ > 60%. So despite the short-term “heavier decliners,” the market is not in a fragile state overall.
Highs/lows are supportive, but not roaring
-
New Highs: 9.6%
-
New Lows: 3.0%
New highs remain meaningfully above new lows, which supports the view that this is rotation/digestion, not a broad breakdown.
Multi-day picture: short-term weakening vs strong monthly/quarterly trend
-
1-week: 45.3% adv vs 53.6% decl → softening
-
1-month: 67.3% adv vs 32.3% decl → strong
-
3-month: 58.1% adv vs 40.8% decl → positive
This combination often appears when markets are uptrend-correcting through time: the bigger trend stays constructive, while the last week gets choppier.
Compared with the previous trading day (Jan 28)
Yesterday’s breadth was clearly weaker on the surface (decliners dominated), and today improved mainly by moving back toward neutral on the adv/decl split. However, the market didn’t fully “heal” underneath, the jump in >4% decliners is a sign that selling pressure concentrated in pockets even while index-level damage stayed limited.
In plain terms: yesterday looked broadly weak; today looked calmer, but the “hard down” list got longer, classic selective risk-off within an ongoing uptrend.
What to watch next
If the indexes remain above their EMA9/EMA21 while >4% decliners shrink, breadth can re-expand quickly.
If SMA20+ rolls over (from ~60% down toward the low-50s) and new lows start rising, that would signal the rotation is turning into broader weakness.
IWM is a useful “canary” here: a clean reclaim of resistance would likely coincide with improving breadth.
Breadth trend rating (1–7)
5 — Neutral, positive bias.
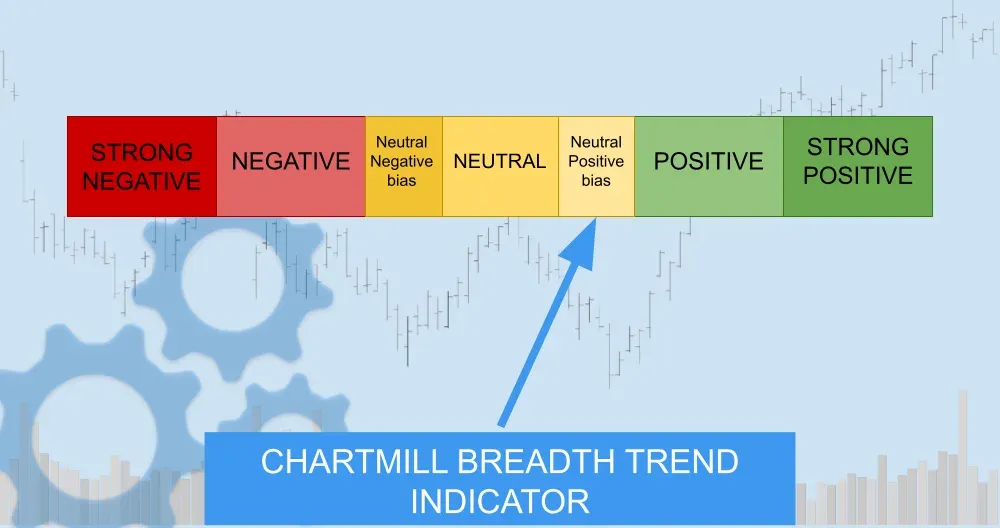
The market’s intermediate/long-term participation is still solid and the indexes remain technically healthy, but short-term internal weakness (more heavy decliners and a softer 1-week split) argues for a more selective, risk-managed stance until breadth re-accelerates.
Kristoff
Next to read: AI Budget Hangover: Microsoft Sinks, Meta Soars, and Apple Steals the After-Hours Show