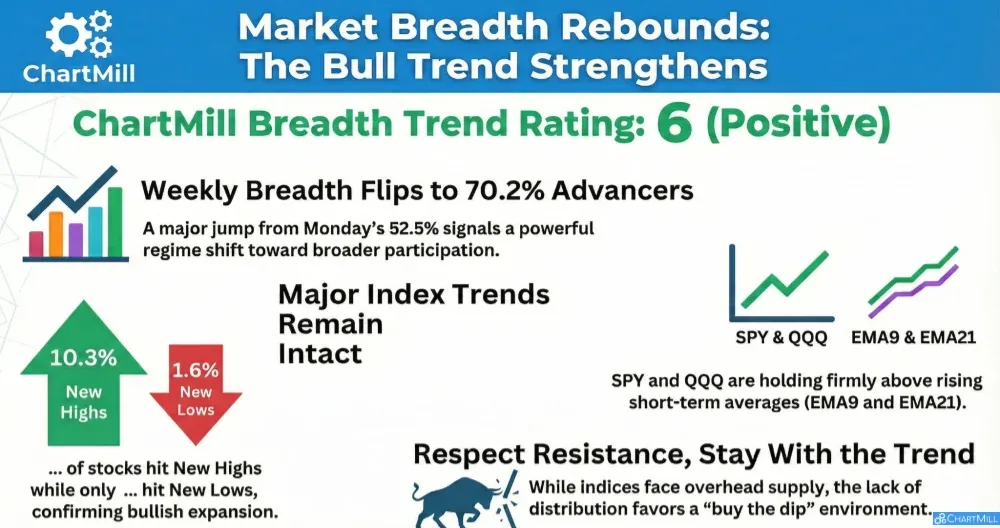
Breadth improved meaningfully versus Monday, with a clear uptick in advancing stocks and a strong weekly breadth push. The major index ETFs remain in established uptrends (above rising short-term averages on the daily charts, and supported by a green long-term trend on the weekly charts), even as some areas are bumping into near-term resistance.
Index overview (SPY, QQQ, IWM)
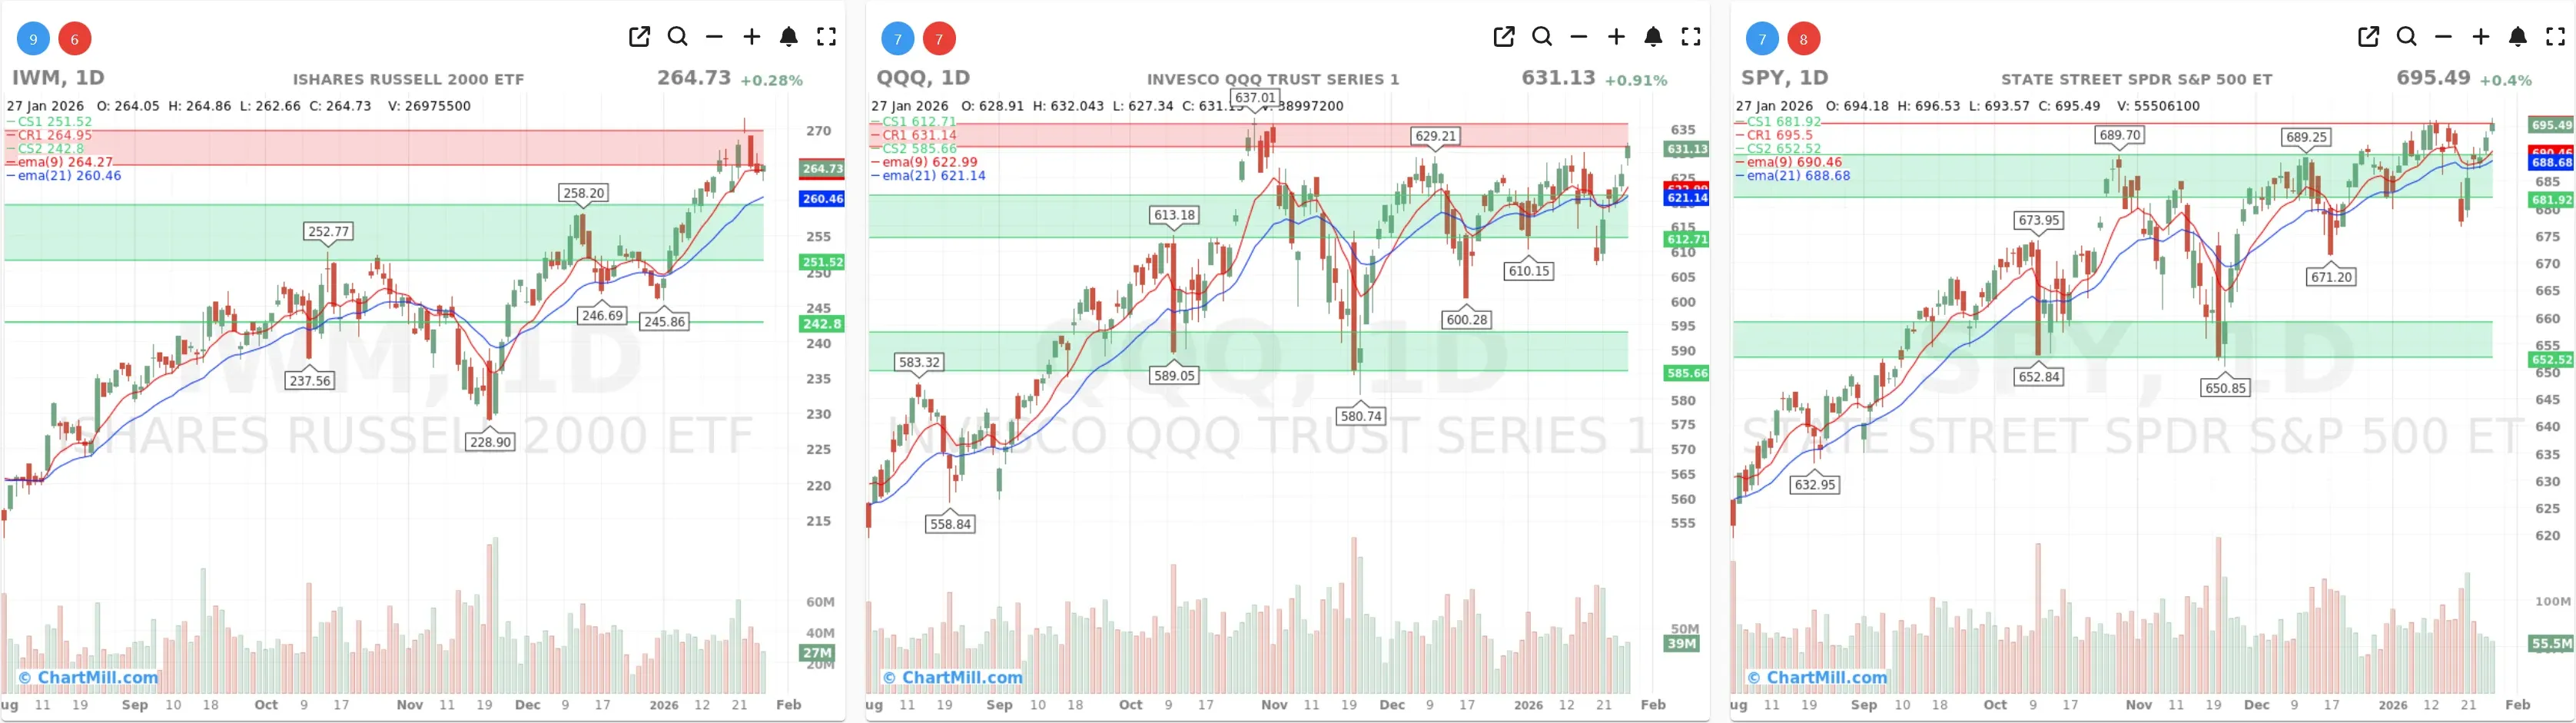
Short Term (Daily)
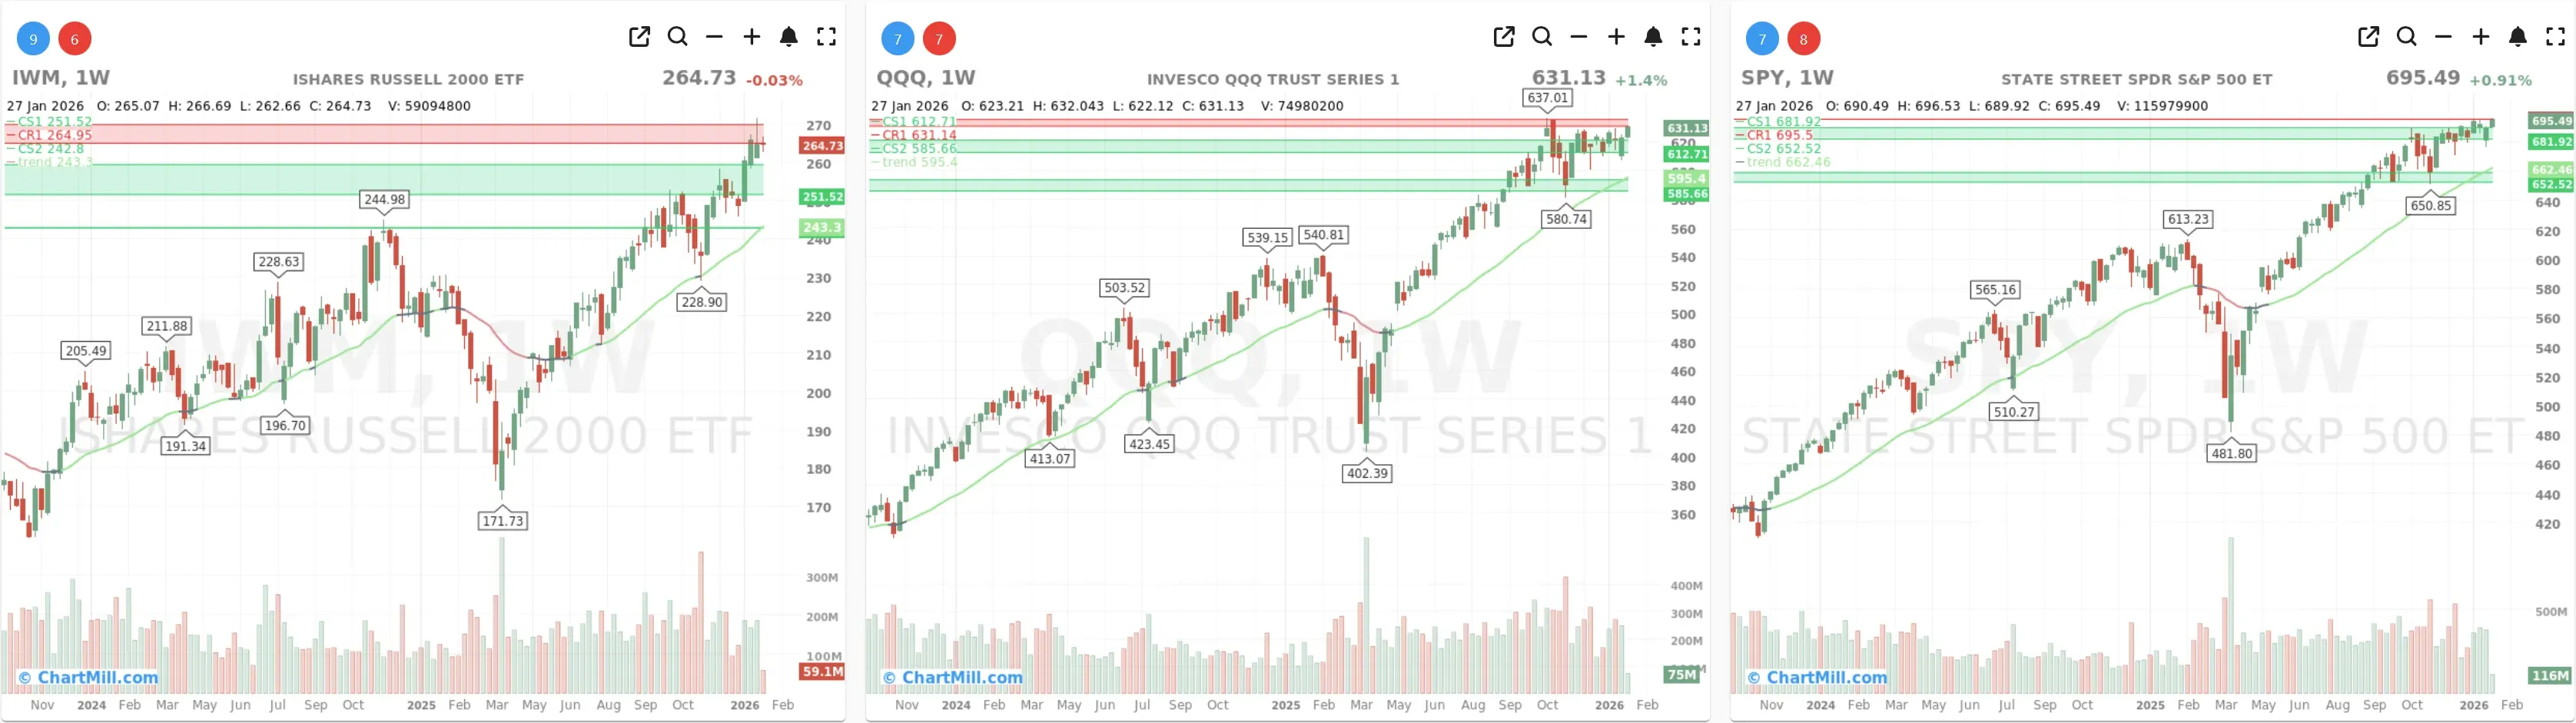
Long Term (Weekly)
SPY - trend intact, back near the highs
Daily: SPY closed 695.49, holding above EMA9 (~690.46) and EMA21 (~688.68). Price continues to respect the rising short-term trend, with pullbacks being contained and quickly bought back.
Key levels: The market is still operating close to prior breakout territory, with the upper zone acting as “acceptance above the breakout” rather than rejection. A clean push and hold above the recent peak area would keep momentum pressure to the upside.
Weekly: The ChartMill Trend Indicator remains green, confirming the broader uptrend. Price action remains constructive and well-supported by the rising long-term average.
Read: Bull trend behavior. No sign of distribution in the structure itself, just normal digestion near highs.
QQQ - strong, but still working under overhead supply
Daily: QQQ closed 631.13, also comfortably above EMA9 (~622.99) and EMA21 (~621.14). The short-term trend is clearly positive.
Key levels: The chart shows repeated interaction with a nearby resistance band (the “ceiling” area overhead). QQQ is strong, but it’s still in that “prove it” zone where follow-through matters. A breakout above that band would likely act as a breadth tailwind.
Weekly: Trend Indicator is green and price is holding in a mature uptrend. Consolidation near the top of the range remains bullish as long as pullbacks stay controlled.
Read: Leadership still healthy. This looks more like consolidation before continuation than a breakdown setup.
IWM - small caps pause at resistance
Daily: IWM closed 264.73 (essentially flat to slightly lower on the day), sitting on/just above the EMA9 (~264.3) and well above EMA21 (~260.46).
Key levels: Small caps are pressing into a resistance zone (overhead supply is visible). That can cause choppy candles and quick reversals, but as long as price stays above the rising EMAs, the trend is still intact.
Weekly: Trend Indicator remains green, confirming the longer-term uptrend. The recent advance is extended, so a pause/consolidation here would be normal, not automatically bearish.
Read: Small caps are still supportive, but they’re the “most likely to chop” at this moment due to nearby resistance.
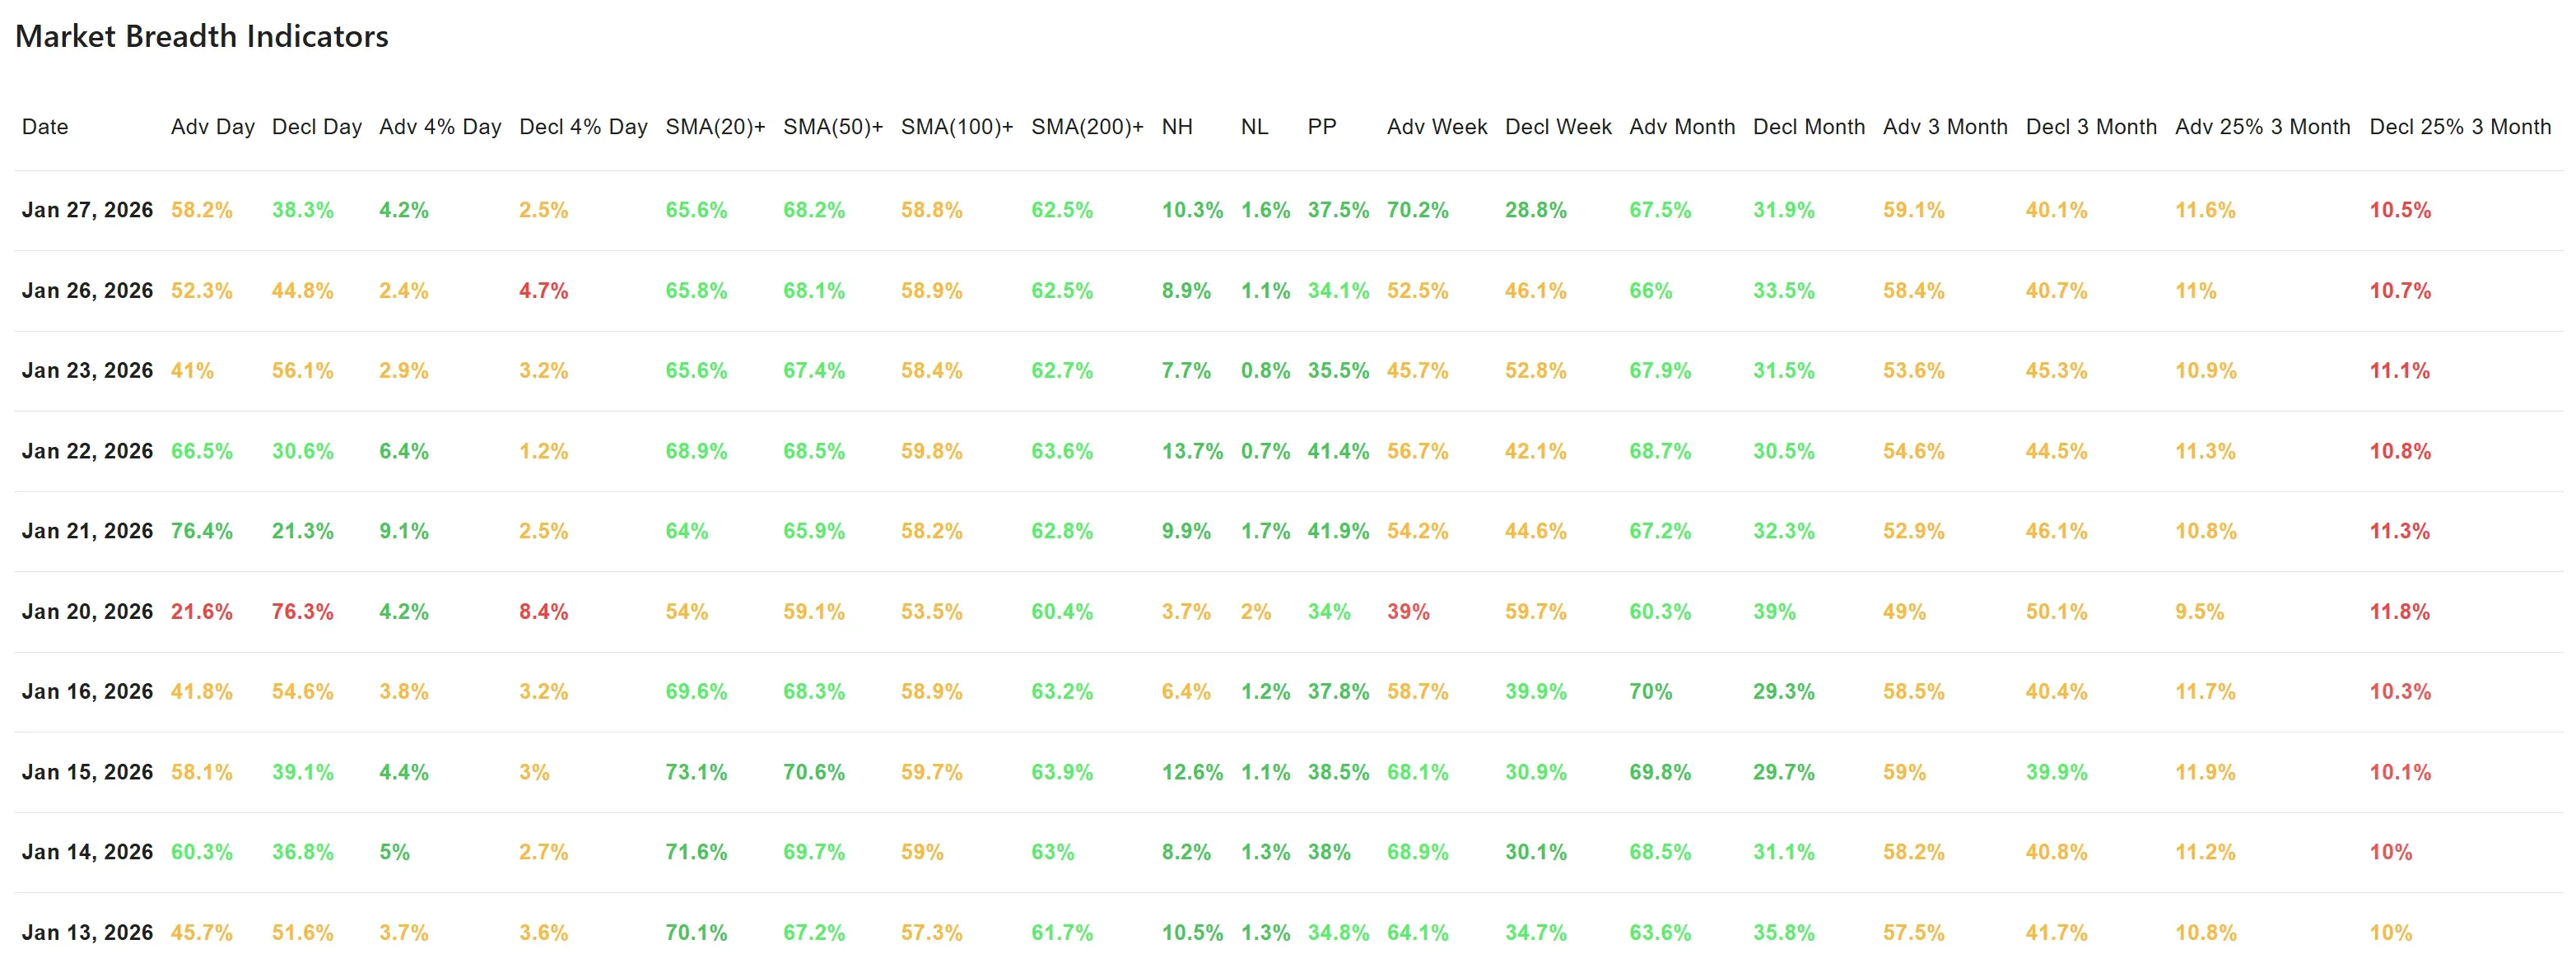
Market breadth dashboard (10-day dataset)
What improved vs Monday (Jan 26 → Jan 27)
-
Advancing stocks (day): 58.2% (up from 52.3%)
-
Declining stocks (day): 38.3% (down from 44.8%)
Big movers:
-
Advancers +4%: 4.2% (up from 2.4%)
-
Decliners -4%: 2.5% (down from 4.7%)
That’s an important combination: more upside momentum and fewer heavy downside days, which typically signals improving participation.
Trend participation (stocks above key SMAs)
-Above SMA(20): 65.6%
-
Above SMA(50): 68.2%
-
Above SMA(100): 58.8%
-
Above SMA(200): 62.5%
These are still healthy “bull market” participation levels, especially the 50/200-day readings staying comfortably above 60% (with the 100-day also near 59%).
Highs vs lows
- New Highs (NH): 10.3% vs New Lows (NL): 1.6%
This is a net bullish expansion. You want NH to remain clearly above NL during an uptrend; that’s still the case.
Weekly breadth swing (the standout today)
-
Adv Week: 70.2% (from 52.5%)
-
Decl Week: 28.8% (from 46.1%)
This is the clearest “regime shift” in the table versus Monday: weekly breadth flipped back to decisively positive, aligning well with the still-bullish index trends.
Medium-term backdrop (3-month metrics)
-
Adv 3 Month: 59.1% vs Decl 3 Month: 40.1% (slightly better than Monday)
-
Adv 25% (3M): 11.6% vs Decl 25% (3M): 10.5%
This suggests progress, but not an overheated “everything is ripping” tape. That’s often a good thing: constructive conditions without extreme froth.
Linking this to the previous breadth read (Monday)
Monday’s numbers already suggested the market was still structurally bullish (solid % above SMAs, limited new lows), but the day-to-day push wasn’t as convincing and weekly breadth was more mixed.
Today, the market followed up in the right way:
-
Daily breadth improved (more advancers, fewer -4% decliners),
-
Weekly breadth re-accelerated (70% advancing is a strong confirmation),
Index trends stayed intact (SPY/QQQ firm above EMAs; IWM digesting near resistance rather than breaking trend).
In other words: the “bullish structure” from Monday got better confirmation today.
Context check (brief, non-speculative)
This kind of breadth improvement often shows up during periods where markets are responding to incremental sentiment shifts (e.g., earnings reactions, rate expectations, or positioning), but the breadth data itself mainly tells us one thing: buyers were more broadly active today, and downside pressure was less intense.
Breadth trend rating (1–7)
Rating: 6 — Positive
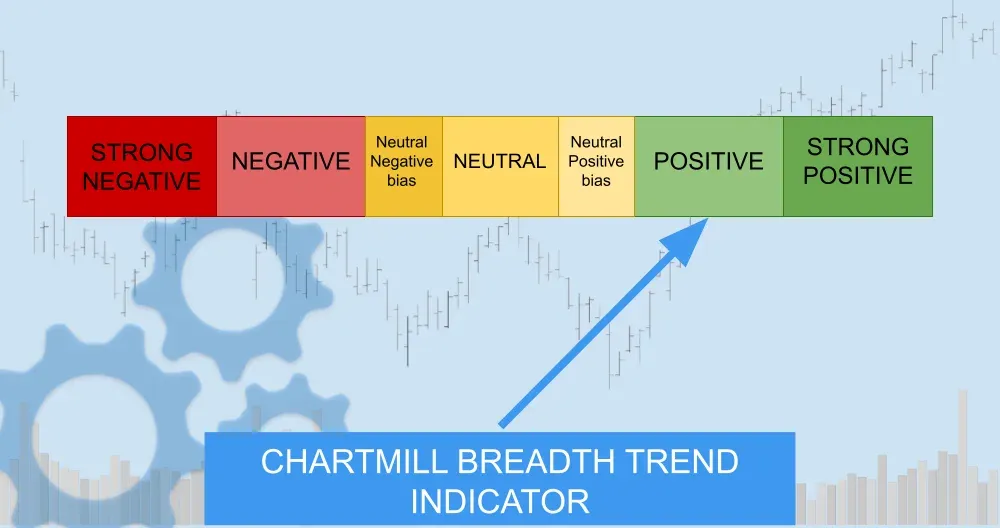
The combination of strong weekly breadth, healthy SMA participation, and NH >> NL supports a positive stance. I’m stopping short of “very positive” mainly because leadership is still negotiating resistance in places (notably QQQ overhead supply and IWM at a ceiling) and the 3-month “+25%” metrics aren’t screaming euphoric momentum; more constructive than explosive.
Key takeaway
As long as SPY and QQQ remain above their rising EMA9/EMA21 and new lows stay contained, the breadth backdrop favors staying with the trend, while respecting that some near-term chop is normal as the market works through overhead resistance zones.
Kristoff
Next to read: Tech Floats the Index While Health Care Springs a Leak