

(All data & visualisations by ChartMill.com)
Daily Market Trend Analysis – May 14, 2025 (After Market Close)
The overall short-term market trend remains bullish, as all three major index ETFs, SPY, QQQ and IWM, continue to hold above key support levels, despite mixed intraday performances.
The long-term trend remains neutral overall, although QQQ continues to stand out with a positive long-term trend. Both SPY and IWM remain in neutral territory, reflecting the broader market’s hesitance to break decisively into new high ground.
Short Term Trend
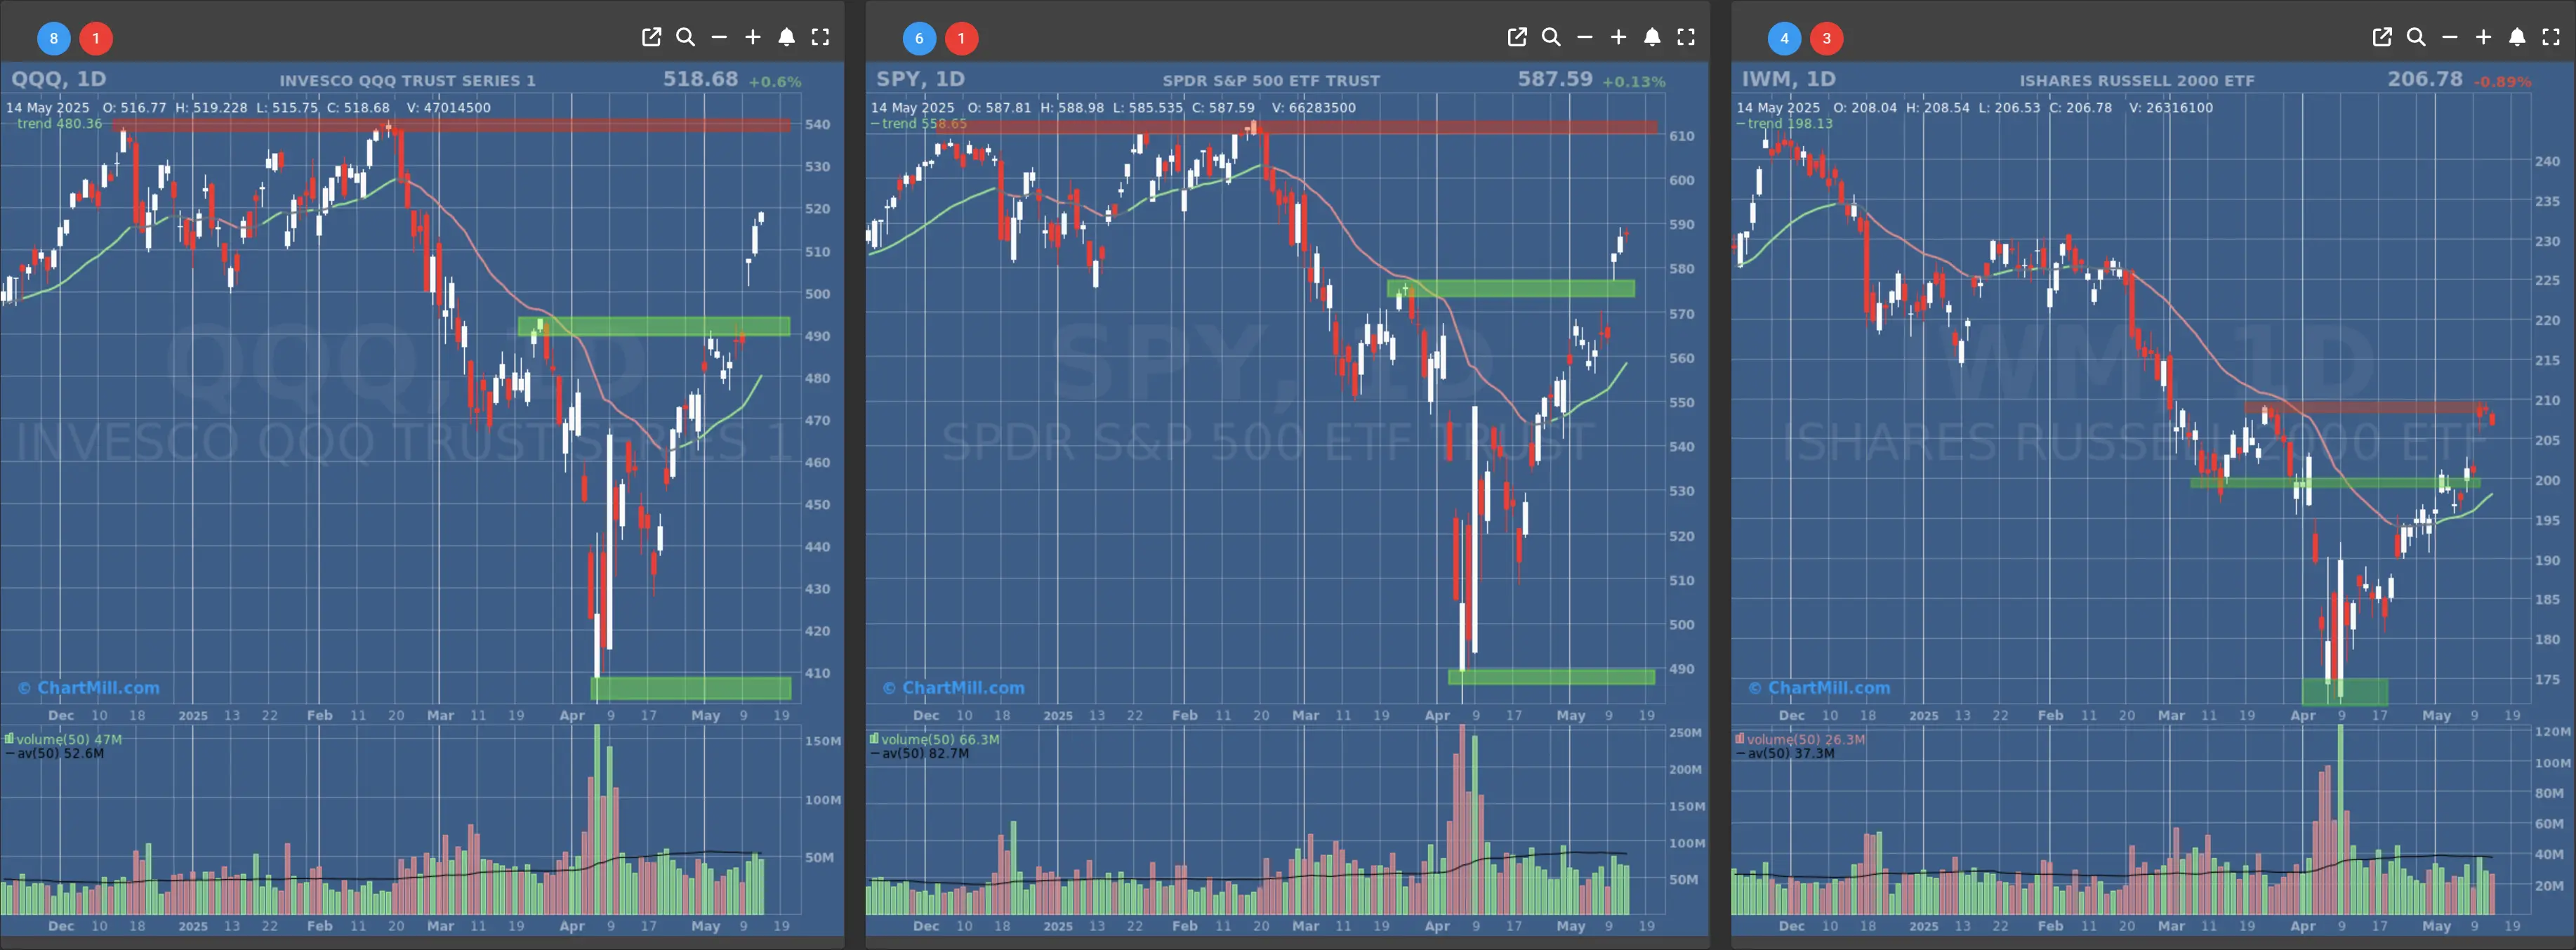
- Short-Term Trend: Bullish (no change)
- Support at $560 - $570
- Resistance at $610
- Volume: At average (50)
- Pattern: Inside day
- Short-Term Trend: Bullish (no change)
- Support at $490 - $500
- Resistance at $540
- Volume: At average (50)
- Pattern: Follow-through day
- Short-Term Trend: Bullish (no change)
- Support at $200
- Resistance at $210-215
- Volume: Below average (50)
- Pattern: Down day
Long Term Trend
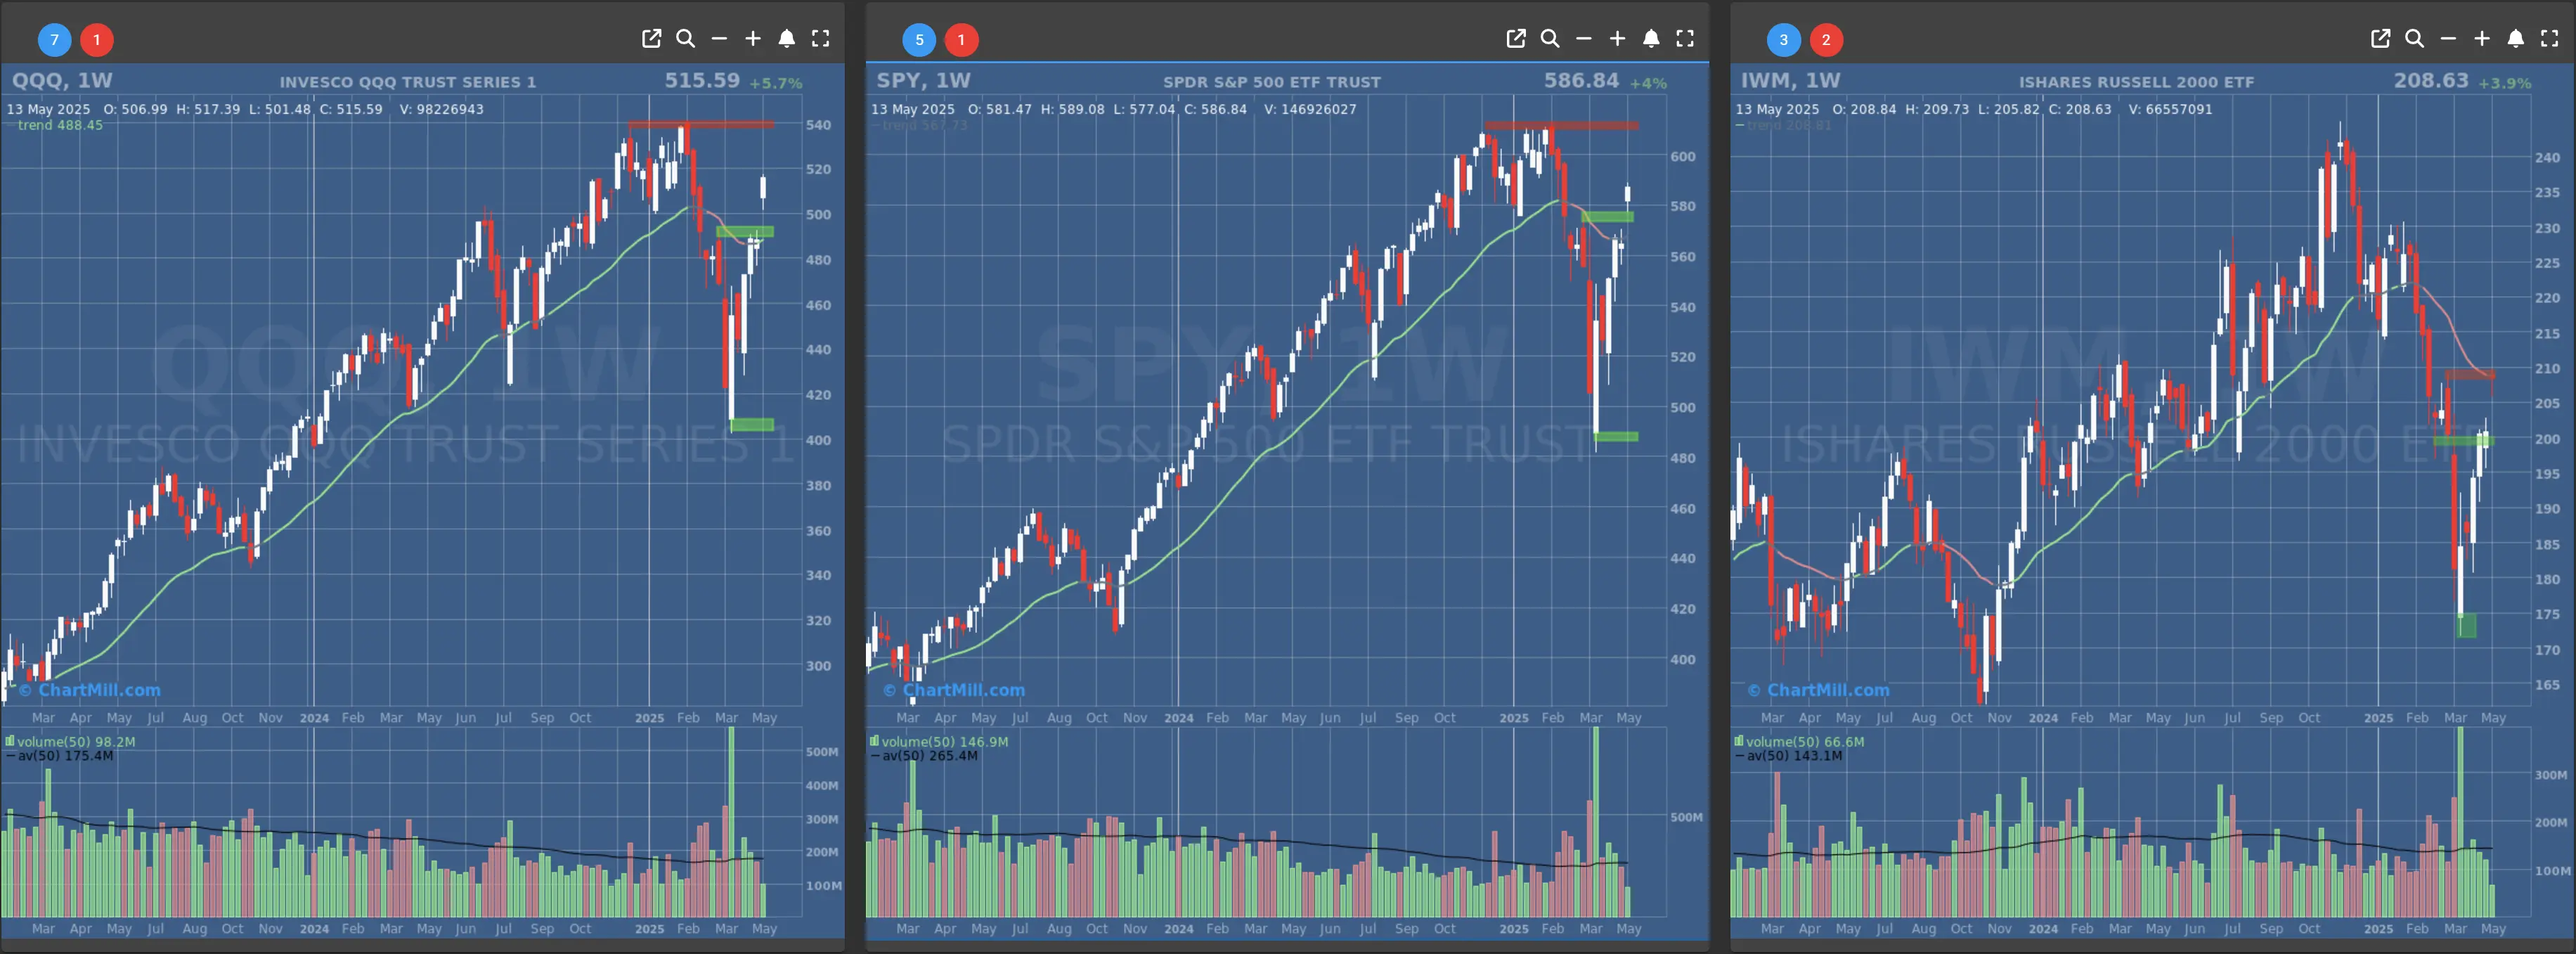
- Long-Term Trend: Neutral (no change)
- Long-Term Trend: Positive (no change)
- Long-Term Trend: Neutral (no change)
Daily Market Breadth Analysis – May 14, 2025 (After Market Close)
Overall Trend: Momentum Weakening After Strong Run
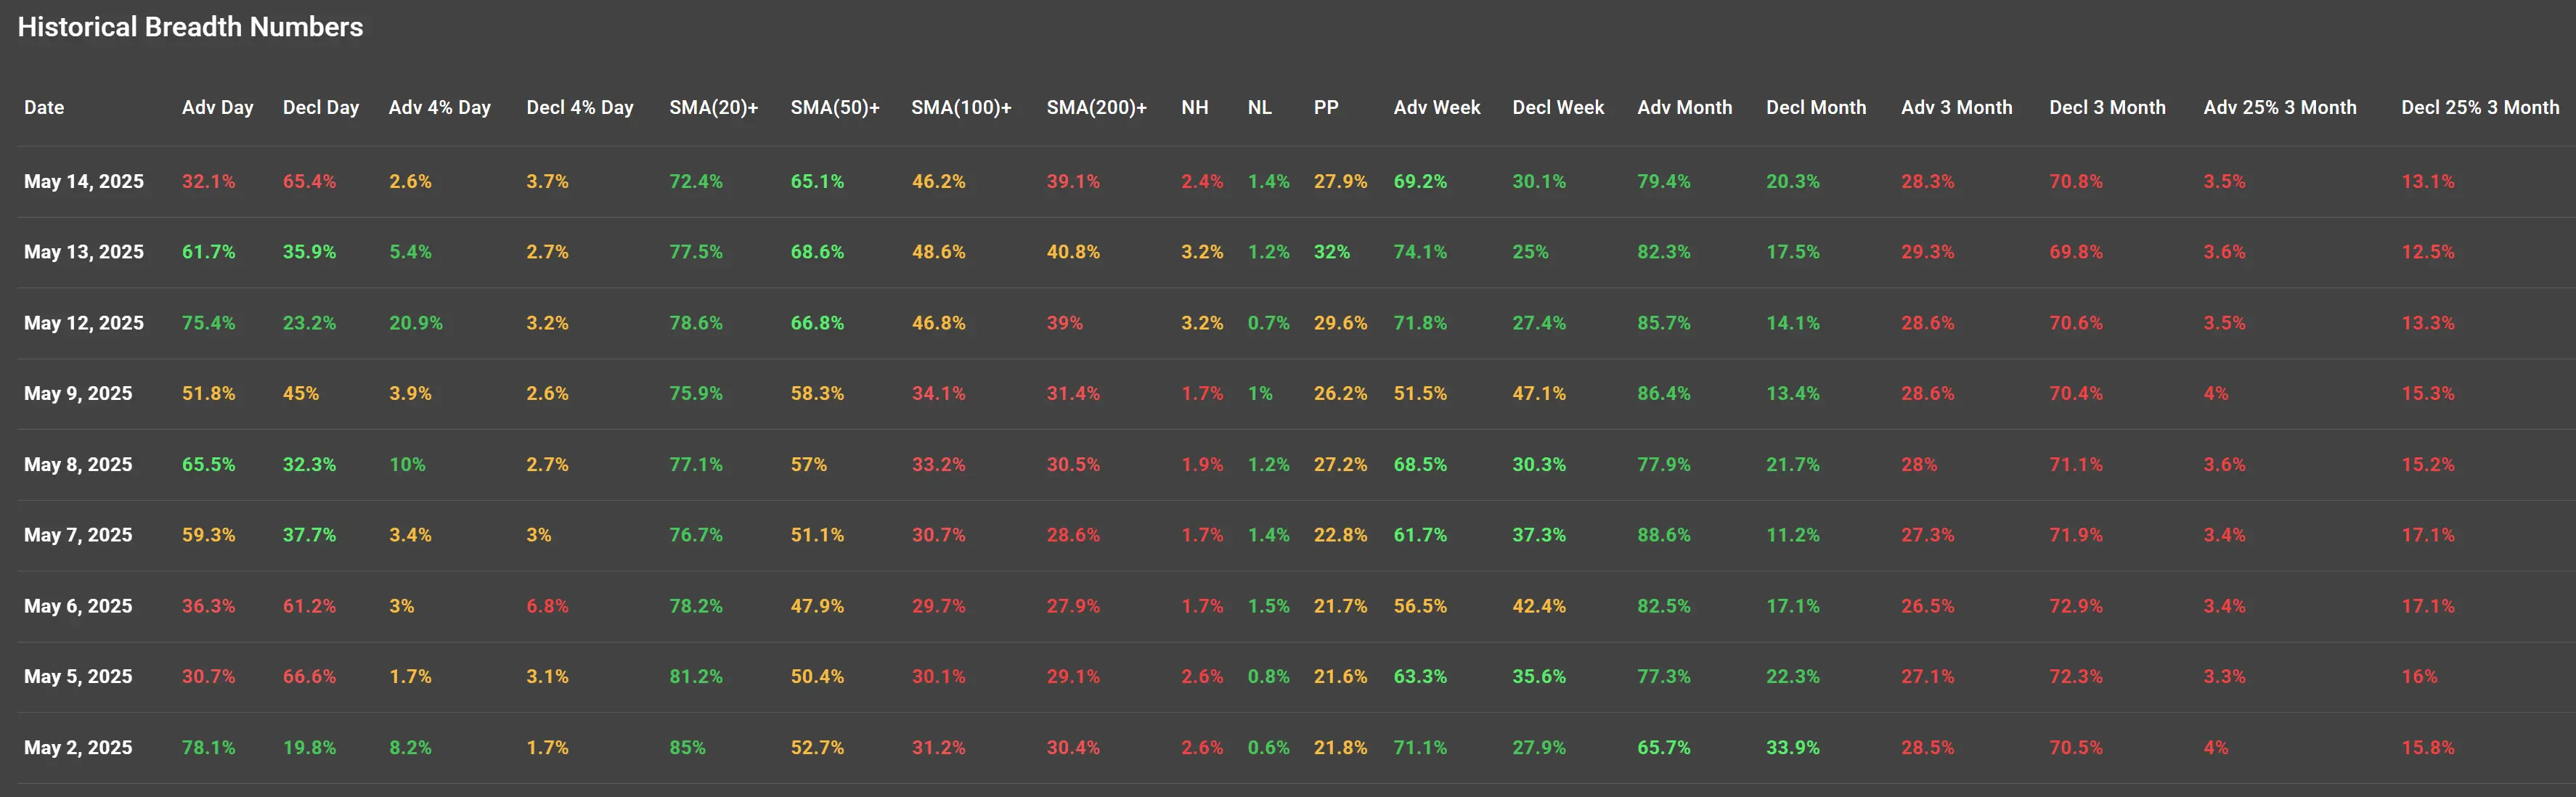
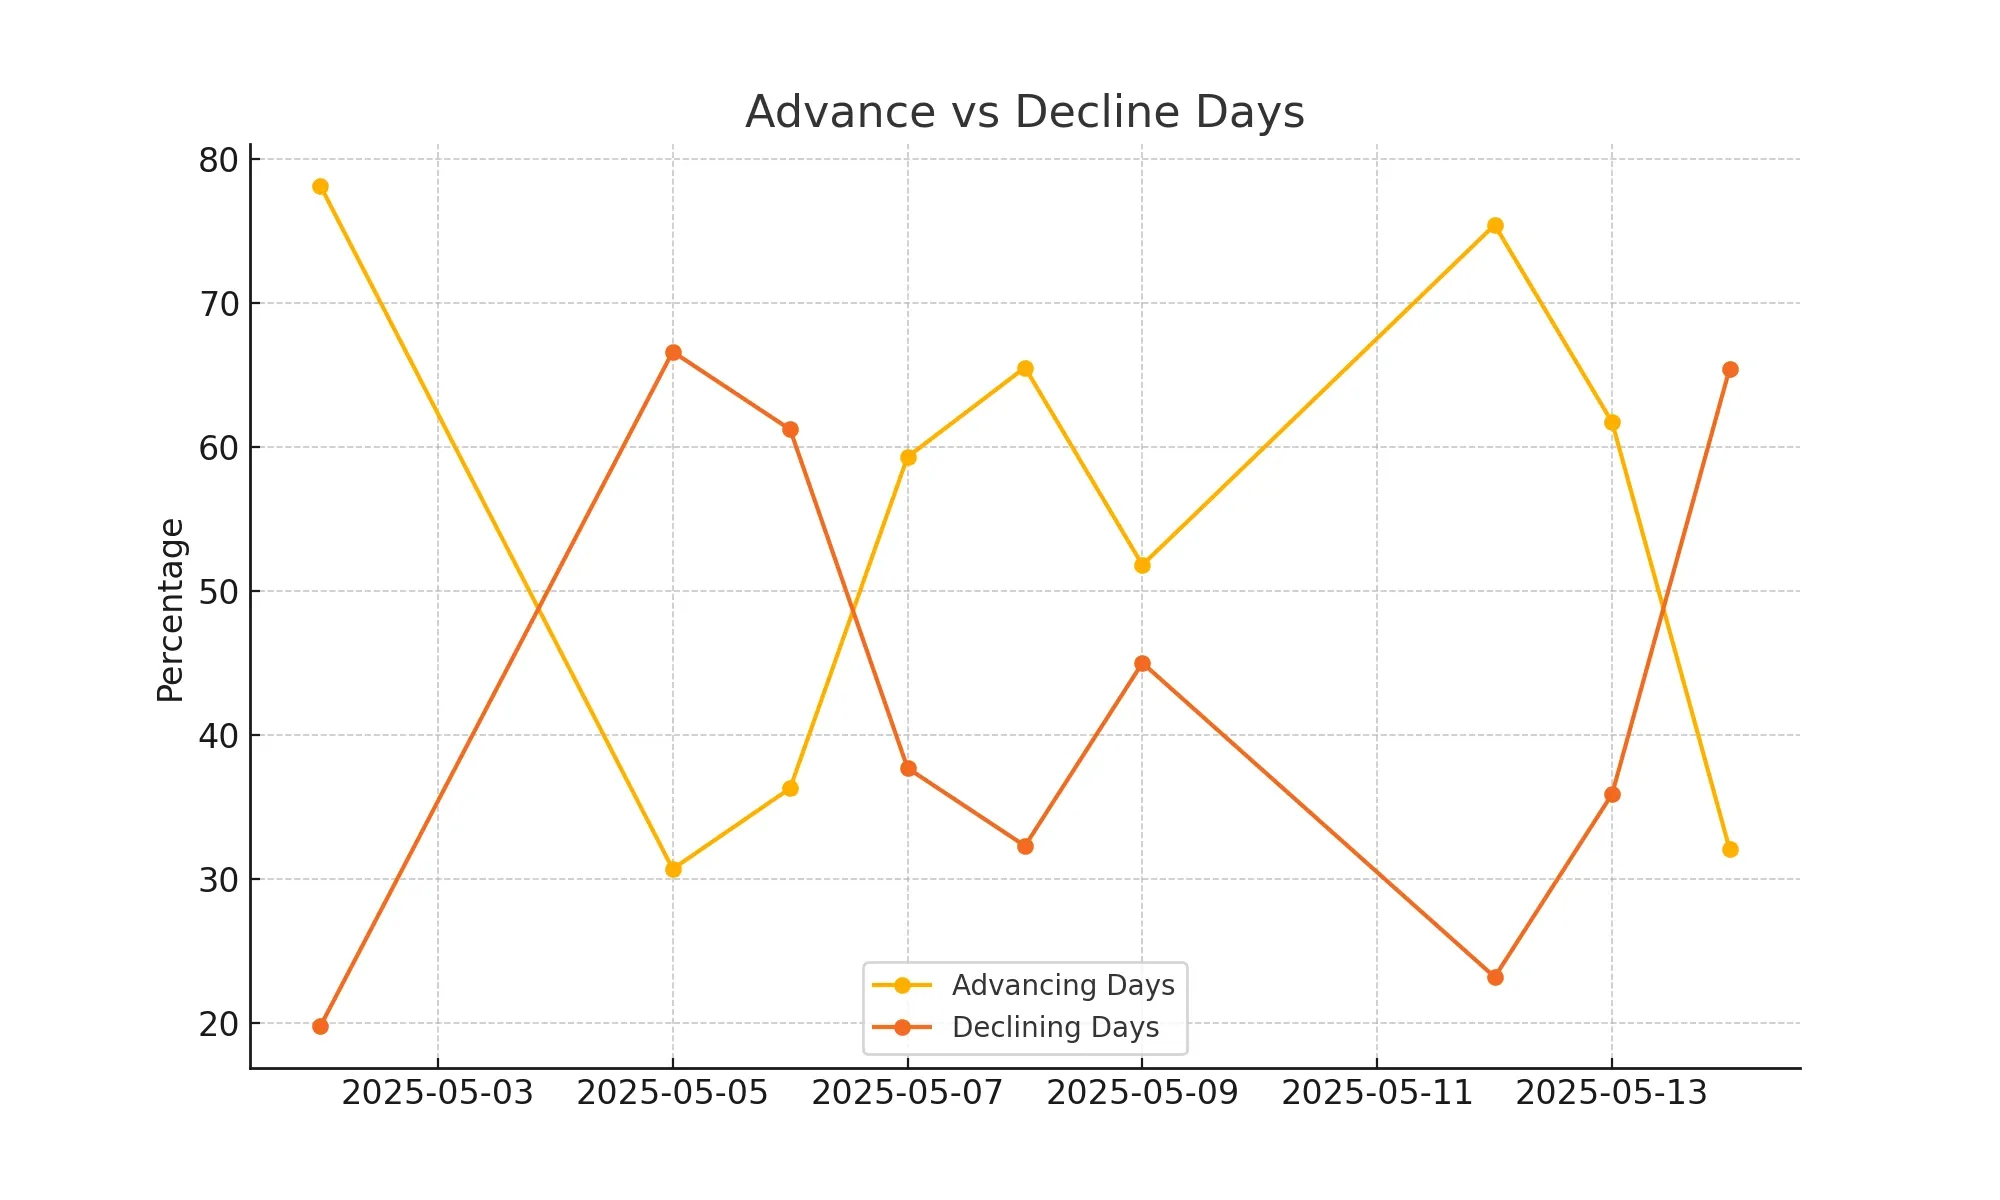
The market breadth data from May 2 through May 14, 2025, shows that bullish momentum, which was strong in early May, began to wane significantly by mid-month. A short-term pullback is evident as advancing breadth numbers declined sharply over the last two sessions.
Day-to-Day Breadth Breakdown
Strong Breadth Days
-
May 2, May 8, May 12 stand out with robust advancing day percentages (78.1%, 65.5%, and 75.4% respectively), supported by strong figures in advancing 4% days (8.2%, 10%, and 20.9%).
-
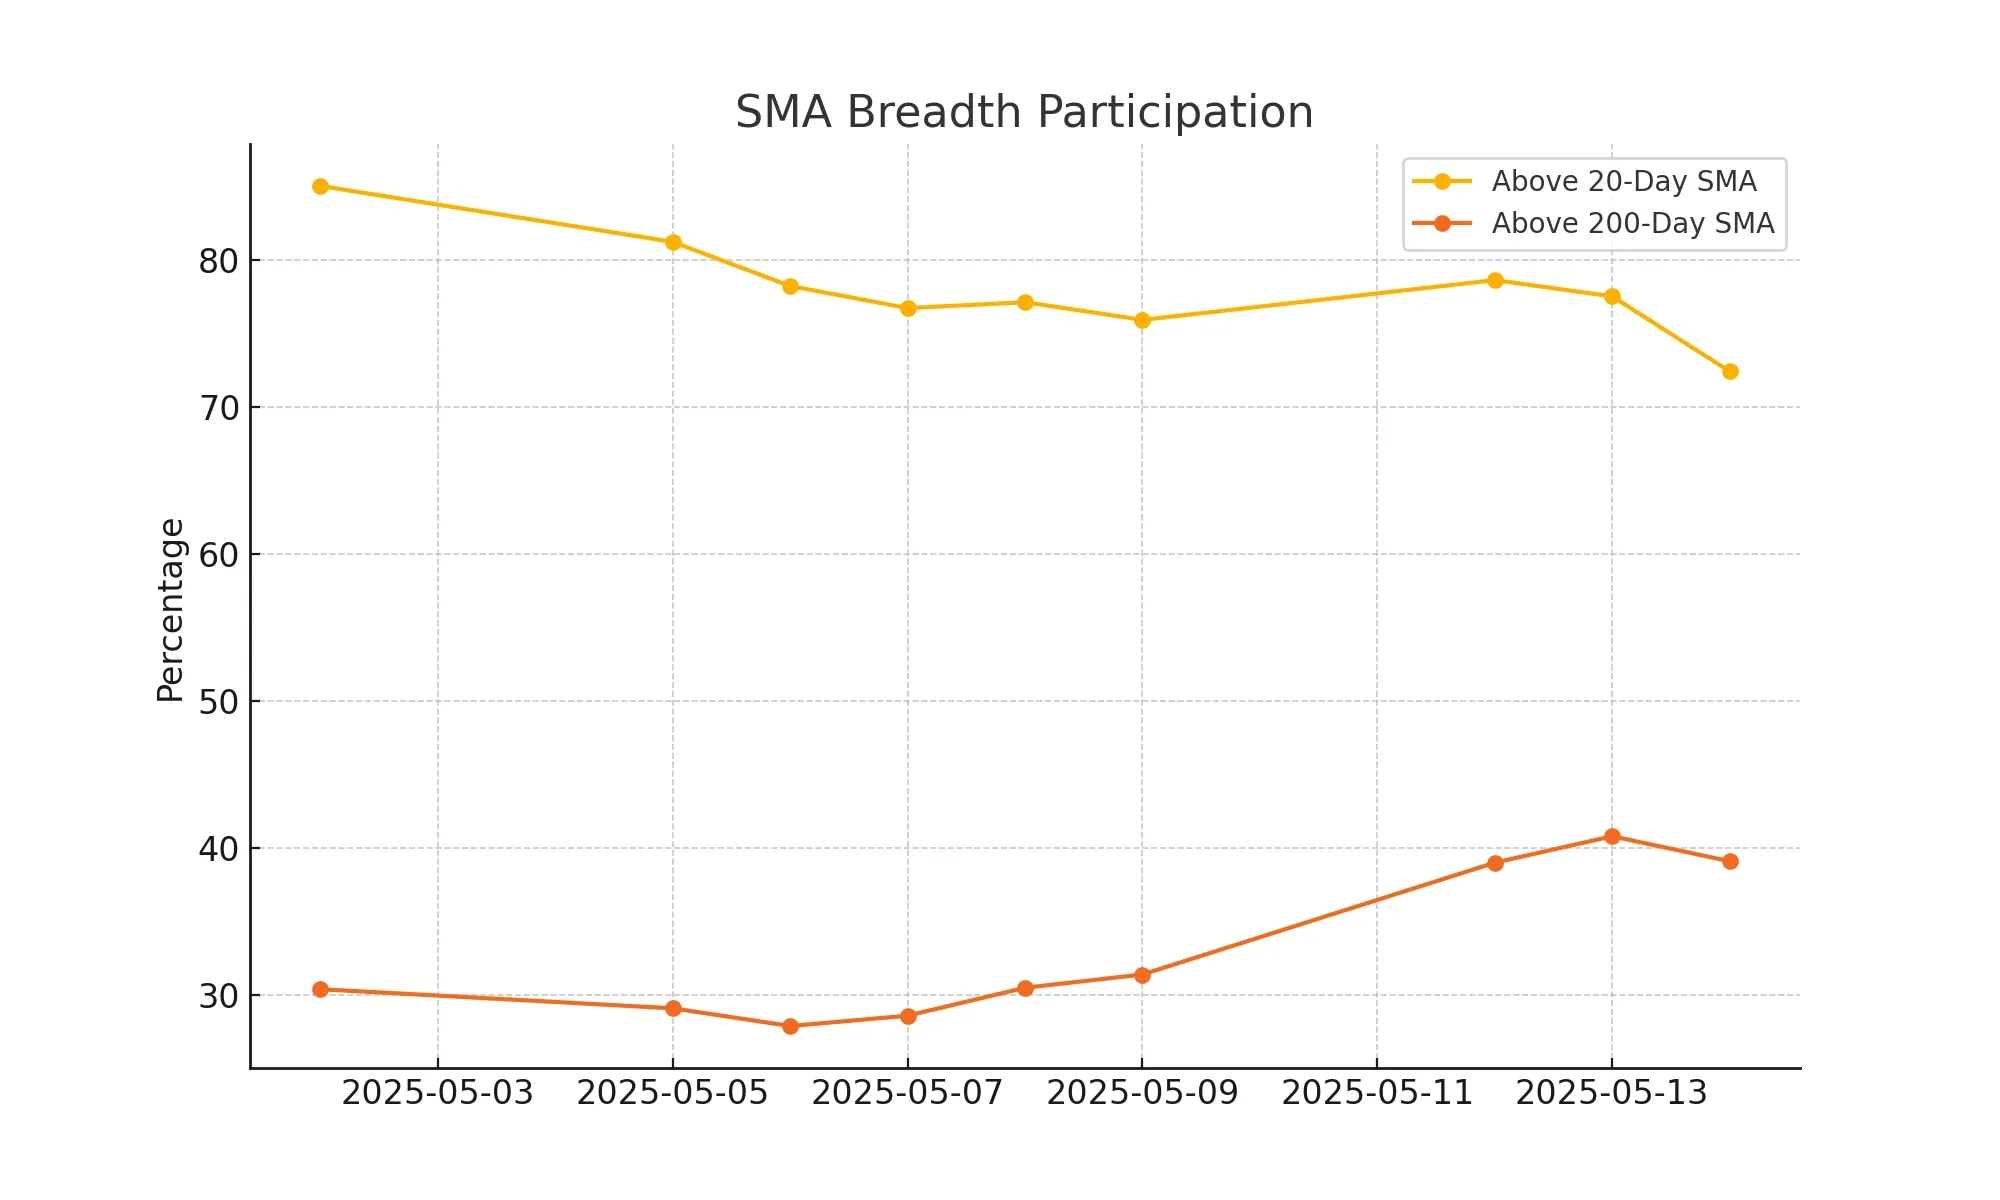
These days also saw high participation above key moving averages (SMA20+, SMA50+, etc.), with May 2 showing 85% of stocks above their 20-day MA — indicative of broad market strength.
Breadth Deterioration Emerging
-
May 13 and May 14 marked a clear shift in momentum:
-
May 14 had only 32.1% advancing stocks and a very low 2.6% hitting 4% gains.
-
65.4% of stocks declined, with nearly 71% of stocks having declined over the past 3 months.
-
Decliners significantly outnumbered advancers, and participation across all SMAs weakened.
Weekly and Monthly Trends
Strong Weekly Breadth (Earlier Period)
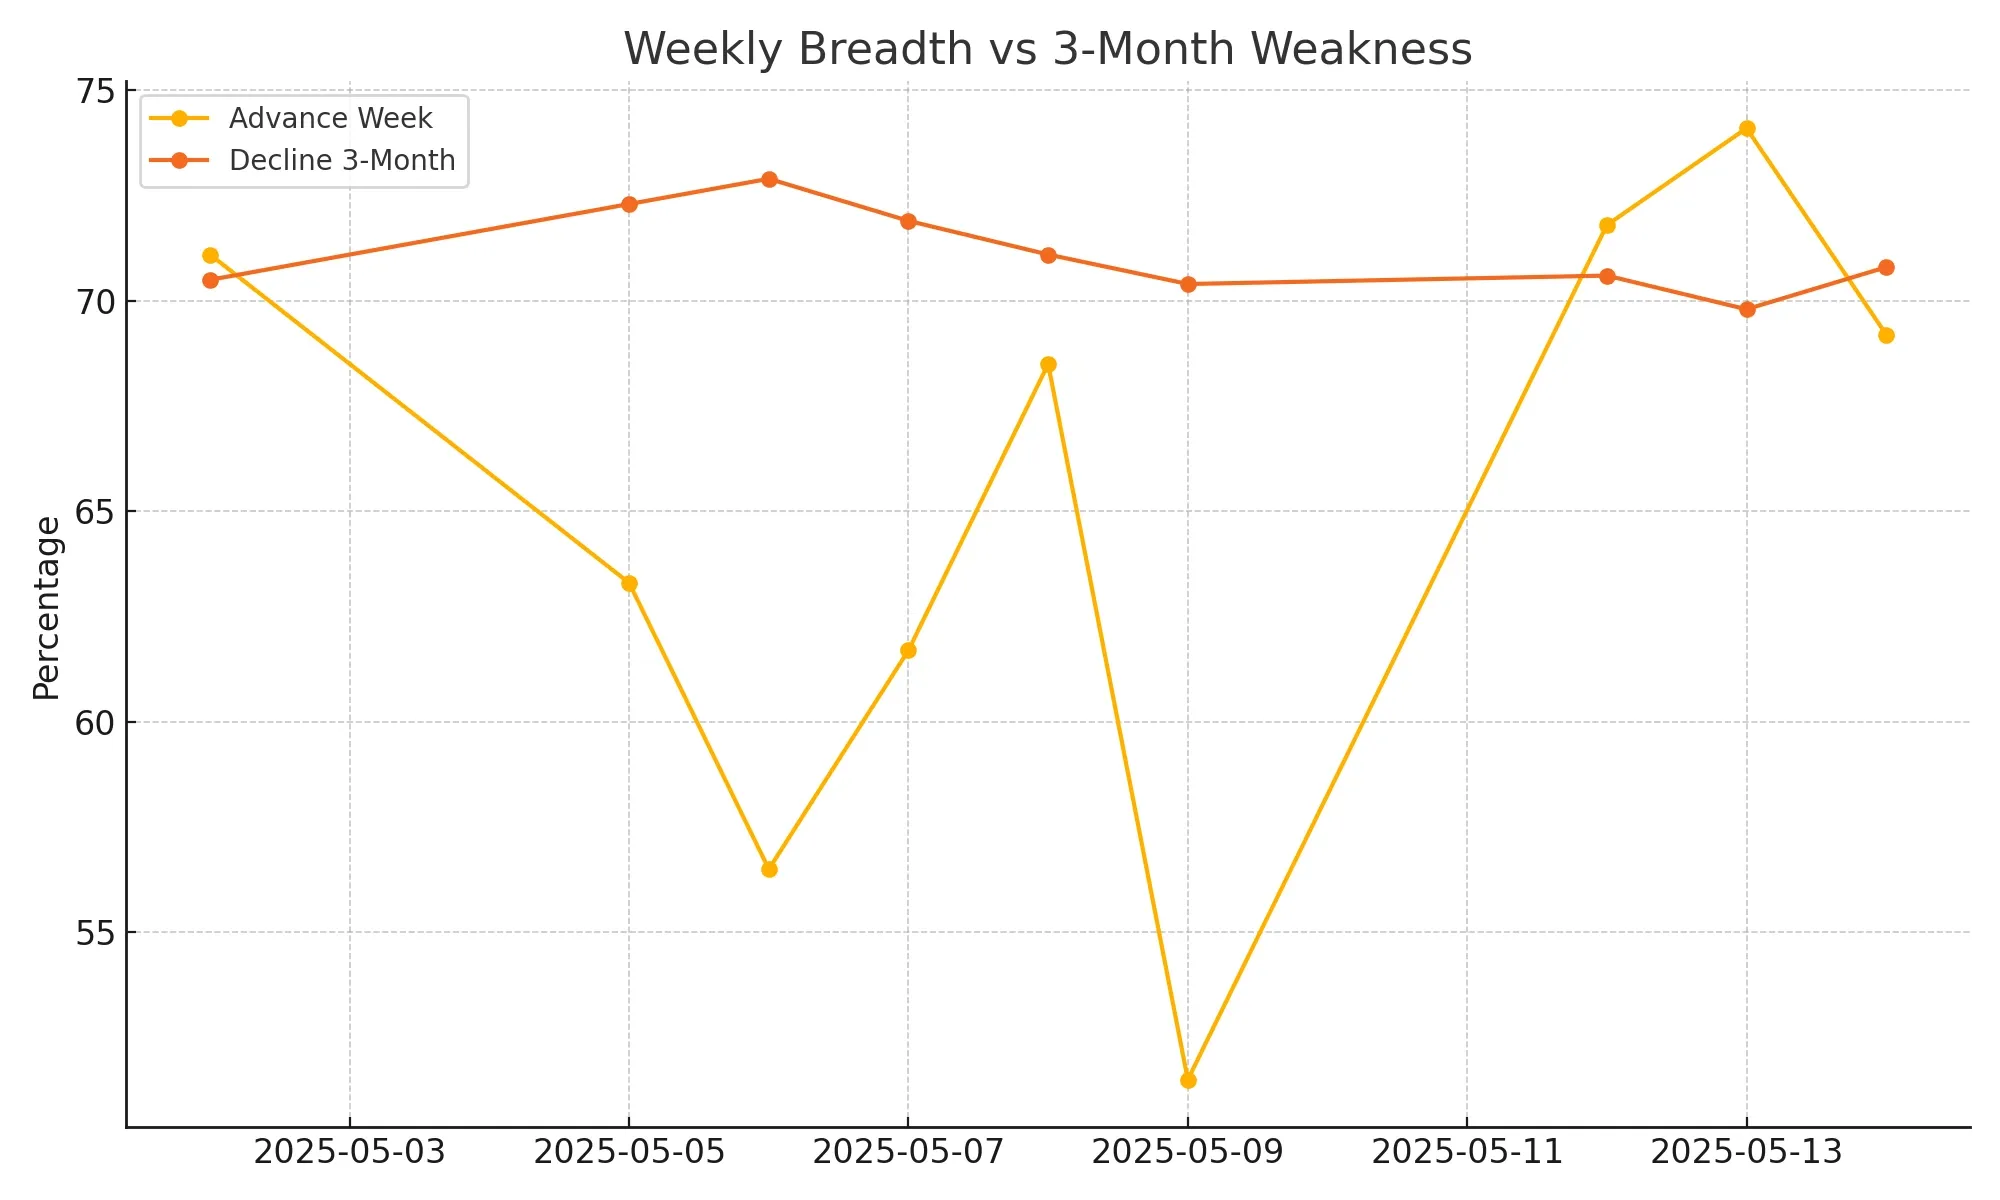
-Between May 2–9, the Advancing Week percentage remained above 50%, peaking at 71.8% on May 12.
- Monthly Advance Breadth held up well during this stretch, with peaks at 88.6% (May 7) and 86.4% (May 9) — signaling broad strength and follow-through from April’s gains.
Weekly Breadth Rolls Over
- On May 14, the weekly advance rate dipped to 69.2%, down from 74.1% on May 13 and 85.7% earlier, reflecting a slowing pace of upward movement.
Key Technical Levels and Breadth
SMA Participation:
-
The percentage of stocks above the 20-day SMA dropped from 85% (May 2) to 72.4% (May 14).
-
More notably, stocks above the 200-day SMA declined to 39.1% (May 14) from 30.4% (May 2), showing longer-term strength is lagging behind short-term rallies.
New Highs vs New Lows:
-
New Highs (NH) remain very low (around 1.7–3.2%), not confirming strength at index highs.
-
New Lows (NL) have stayed relatively muted but ticked up slightly on May 14 to 1.4%, suggesting slight internal deterioration.
Red Flags: 3-Month Breadth Weakness
-
Despite short-term rallies, Declining 3-Month Breadth remains high:
-
Around 70–73% of stocks are still in a 3-month decline.
- Only 3.4–4.0% of stocks advanced more than 25% in the last 3 months — indicating that leadership is narrow and the broader market is not participating in the upside with conviction.
Conclusion: Fragile Momentum Amid a Pullback
The market experienced broad strength earlier in May, with widespread participation and bullish signals across moving averages and advance/decline metrics.
By May 13–14, breadth deteriorated significantly, with more than 65% of stocks declining and key momentum metrics rolling over.
While some longer-term measures still reflect strength, the short-term internal weakness suggests the market could be due for further consolidation or a deeper pullback, unless leadership broadens again.
- Next to read: Market Monitor News May 15