
The Opening Range Breakout Strategy: Unlocking Profit Potential and Market Momentum
Are you a day or swing trader and looking for an effective and robust breakout strategy? Then maybe the Opening Range Breakout strategy is the thing for you!
As the name suggests, this strategy focuses on price breakouts within a specific range shortly after the market opens. The strategy is popular among active traders because it allows you to easily and objectively detect potential breakouts at an early stage.
In this article, we discuss what the strategy entails and exactly which steps are needed to be able to speak of an opening range breakout setup. We also cover some of the negative aspects and pitfalls that you as a trader need to be attentive to. This will help to significantly increase the win ratio when applying this strategy.
What is the Opening Range Breakout Strategy?
The Opening Range Breakout (ORB) strategy is a widely used trading approach that capitalizes on the price movement that occurs during the first minutes to the first hour after a market opens.
This strategy aims to identify key support and resistance levels based on the price range established during that initial period of trading. This also takes into account the highest and lowest prices of the previous trading day. Traders take positions only when the price breaks above the upper range (bullish breakout) or below the lower range (bearish breakout).
The ORB strategy uses the volatility and momentum present in the early hours of the market to capture potentially profitable trades.
The main sequential steps to successfully implement the Opening Range Breakout strategy:
Step 1: Identify the opening range
Start by identifying the opening range, which are the highest and lowest prices of an asset within the first X minutes after the market opens. X can vary based on your preferred frame. This can range from the first 15 minutes to the first hour.
Step 2: Determine support and resistance levels.
Once the opening range is established, determine the highest and lowest levels within that range. These levels serve as potential support and resistance points.
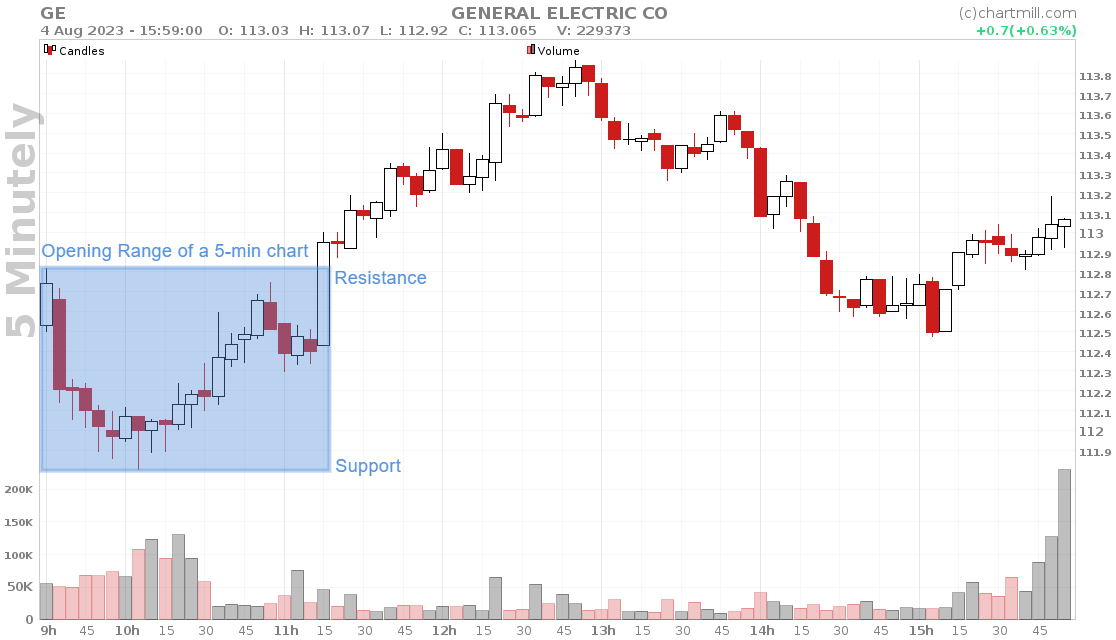
Step 3: Monitor Breakout Points
Monitor the price closely as it approaches the established support and resistance levels. A bullish breakout occurs when the price rises above the resistance level, while a bearish breakout occurs when the price falls below the support level.
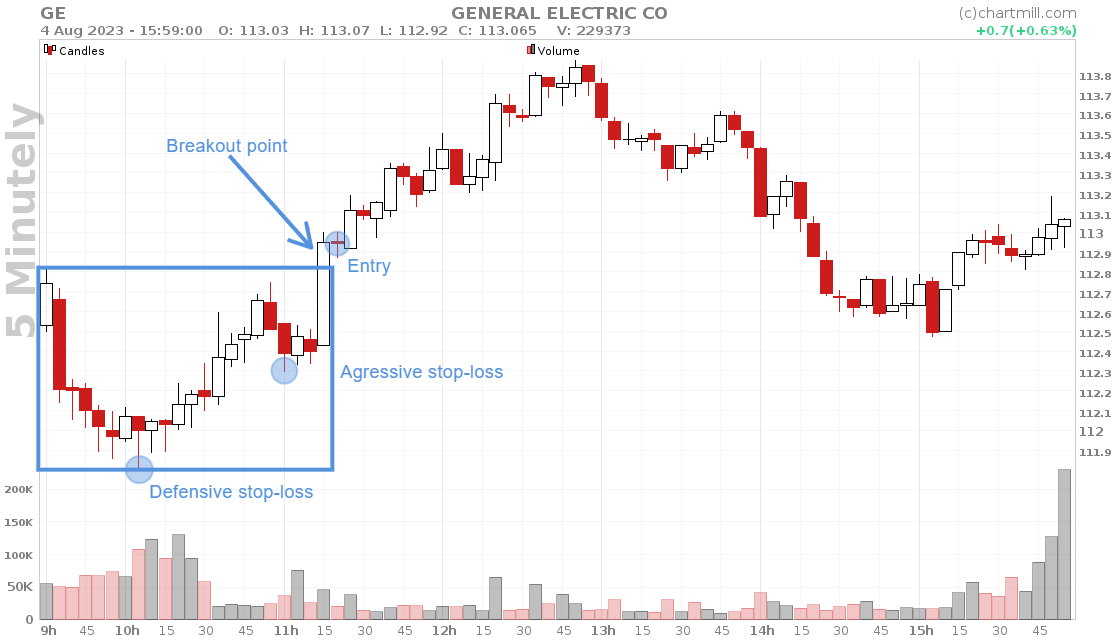
Step 4: Entry and stop-loss placement
For a bullish breakout, consider taking a long position slightly above the resistance level. Conversely, for a bearish breakout, you can take a short position slightly below the support level. Set a stop-loss to manage risk.
Step 5: Profit Target
Determine your target profit levels based on recent price movements and asset volatility, keeping in mind existing support and resistance levels.
Specific points of interest when using this strategy (important!).
Overall market and sector trend
The overall market trend is a crucial aspect to consider with this strategy. When it is bullish, the probability of a successful breakout trade in a specific setup increases.
Conversely, when the general market looks very negative the probability of a false breakout is higher.
If the market trend is pronounced bullish and you have several setups available, zoom in on the sector the stock is part of. After all, as with the overall market trend, the same is true at the sector level. if the sector to which the stock belongs is bullish, the probability of a successful breakout will be higher.
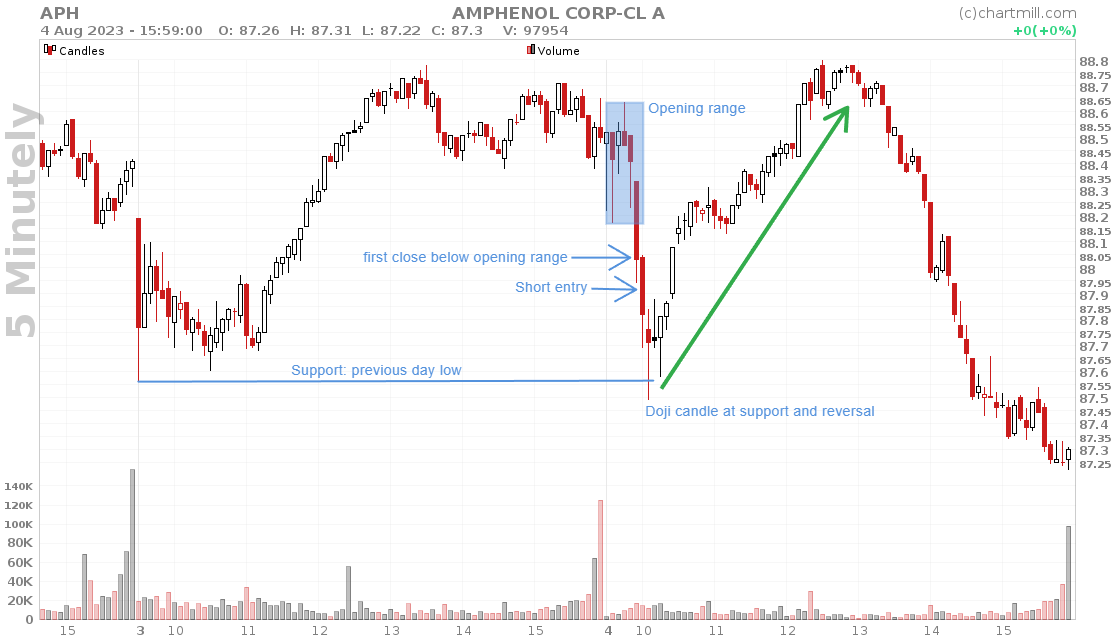
Support and Resistance Levels From the Previous Day
Perhaps the most common mistake made when using this strategy is to ignore the highest, lowest, or closing price level of the previous trading day when determining the opening range during the current trading day. However, these are essential for making a correct estimate.
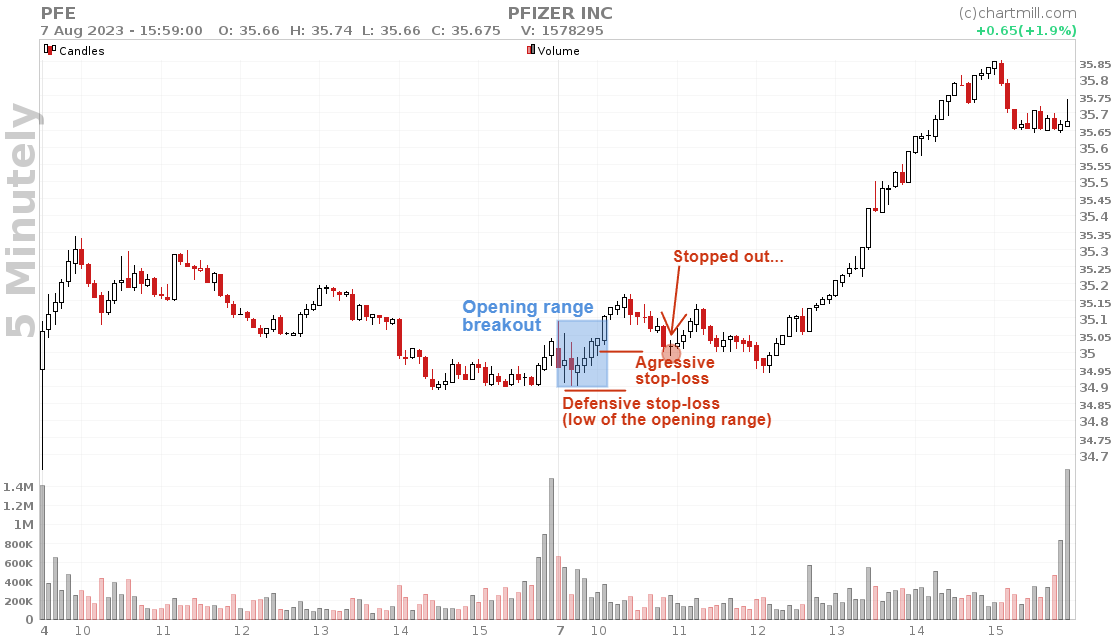
On the chart below, a shortsetup occurs after price breaches the opening range downward. Notice how the previous trading day's low acts as support while a doji candle forms simultaneously. These are two clear signals that the probability of a trend reversal is quite significant. Closing the position or placing the stop-loss at least breakeven is the appropriate option here. If you don't, you would have been stopped out later in the day anyway.
Defining the stop-loss
Good breakouts are characterized by an increase in volatility and volume. So you have to take that into account when setting the initial stop loss. A very short stop loss below the breakout candle is possible, but keep in mind that the probability of being stopped out increases a lot.
A bullish breakout in this strategy only expires when the bottom of the trading range is broken. This is therefore the most logical place to set the first stop-loss. If you find the distance between the highest and lowest price in that opening range too wide to determine your stop loss, it is better to simply ignore the setup.
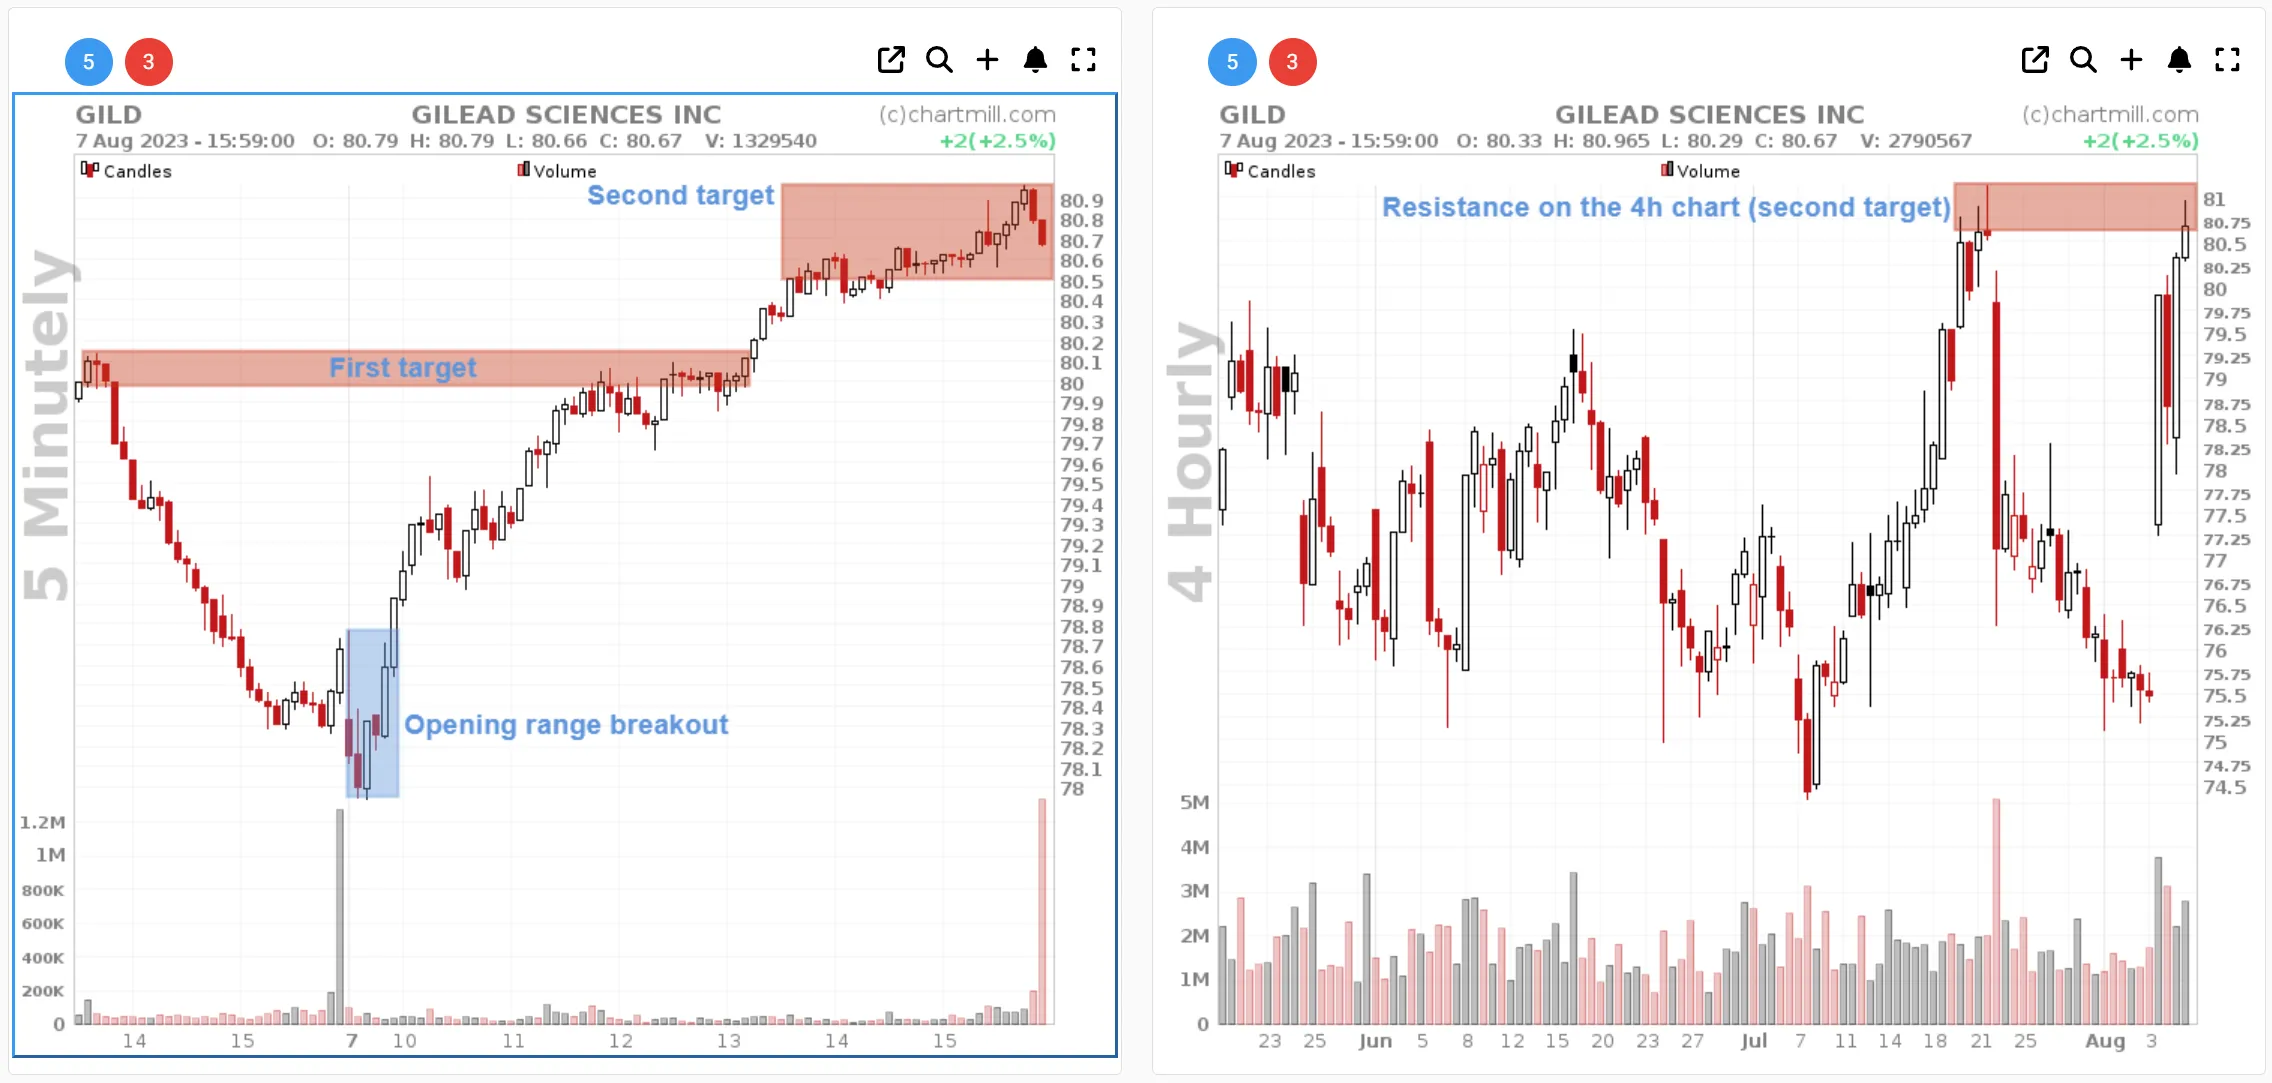
When to take a profit?
The most difficult part of any strategy. When to secure accumulated profits? The perfect way does not exist and much depends on the timeframe used and whether or not you wish to hold positions overnight. A short-term scalper will thus use a completely different exit strategy than a typical swing trader who is willing to hold positions for several days.
There are several ways to do so, but in this article, we will stick to the main distinction between a fixed target and a trailing stop loss. The difference between the two is that you either exit the market when a certain price target is reached or you continue to hold the position as long as your trailing stop-loss remains untouched.
The fixed target exit is widely used by scalpers and day traders. This type of trader will close their positions at the end of the trading day, no matter what, because they do not want to take any overnight risk. They also tend to use a more aggressive stop-loss and the predetermined price targets are relatively close.
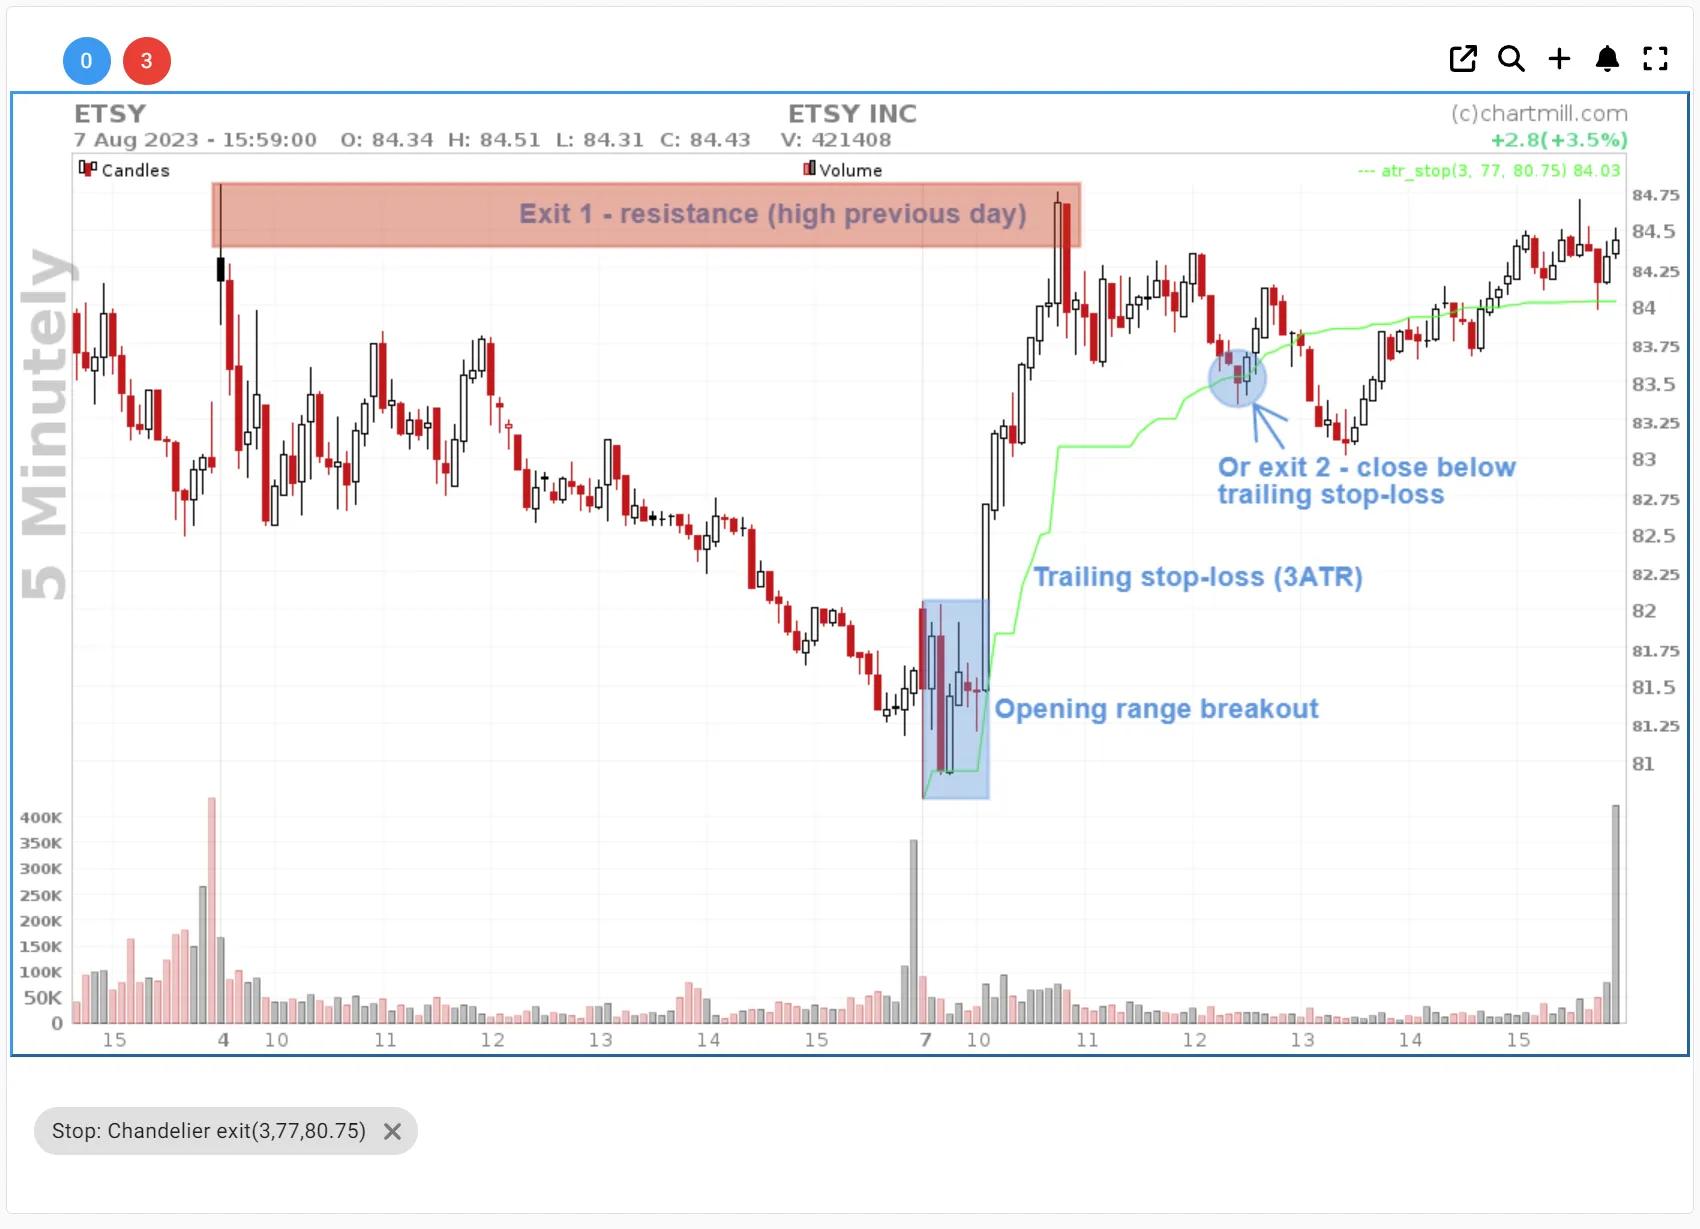
Trailing stop losses are the ideal tool for the swing trader. This is the way to go if you are speculating on a real trend move after the initial breakout. The main objective is to stay in position as long as possible and for which you are willing to hold positions overnight.
The long position as shown on the chart, is only liquidated once the closing price is below the trailing stop-loss. Such a trailing stop-loss exists in several forms. For example, the chart below uses a Stop-loss based on a fixed ATR (Average True Range) distance.
Keep Up With the News
A sharp increase in volatility plays an important role in this type of setup. It is good to know what causes it. This can be purely technical, for example when an important resistance level on a long-term timeframe is broken but if you notice that the increase is extreme there will most likely be another specific cause.
This could be important news about the stock itself, for example, quarterly results that are better than expected, a better outlook that is being previewed, or an analyst who has revised his price target for the stock upward.
If you don't immediately find something specific to the stock, check out its direct competitors. If positive news is announced for one of these stocks, it can have an impact on the entire sector and thus indirectly on the stock you are following.
FAQ
What is the one-hour-opening-range breakout?
The one-hour opening range breakout strategy is a variation of the traditional Opening Range Breakout (ORB) strategy that extends the time frame for defining the opening range. Instead of focusing solely on the first few minutes of trading, this strategy considers the price range established within the first hour of a trading session.
An opening range based on such a longer period (and thus more data points) will help filter out more short-term price fluctuations and thus confirm the validity of a breakout. As a result, the number of false breakouts will be lower. The downside, however, is that you will miss occasionally strong price movements that occur in that first hour.
How good is the opening range breakout strategy?
The profitability of the opening range breakout strategy, like any trading strategy, is influenced by several factors including market conditions, risk management, trader experience, and individual trading preferences.
These factors are at least as important as the strategy itself if you want to be structurally profitable in the long run.
And while this strategy certainly has the potential to be profitable, it is important to note that no trading strategy by itself guarantees profits. There will always be winning trades and losing trades. Successful trading involves managing losses and maximizing profits in the long run.
Want To Know More About 'Breakout Trading'? Be Sure To Check These Additional Articles and Videos!
The Breakout Trading Strategy
Breakout trading is undoubtedly one of the most popular forms of trading for those who are mainly active as day or swing traders. Read more...
How to Screen for Breakout Stocks: A Comprehensive Guide
In this article, by using the ChartMill stock screener, we demonstrate how to screen for stocks that have just broken out above a specific price point or are close to it. Read more...
When To Enter A Breakout Trade? 4 Different Ways To Master The Entry
Trading breakouts is an efficient way to jump on board when a new major trend emerges. The best breakouts occur when the price breaks out above a very clear price resistance level that is watched by a lot of market participants. Read more...
How to use ChartMill? Part 4 - A complete ChartMill workflow (video)
In this video, I'll go through my entire ChartMill workflow to obtain a list of stocks that have just broken out above their existing high and trading range. These are ideal Breakout Setups to trade.