Breakout Stock Screener: How to Find Breakout Stocks Step by Step
Using a breakout stock screener is one of the most effective ways to identify stocks that are breaking above key resistance levels. Trading breakouts is a proven strategy where the price rises beyond a well-defined resistance zone, often triggering strong momentum and attracting more buyers.
If enough investors react to such a price breakout, it leads to more volatility and momentum, which in itself can be the beginning of an even larger and highly profitable price movement.
In this article, we’ll demonstrate how to use the ChartMill breakout stock screener to find stocks that have just broken out or are approaching a critical resistance level.
What Exactly Are Breakout Stocks?
A breakout occurs when the price of a stock rises above a previously valid resistance level. The stronger that resistance level has worked in the past, the more traders will perceive the breakout as important and try to act on it.
The fact that specific historical price levels do indeed react as "support" and "resistance" has much to do with a well-known sociological concept known as the "Self fulfilling prophecy". A prediction that comes true at least in part as a result of a person or group's belief or expectation that that prediction would come true.
Some more info on the actual Breakout Strategy can be found here.
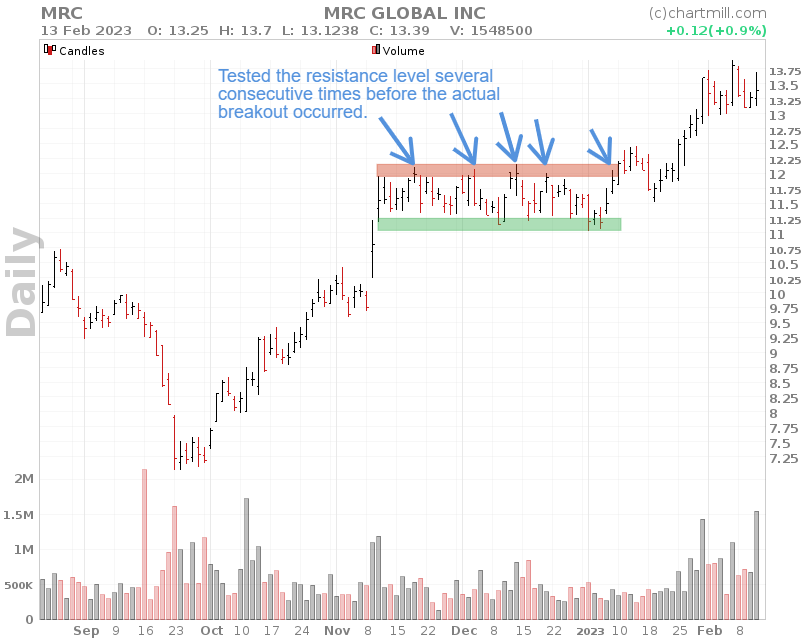
Check out the chart of MRC Global's stock below. The price tested the existing resistance zone four consecutive times between Nov. 10 and Jan. 9, 2022 before the effective breakout occurred.
A breakout strategy is most effective when overall market conditions are bullish and sufficient volatility is present. Breakout patterns are popular among investors because they can be spotted on any type of price chart (individual stocks, ETFs, Futures, Forex,...) and at any time frame.
How To Find Decent Breakout Setups?
The fastest and most efficient way to find breakout setups is to use a stock screener such as ChartMill. The many filtering options allow you to be very specific.
Screening can be done in two ways. Either you look for stocks that have just broken out above resistance (confirmed breakouts), or you select stocks that are about to break out (breakout setups).
1. Determine the overall market and sector/industry trend
As already mentioned above, a bullish breakout strategy works best when financial markets are generally doing well. Determining the general market trend is most easily done by keeping an eye on the major stock market indices such as the S&P 500, Nasdaq and the Dow Jones.
When the trend is extremely negative, the number of breakout setups will be lower anyway. Moreover, the probability of false breakouts is noticeably higher because of the negative sentiment.
Also consider the performance of the sector or industry to which the stock belongs. After all, it could be that the breakout is due to a very specific event while the sector in general is performing weakly. If the sector is bullish, chances are higher that the stock will continue to rise after the initial breakout.
Overview of sector and industry performance (US, EU and CA).
Definitely try to take the overall and sector trend into account, it will certainly improve your success rate. Once you are convinced that the market conditions are in favor of breakout setups, it’s time to do some hunting!
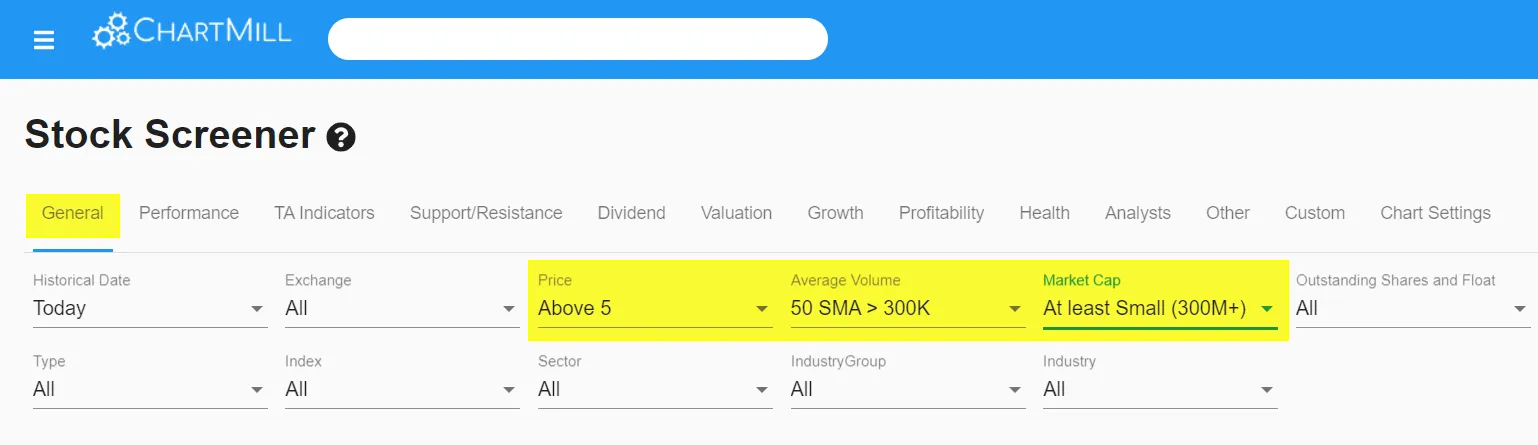
2. Set Up Some Basic Filters
GENERAL | Price above $5
Minimum $5 to avoid penny stocks. Many of them are very illiquid which also results in high bid-ask spreads (the gap between the bid and the ask prices of a security or asset, like a stock, bond, or commodity). Moreover, because of their (extremely) low price, penny stocks are the favorite toy of pump-and-dump scammers.
GENERAL | Average Volume (50 SMA > 300K)
Sufficient volume is one of the most important parameters when looking for breakout candidates. The higher the volume the better, it ensures that shares can be bought and sold without any problems. The higher the volume the smaller the bid-ask spread.
GENERAL | Market Cap (At Least Small 300M+)
The market capitalization is set to "at least small”. This retains only companies with a market capitalization of at least 300 million.
If desired, you can also specify the region or define a minimum range for the ‘Outstanding Shares and Float’. However, keep in mind that this is a basic screen. So don't be too strict when setting the filters. Otherwise, there is a chance that you will miss some great setups.
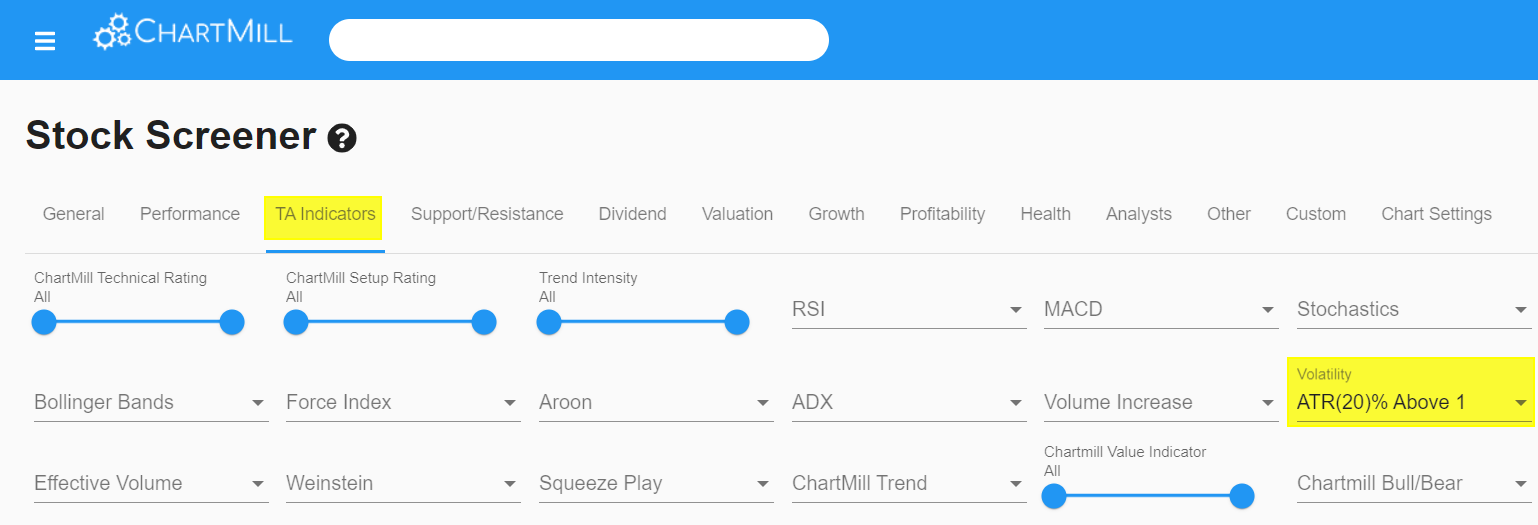
TA INDICATORS | Volatility (ATR(20)% Above 1)
This volatility filter ensures that we avoid stocks that barely move.
3. Select The Specific Breakout Filters For The “Confirmed Breakouts” (after the most recent trading day)
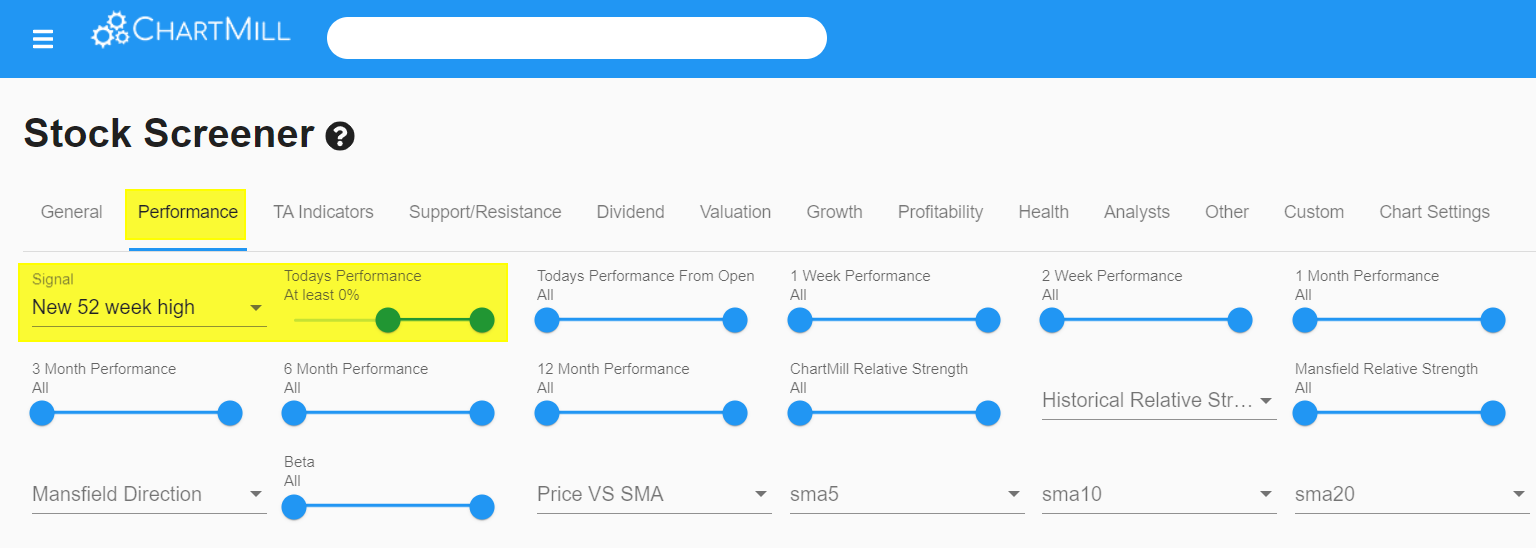
PERFORMANCE | Signal (New 52 Week High or New 20 Day High or New 10 Day High)
These filters need little explanation. ChartMill will look for stocks whose price has closed above one of the selected price points.
PERFORMANCE | Today’s Performance (At Least 0%)
We only want to keep stocks whose closing price is higher than the previous trading day. By default we set this filter to minimum 0% but you can easily change this yourself in the performance menu of the stock screener.
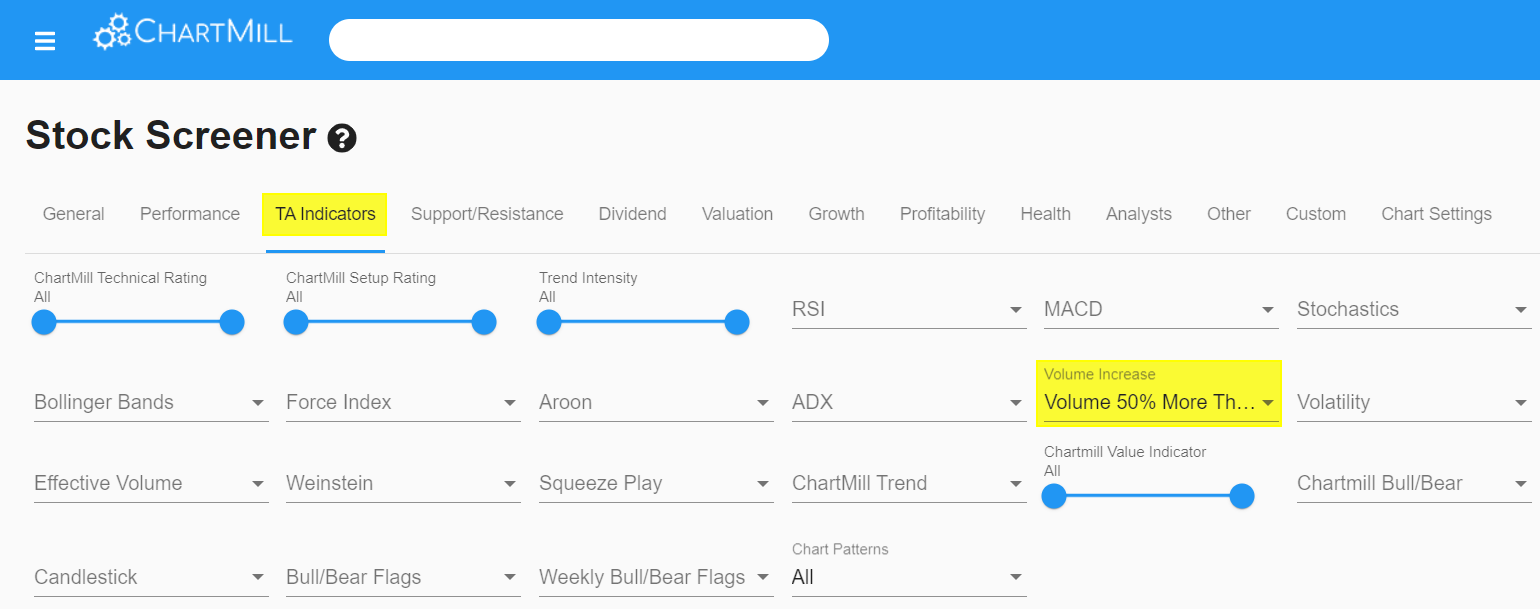
TA INDICATORS | Volume Increase (Volume 50% More Than Previous Volume)
The volume increase filter is one of the most important filters when searching for confirmed breakout stocks. A breakout accompanied by sharply increased volume is clear evidence that buyers have noticed the breakout and are taking positions. Momentum increases and with it the likelihood of further price appreciation.
This filter requires the volume to be at least 50% higher than the previous trading day. If you still have a lot of candidates left, you can gradually increase the filter to 100% more to even 300% more.
Please keep in mind that both the number and quality of setups are greatly affected by market conditions. Sometimes there will be a lot of results, on other days barely or even none....
It is best to apply the filters AMC (after market close) and BMO (before market open). After all, the final results are based on EOD prices.
Some Screening Variants
- Basic Settings + Price Performance >=0% + new 52W High + Volume Increase 100%
- Basic Settings + Price Performance >=2% + new 10D High + Volume Increase 50%
- Basic Settings + Price Performance >=5% + new 20D High + Volume Increase > previous day
- Basic Settings (only US) + Price Performance >=1% + new 10D High + Volume Increase 200%
4. OR Select The Specific Filters For The “Breakout Setups” (stocks that could be on the verge of breaking out)
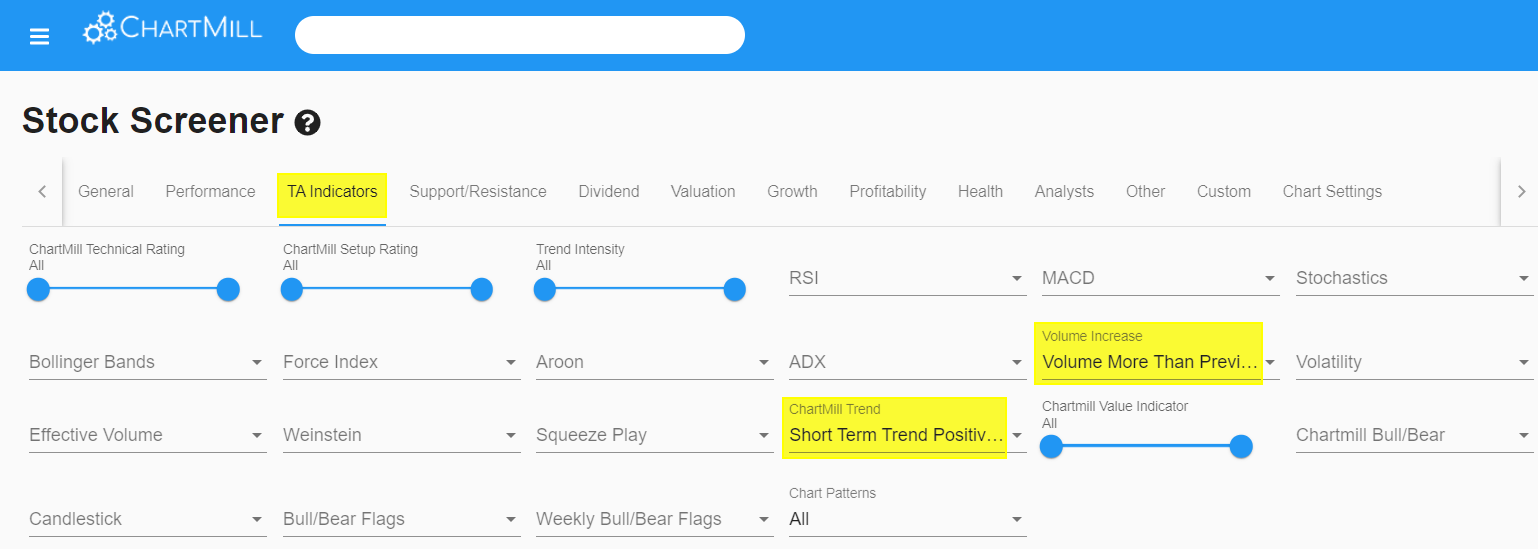
TA INDICATORS | ChartMill Trend (Short Term Trend Positive + Long Term Trend Positive)
Both of these filters ensure that only stocks with a clear upward trend are selected.
TA INDICATORS | Volume Increase >= Volume More Than Previous Volume
Only stocks for which trading volume was higher than the previous trading day.
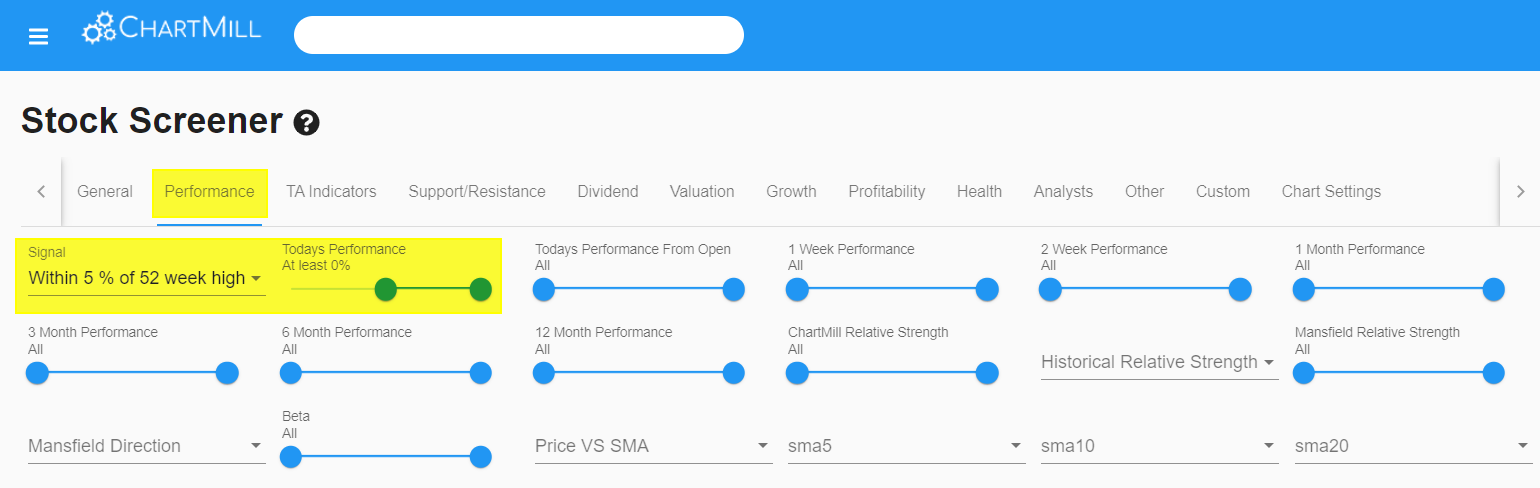
PERFORMANCE | Signal (Within 5% Of 52 Week High or Within 3% Of 20 Day High or Within 3% Of 10 Day High)
These signal filters are obvious. When you open the dropdown menu under the signal tab you will find that there are many other options. In addition, custom filters allow you to set the percentages to your own liking.
PERFORMANCE | Today’s Performance (At Least 0%)
As with the specific filter settings for the ‘confirmed breakouts’, we only want to hold stocks whose closing price is higher than the previous trading day.
SUPPORT/RESISTANCE | Consolidated Resistance CR1 (Current 1% From CR1 Start + CR1 Strength > 4)
Our stock screening software is able to recognize support and resistance levels autonomously to a certain extent. In this case, we use the consolidated resistance levels to find stocks that are near a horizontal resistance zone.
As you can see in the image below, the support/resistance menu contains many more options. However, it would take us too far to go into detail here in this article.
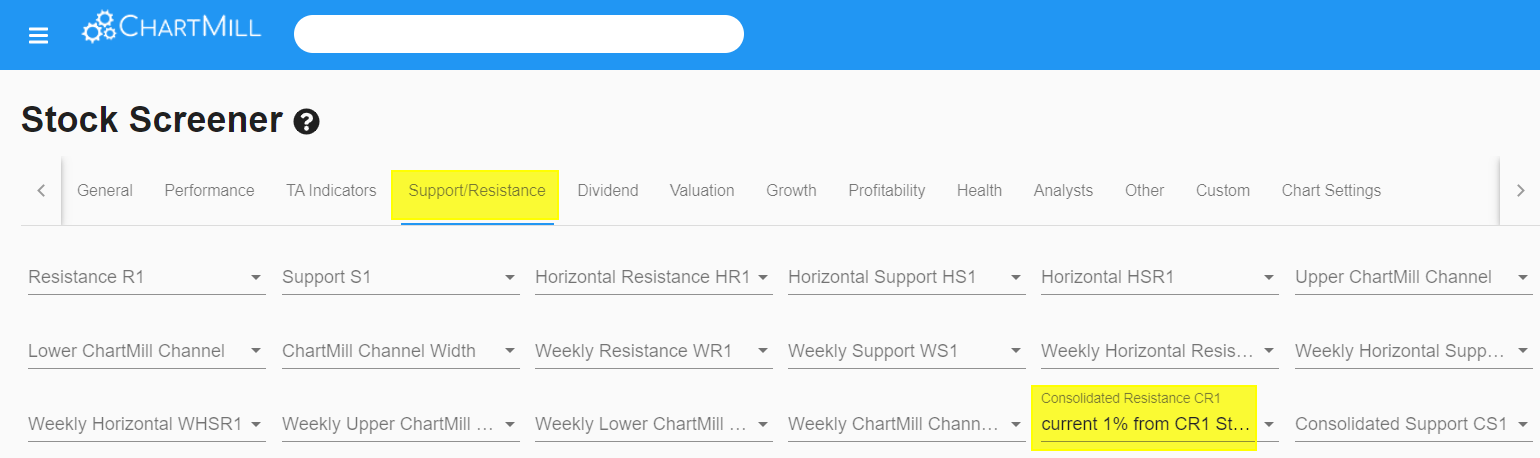
To make the consolidated zones visible on the chart, add them as an overlay via the chart settings menu in the stock screener.
Some Screening Variants
5. Manual Filtering
With the filters used so far, the list of possible setups should already be quite limited. Further selection is done manually and you should pay attention to the following things:
- The easier you can recognize the sideways range from which the price breaks out (or is about to break out), the better.
- As for the confirmed breakouts, the breakout itself must be accompanied by significantly high buying volume (which is why we specifically used the 'volume increase' filter). But also keep a close eye on the volume just before the breakout. If there was already a notable rise before the breakout, that is an indication that market participants have taken positions in advance, anticipating the actual breakout.
- Take a good look at the closing price. A close on the high of day is the most ideal scenario. This is because it is the first confirmation of a successful breakout.
- For breakout setups, the best opportunities occur for stocks that form a small narrow mini-range of a few days within the existing trading range. This is - in addition to an increase in buying volume - an indication that market participants are indeed taking into account an imminent breakout. The tension is being built up, so to speak. The number of candidates depends largely on current market conditions. With exactly the same filters, sometimes you will have dozens of setups at once and on other days, none.
In addition, be rigorous in your manual selection. The best setups are usually the ones you immediately recognize as such.
Breakout Stock Screener Examples
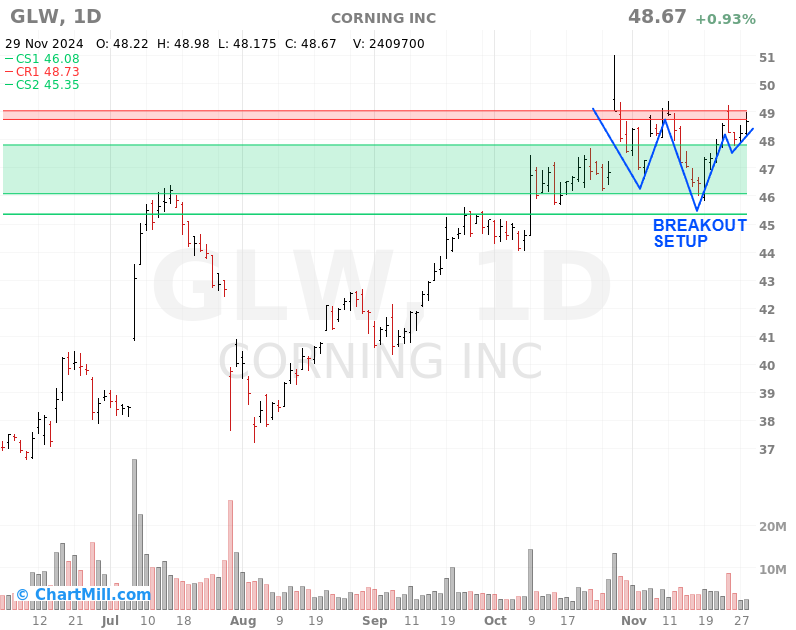
Corning Inc | Price close to resistance
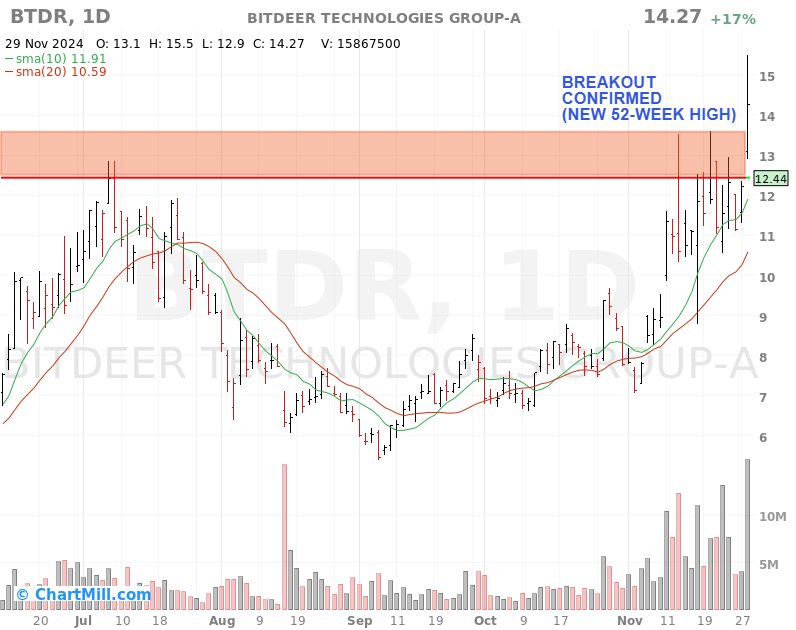
Bitdeer Techologies | Price closed above 52 week high
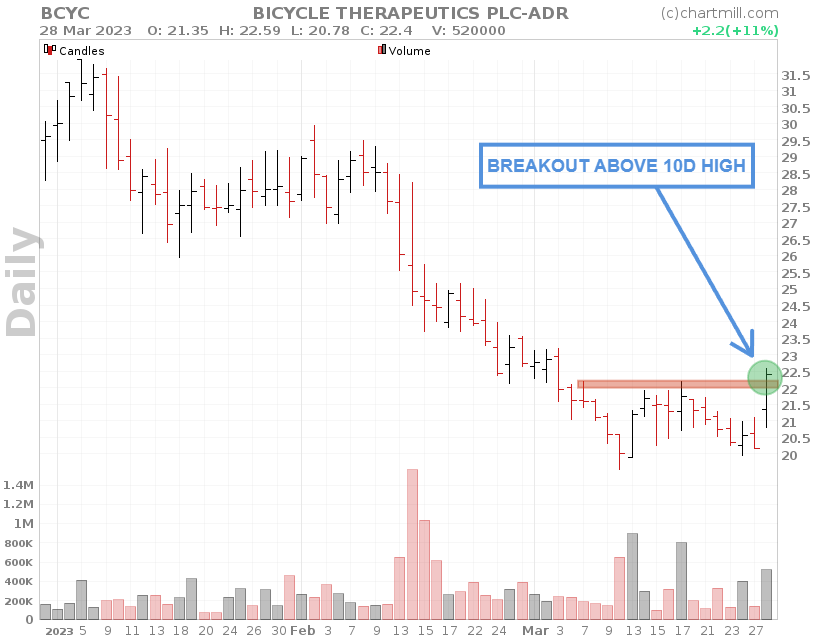
Bicycle Therapeutics | Price closed above 10 day high
Key Takeaways
- The most efficient way to identify breakouts is to use a technical stock screener such as ChartMill. This allows you to scan a lot of stocks simultaneously for potential setups.
- The best setups occur when the price breaks out (or is about to break out) of a sideways trading range, called a consolidation zone.
- Strong buying volume during and before the actual breakout is of utmost importance; it confirms that buyers are in control and are anticipating an actual breakout.
- Always consider the overall market and sector trend. Bullish breakouts have the highest success rate when the market as a whole is bullish.
It doesn't stop at screening, of course. You'll also have to decide exactly when to buy, where to place your stop loss and where to take profits. Read all about it in this article 'When to enter a breakout trade? 4 Different Ways To Master The Entry'
You May Also Be Interested In These Related Articles And Videos
The Breakout Trading Strategy
Breakout trading is undoubtedly one of the most popular forms of trading for those who are mainly active as day or swing traders. Read more...
When To Enter A Breakout Trade? 4 Different Ways To Master The Entry
Trading breakouts is an efficient way to jump on board when a new major trend emerges. The best breakouts occur when the price breaks out above a very clear price resistance level that is watched by a lot of market participants. Read more...
The Opening Range Breakout Strategy: Unlocking Profit Potential and Market Momentum
In this article, we discuss what the strategy entails and exactly which steps are needed to be able to speak of an opening range breakout setup. Read more...
How to use ChartMill? Part 4 - A complete ChartMill workflow (video)
In this video, I'll go through my entire ChartMill workflow to obtain a list of stocks that have just broken out above their existing high and trading range. These are ideal Breakout Setups to trade.