Swing Trading Momentum Screen: Breakout Setups
Introduction
In this article I go over a basic swing trading momentum screen based purely on technical filters. This is one of the screen filters used for our daily "trading ideas" which are published on ourInstagram and/or Facebook before the market opens. All of the retained setups are generated by running a number of basic screens in ChartMill on a daily basis. After this first selection, a further manual screening follows after which one or more setups are selected as "trading ideas".
We differentiate between 'Breakout Setups' and 'Retracement Setups', depending on the market circumstances, but in this article we will only concentrate on the Breakout Setups. The retracement setups will be dealt with in a separate article.
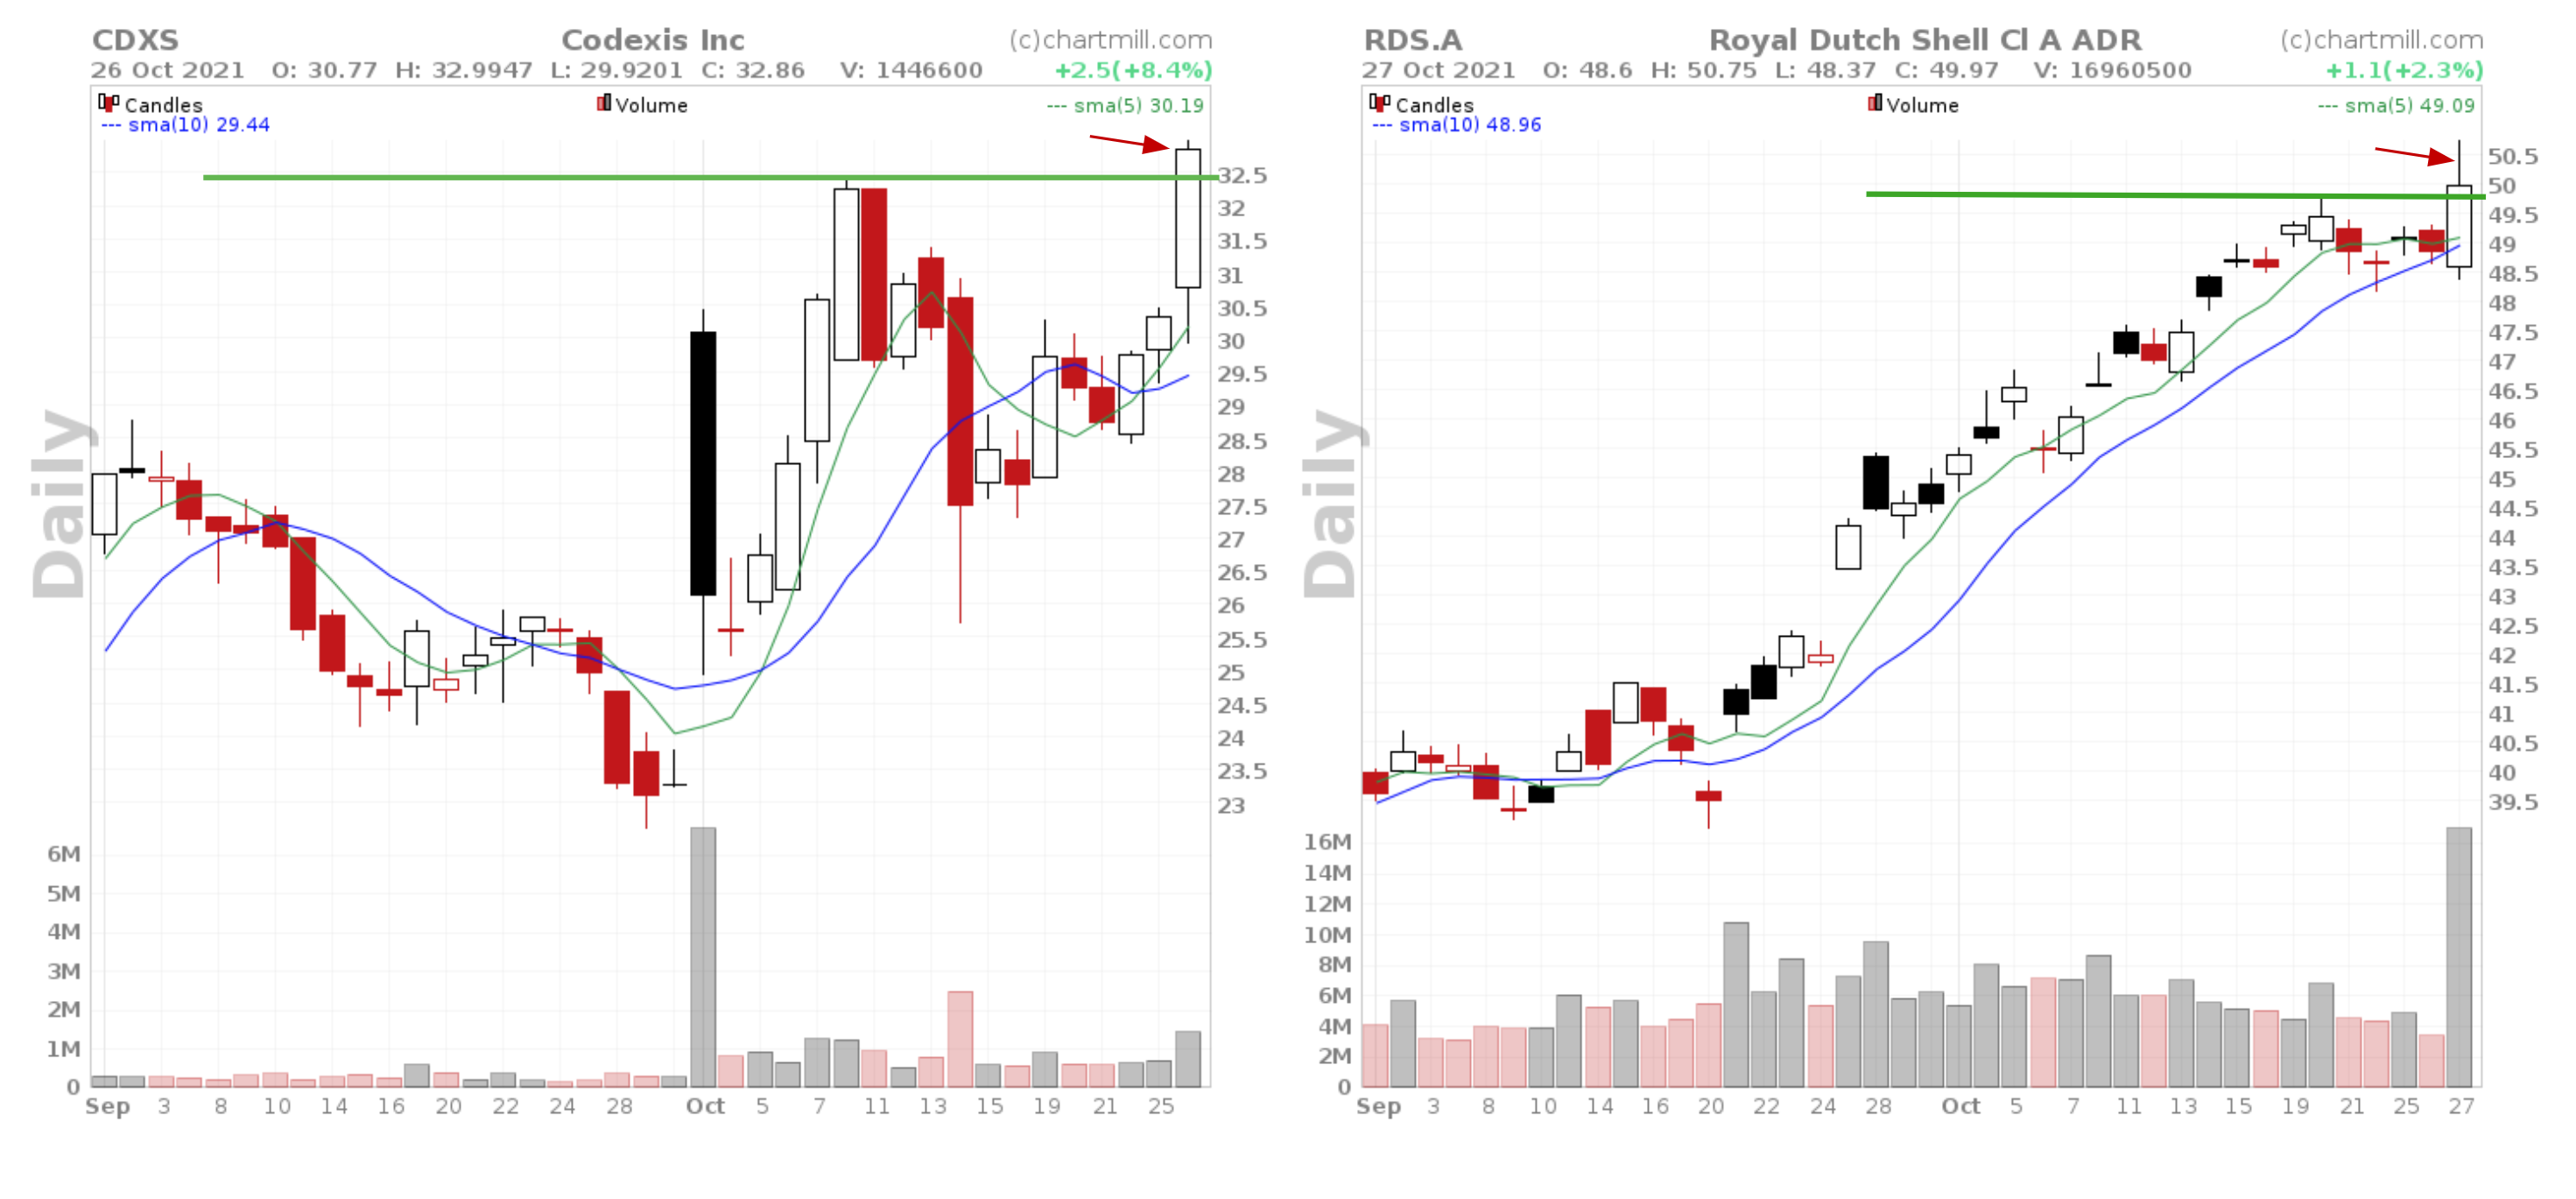
Some examples of typical breakout setups
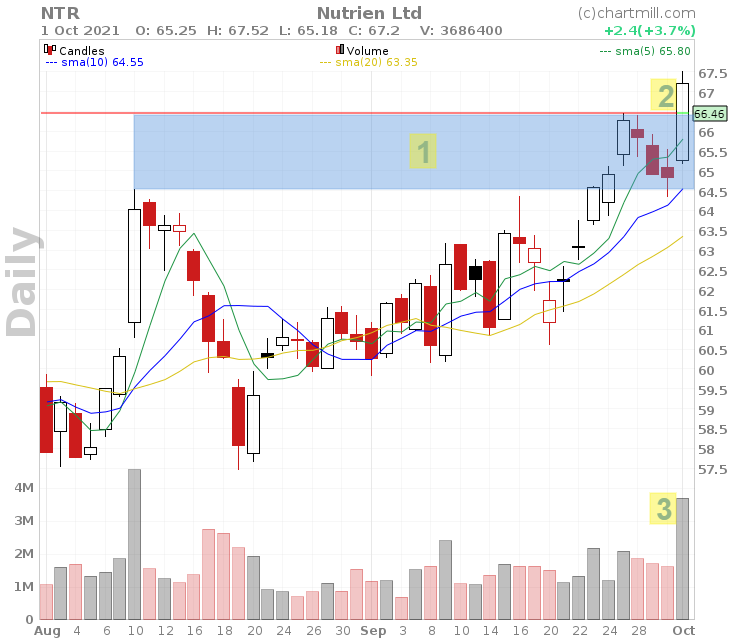
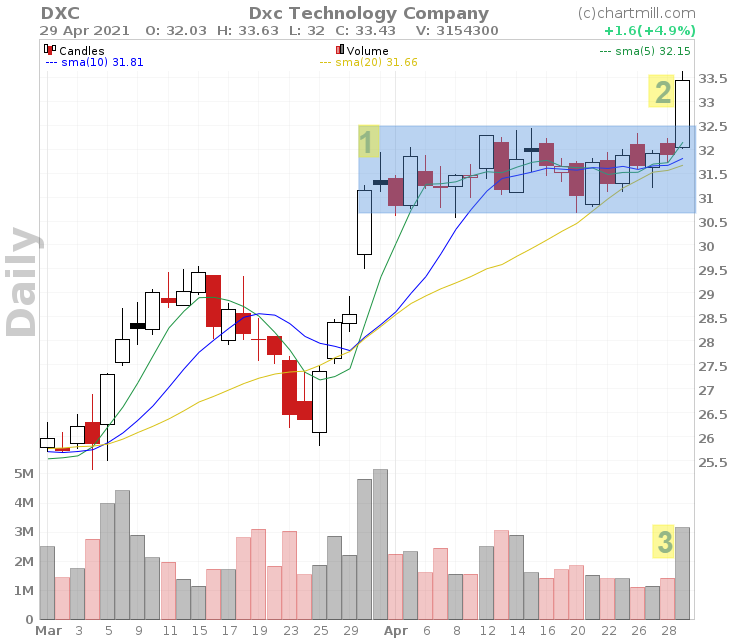
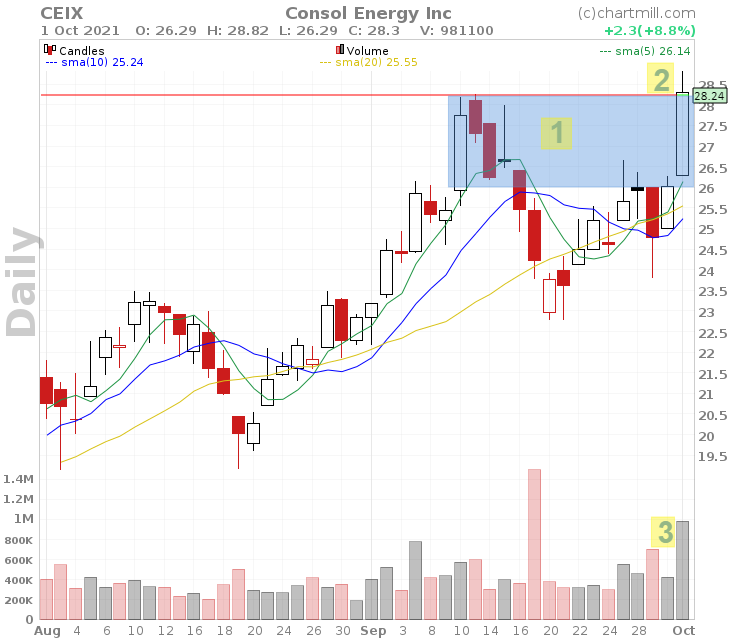
- Trading range before the actual breakout
- Breakout candle with a close above the resistance zone
- Significantly increased volume
Setting up the basic filter screen in ChartMill
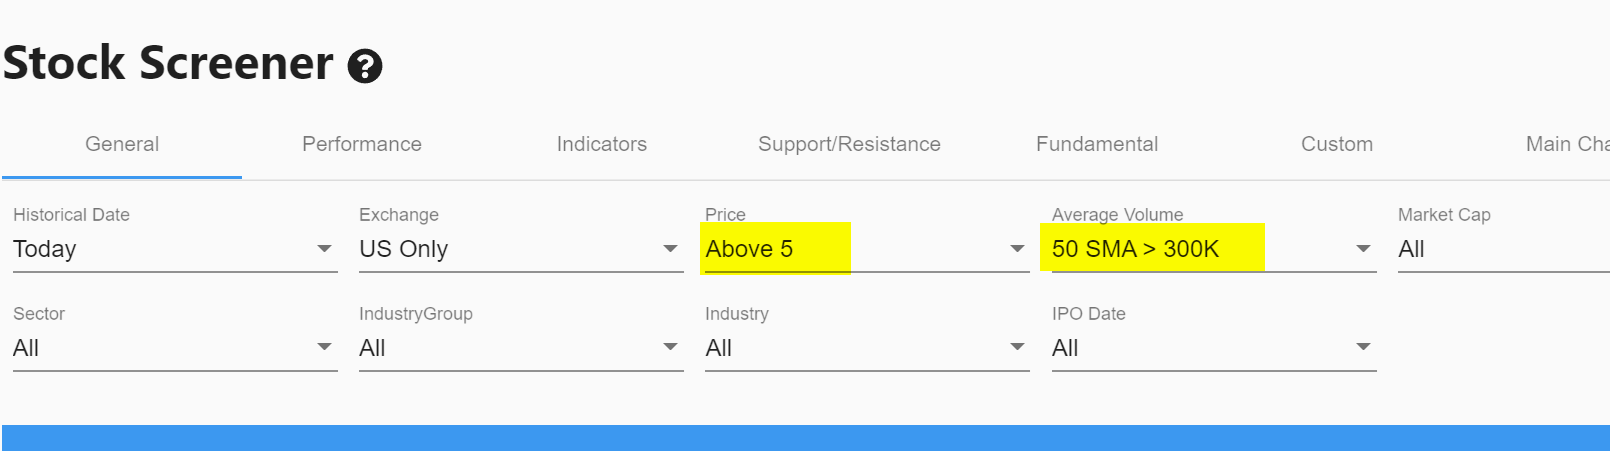
In terms of basic settings, volume and minimum price are especially important. I always use $5 as the minimum price and a trading volume of at least 300,000. After all, you want to be sure that the shares you are trading have enough liquidity so that buying and selling goes smoothly.
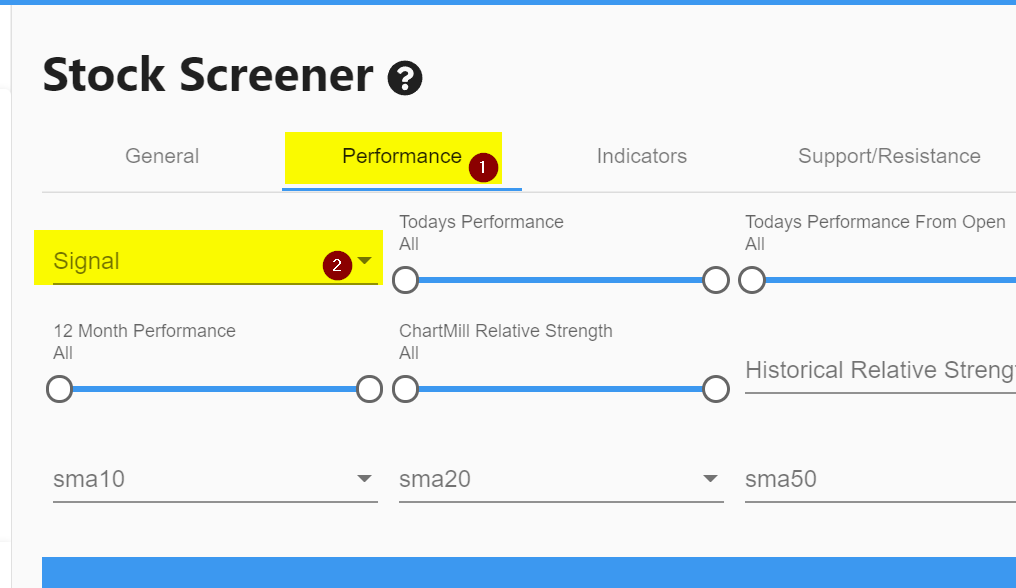
To define the outbreak itself, there are several options through the 'Performance' menu. Then select the 'Signal' tab.
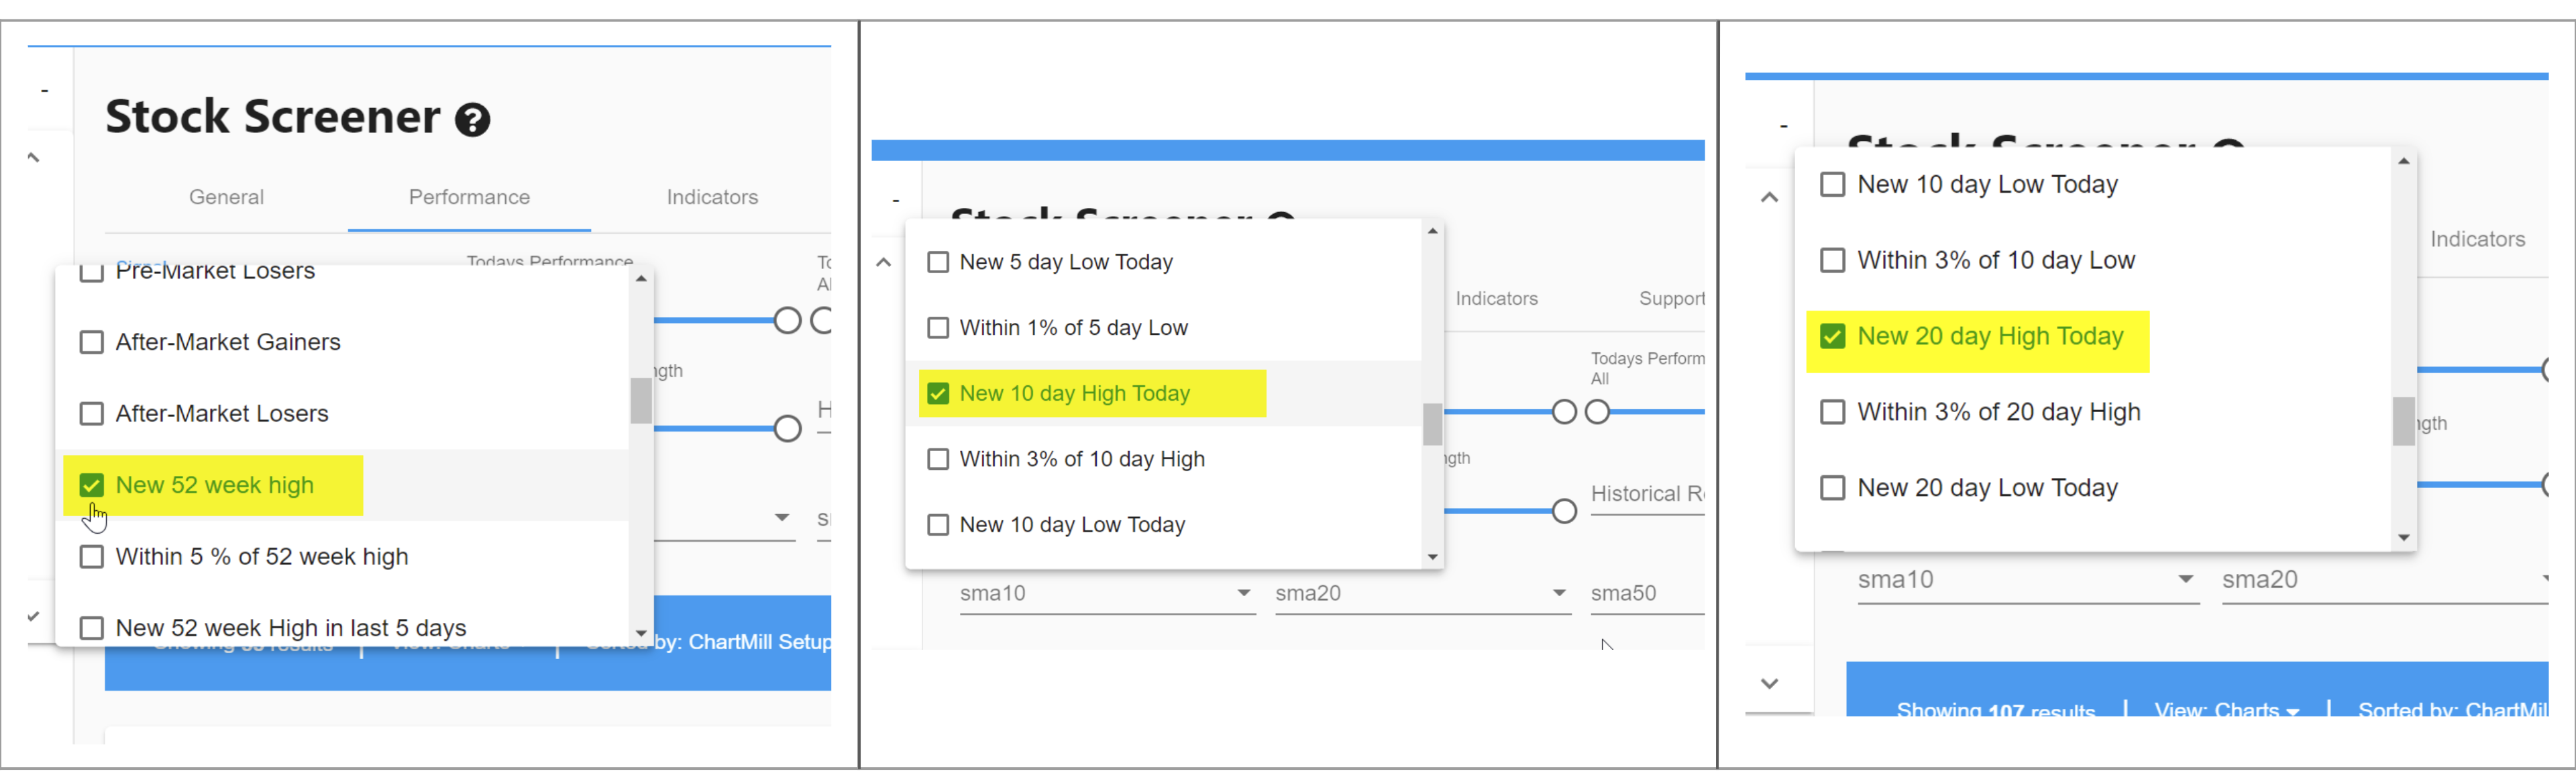
If the market is in a strong bullish uptrend (as is the case now at the time of publishing this article) it is best to select the 'New 52 Week High' signal. If the number of shares is too limited, you can also opt for 'New 10 Day High' or 'New 20 Day High'.
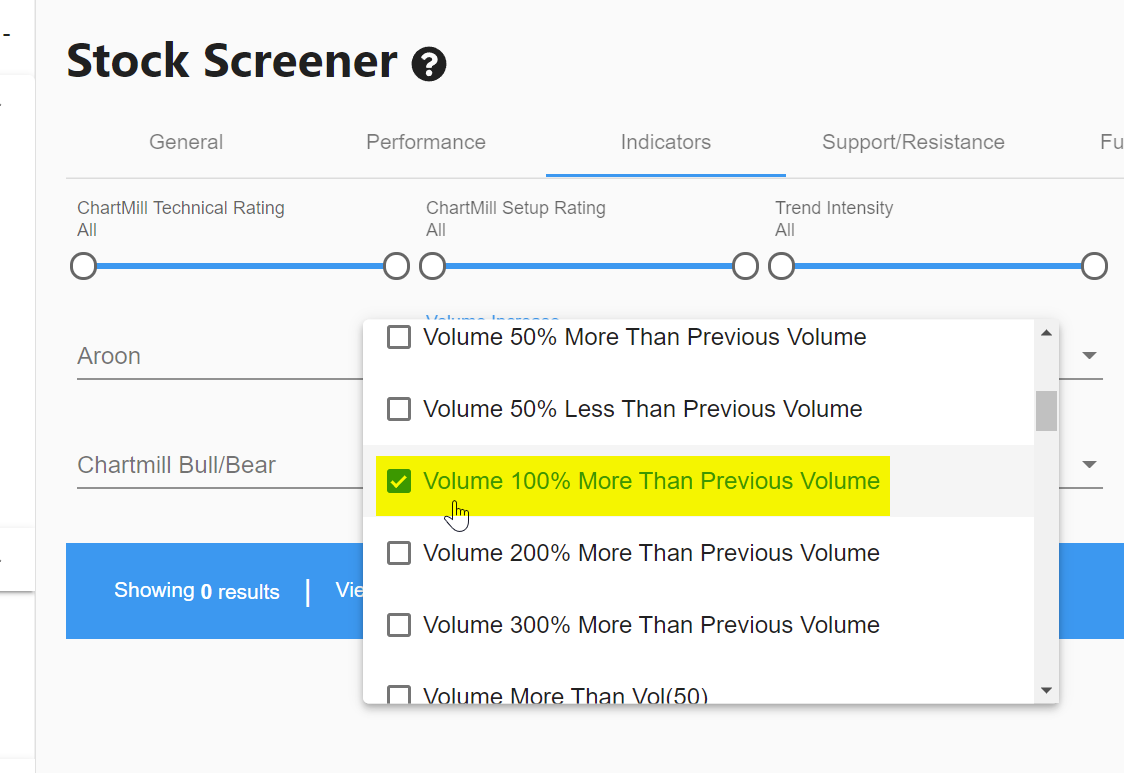
For the volume filter, I use the 'indicators' menu. select the 'Volume Increase' tab.
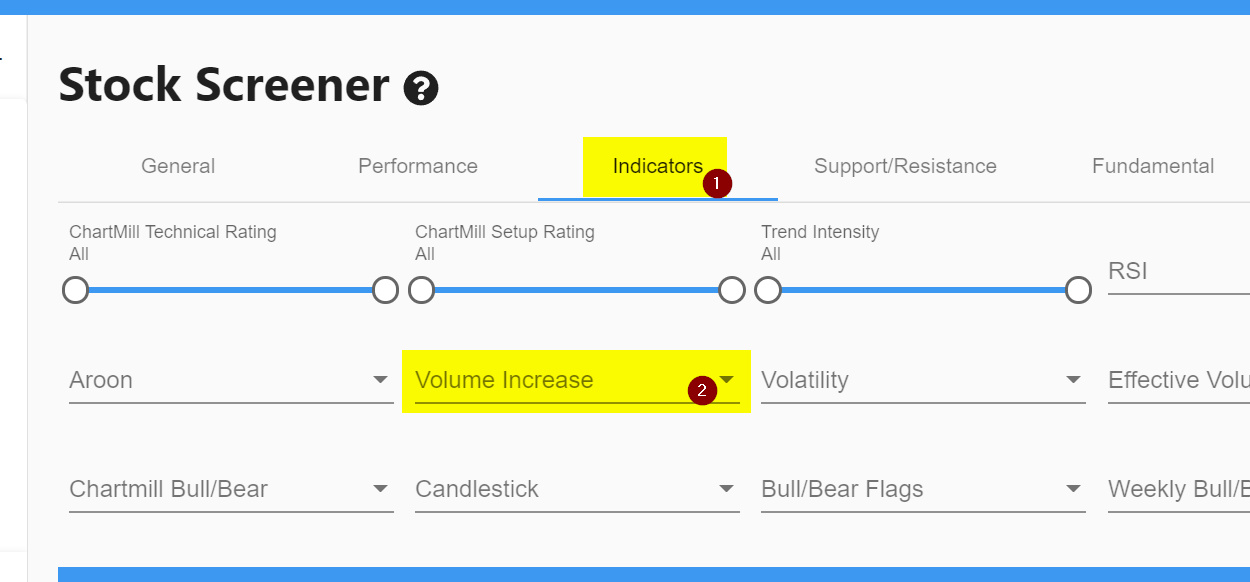
I define that the volume of the last trading day (the breakout candle) must be at least 100% higher than the volume of the previous trading day.
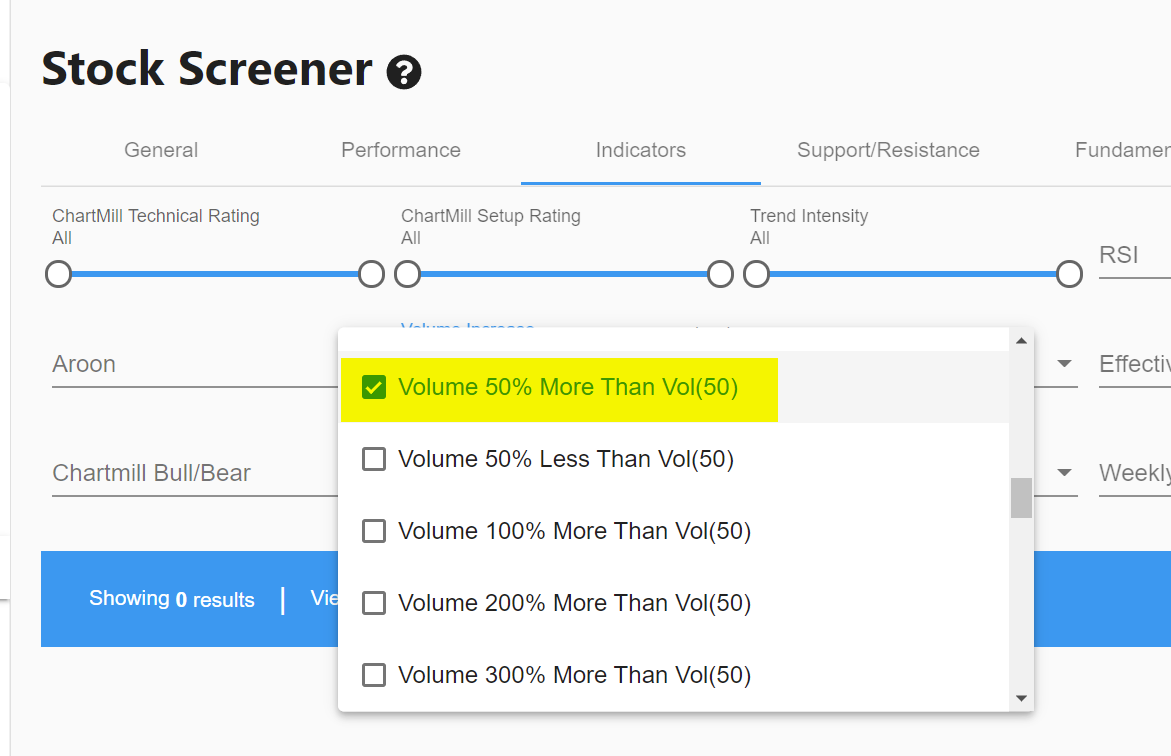
In the same dropdown menu, I also select that the volume must be at least 50% higher than the average volume of the past 50 trading days. In this way, I combine a short- and long-term volume filter to make the results more robust.
Important! The stocks that survive this basic selection are not just all valid 'long setups'!
This is the link to the results of the filter, end of trading day on October 28, 2021.
All selected stocks from the link above had reached their new highest annual price on sharply increased volume by the date of October 28. But to be retained as effective breakout setups, they must also pass a manual selection. The workflow to get to that final selection of just one or a few stocks will be covered in a separate video soon.
Use this link to get a daily overview of all stocks that meet the filters listed in this article.
In this case, Arbest Corp (ticker ARCB) was retained as a 'long trading idea' for the next trading day and posted as a 'buy setup' on our instagram page on october 29, 2021.

A few more specific considerations that are important when selecting breakout setups :
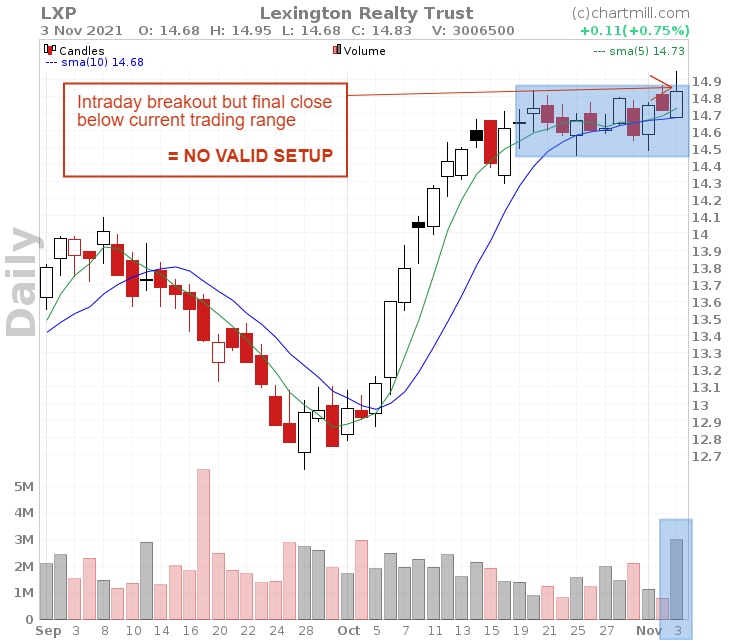
- The close of the breakout candle must be higher than the breakout level itself. An intraday breakout with a closing price below the existing trending range does not count. Such setups are rejected inevitably.
- The closing price of the breakout candle must be as close as possible to the high of the day. Breakout candles with a long uppertail are to be avoided. Preferably we see long white candlesticks.
- If the screen with the filter 'New 52week high' hardly gives any or no candidates, this is an indication that the current bull market is losing strength. This can be a temporary phenomenon but it can also be a first signal that a price correction or a real trend reversal is imminent. In that case, don't go stubbornly searching until you do find that one setup that "more or less meets" the criteria, just to have a trading opportunity. Remember the most important rule in investing, lose as little money as possible. After all, this is one of the biggest (but most underestimated) advantages when using a stock screener. The selection is done solely on the basis of objective criteria. Filters will suddenly not be applied 'less strictly' because the market conditions change. The danger of withholding setups that are actually not good enough, is much more present if the selection process is entirely manual and subjective. Standing on the sidelines for a while and surveying the playing field is a much smarter choice than opting for that one setup that under normal circumstances you would never withhold. And what if that one less-quality setup still rises beautifully? So be it! If you throw up a coin and choose heads, you always have a 50% chance of being right. However, this is not a strategy but pure luck. And with luck alone you will not remain successful as an investor or trader.
Finally, these shared "trading ideas" should in no way be considered as actual investment advice. They only serve as an example, to illustrate what's possible with a screening and analysis tool like ChartMill. Above all, remember that a good entry is but one part of a successful trading strategy (but it does help of course :-). Your position sizing, exposed capital and risk linked to your stoploss are at least of equal importance.