Trend Intensity Indicator
Trend Intensity Calculation
The Trend Intensity indicator measures the strength of the trend. The indicator is defined as:
TI = SMA(7)/SMA(65) * 100.
So, trend intensity is calculated as the value of the 7 day moving average divided by the 65 day moving average.
Trend Intensity Interpretation
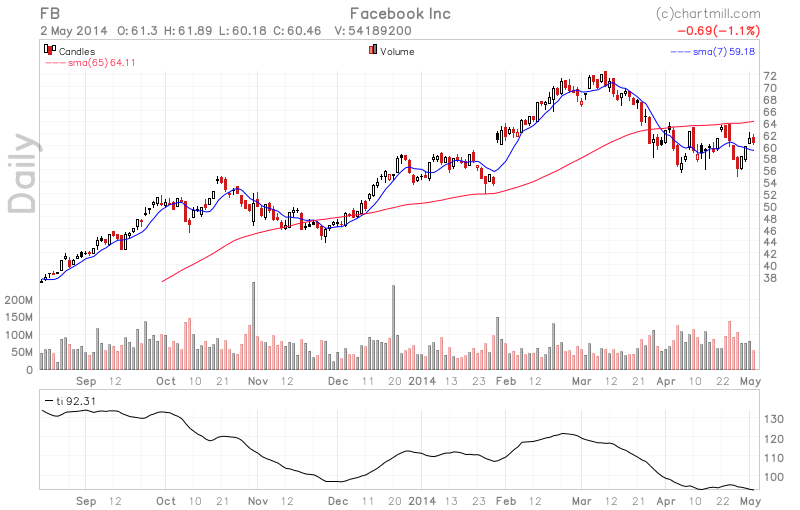
- The 7 day moving average is the average price over a short period (7 days) and will very quickly adapt to current prices. (see the blue line on the chart).
- The 65 day moving average is the average price over a longer period (65 days) and adapts more slowly. This is an indication over where prices 'came from'. (see the red line on the chart).
When we divide the values of the 2 lines, the result will tell us how many percent the 7 day moving average is above or below the 65 day moving average. For example:
- A TI value of 120 means that the 7 day moving average is currently 20% above the 65 day moving average. This tells us that prices were moving up quickly in recent history.
- A TI value of 95 tells us that the 7 day moving average is currently 5% below the 65 day moving average. This tells us that prices were moving down in recent history.
Trend Intensity as a chart Indicator.
In the stock charts you can add the Trend Intensity indicator to your charts by adding it from the indicators. See the chart below for an example of the indicator:
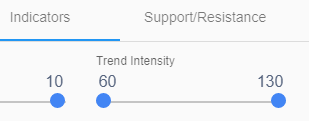
Trend Intensity Stock Screener
Trend intensity tells us whether stocks are in an up or downtrend as well as how strong the trend is. In the stock screener, on the indicators tab you will find a slider that allows you to filter on the current trend intensity value.