Return on Invested Capital (ROIC) Explained
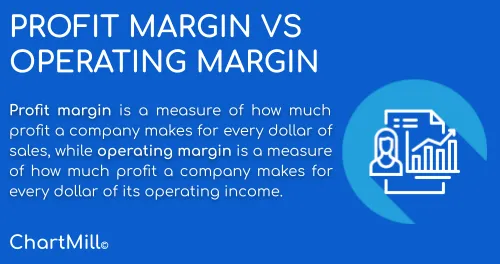
Profitability ratios
Profitability ratios come in different forms. For example, in addition to the ROIC discussed here, you have ROE and ROA. What they all have in common is that they focus on the profitability of the company and how profits are generated. This involves looking at the difference between costs and revenues, which are compared to the resources deployed.
In this article, we will take a closer look at ROIC, our favorite tool because it conveniently solves some of the shortcomings of the other two.
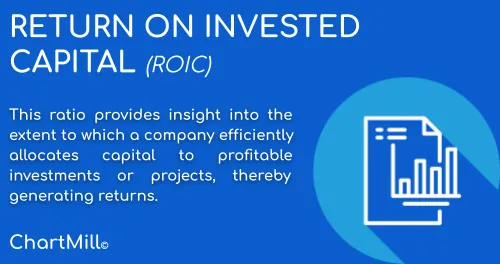
What does ROIC mean?
This Return on Invested Capital ratio provides insight into the extent to which a company efficiently allocates capital to profitable investments or projects, thereby generating returns. Comparing the ROIC to the weighted average cost of capital (WACC) reveals whether or not this is happening effectively.
ROIC basic formula
Whereas for ROA and ROE the formulas are simple, things are a bit more complicated for calculating ROIC.
The basic formula for ROIC is as follows:
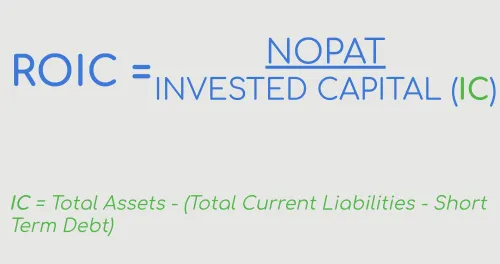
A first important difference is that - unlike ROE and ROA which both use net income in the numerator - ROIC uses net operating income after tax (NOPAT) for this purpose. This is obtained by reducing EBIT ("Earnings Before Interest and Tax") by the prevailing tax rate.
For the denominator, this ratio uses invested capital. That equals total assets (current and fixed assets) minus non-interest-bearing current liabilities (all current liabilities excluding bank loans and leases).
- Current assets = all items that are relatively easy to convert to cash such as inventories, trade receivables, cash investments and cash.*
- Fixed assets = all operating assets used by the company for a long time such as land and buildings which are considered tangible fixed assets. However, there are also intangible fixed assets to be taken into account, such as patents and goodwill.*
- Current liabilities = current liabilities with a maximum repayment period of one year such as, for example, supplier credit or taxes payable.*
Relationship between ROIC and WACC
Revenue growth and return on invested capital are the basis of value creation. However, regardless of revenue growth, the return on invested capital must always exceed the cost of capital. Even high sales growth combined with too low a ROIC will always result in loss of value. After all, excessive costs eat into profits. So reducing costs takes precedence over revenue growth.
The cost of capital includes the minimum expected weighted average return (WACC) of all investors for bearing the risk that the future cash flows of an investment may deviate from expectations.
Consequently, the ROIC result should always be compared against the WACC. Only when the ROIC is greater than the WACC can it be concluded that the company is earning more than the cost of capital and thus creating value.
ROIC variants
The basic ROIC formula includes by default all excess cash, goodwill and acquired intangible assets (patents, brands, etc.). If you use a minimum ROIC of say 15%, you will already be able to eliminate a lot of companies from your list. What remains are companies for which you know with certainty that they create value.
However, you can go a step further and ask yourself the question of exactly how much cash the company needs to achieve a certain rate of growth. This information will allow you to know immediately how much cash remains, which can be used for other purposes (buy back shares, pay dividends, make acquisitions, reduce debts, etc.).
However, the basic formula is not enough to make this calculation. This is because the "invested capital" portion also includes items that do not require additional investments to further grow the business. Because those are included by default, you don't have an adequate picture of the amount of cash needed to grow.
The typical items that do not require investment or need cash for further growth are "Goodwill," “other intangible assets” and excess “cash”. Thus, one can argue that these items are not operating capital.
Opinions are divided as to whether or not excess cash should be included in invested capital. According to some, this cash should indeed be included. After all, cash that is on the balance sheet is a deliberate choice by management, and so an appropriate return should be made on it.
The second group, however, believes that excess cash does need to be filtered out because the ROIC calculation and capital allocation should be kept separate. If you choose to do otherwise then you actually hold the company responsible for capital that is not used to generate operating income. However, this defeats the purpose of a ROIC calculation. It is precisely by removing that excess cash that a more accurate picture of shareholder value creation emerges.
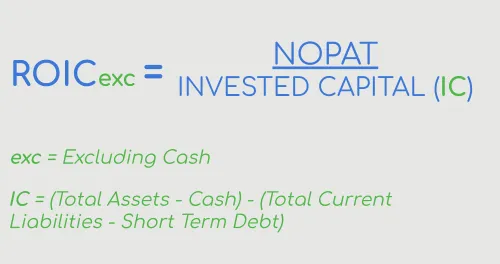
The above findings lead to two additional ROIC variants. One in which Cash is filtered out but where Goodwill and Intangibles remain parts of the invested capital, resulting in the following formula:
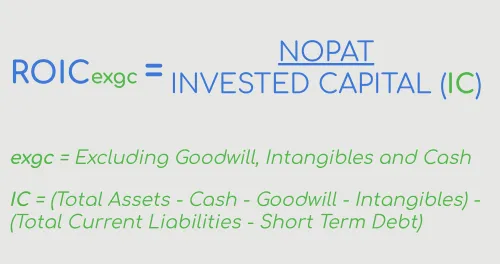
And a second variant in which, next to cash, goodwill and intangibles are also filtered out, leaving you with the purest operational ROIC.
Which ROIC formula to use?
Which method you use depends on your primary objective. If it is sufficient to have an overall picture of the value created by the company, then the basic formula in which no distinction is made between purely operational and financial capital is definitely sufficient.
However, if you would like more insight into the amount of cash remaining after the company has financed its growth, then it is necessary to work solely with the pure operational capital.
In that case, you can opt to filter out only the excess cash (ROICexc) or at the same time also remove Goodwill and Intangibles from the invested capital (ROICexgc).
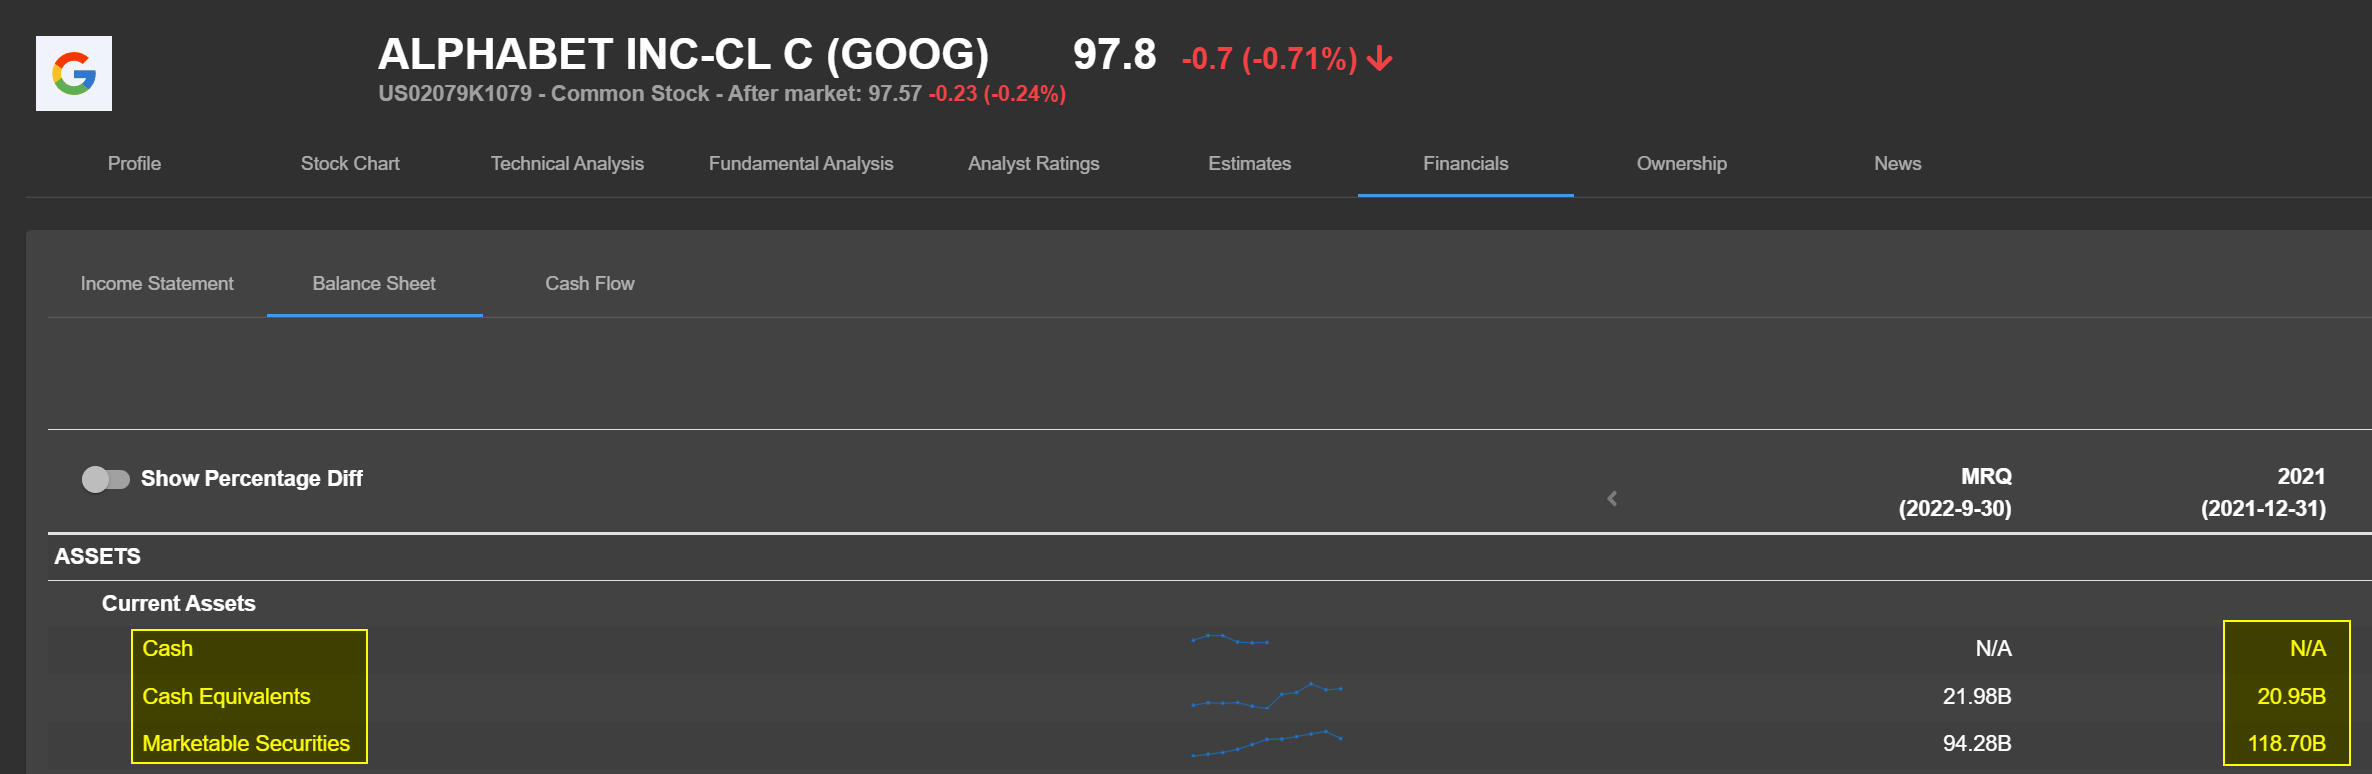
In the formula where only cash is filtered out, it should be noted that investments are also included. Looking at Alphabet's balance sheet, for example, we notice that on 2021/12/31 the company has 21 billion cash equivalents and, on top of that, 119 billion in marketable securities.
The difference becomes clear when the classic ROIC is placed next to the ROICexc.
The variant where both cash, goodwill and Intangibles are extracted from invested capital (ROICexgc) is the most operational way to calculate ROIC. This tells you what return the company achieves on its working capital and net PPE.
This figure allows an idea of what approximately needs to be reinvested to achieve a specific growth rate.
- Reinvestment rate = growth/ROIC
A company that grows at 10% and has an ROIC of 10% needs 100% of earnings to effectively achieve that growth.
- (10/10)*100
However, if the ROIC increases to say 15% then the percentage of profit needed already drops to 66% to sustain that same growth.
- (10/15)*100
What remains (+/-34% FCF) can be used for other purposes. For example, by reinvesting (part of) the free cash flow to stimulate even higher growth or it can also be used, for example, to pay a dividend. The higher ROIC thus leads to more flexibility for the company in question and from that perspective it is logical that of two companies with similar parameters, the company with the higher ROIC is a lot more valuable and thus more attractive to investors, even if the P/E ratio for such companies is much higher.
The result of the ROICexgc is the cleanest way to calculate what costs the company needs to incur to grow purely organically without having to take into account a somewhat expensive acquisition from (many) years ago.
Who uses ROIC?
Among others, American stock market guru Joel Greenblatt is an avid follower of the ROIC ratio. It is part of his magic formula which he introduced in his book 'The little book that beats the market'.
The ratio is ideally suited to assess capital-intensive companies based on their relative profitability. Companies with different capital structures are also a go-to for this ROIC. Indeed, it uses NOPAT in the numerator of the formula, which is a measure of profits available to all capital providers.
Especially pure quality investors attach a lot of importance to the ROIC ratio (in the different versions described above). It is one of the all-important filters to discover very quickly and objectively the really valuable companies worldwide.
Also one of our trading screens that searches for typical quality stocks uses the ROIC, more specifically the operational model that excludes both goodwill, intangibles and excess cash from invested capital.
There are two versions available of this quality screen, the Caviar Cruise Basic and Caviar Cruise Advanced. You can read more background information in this article.
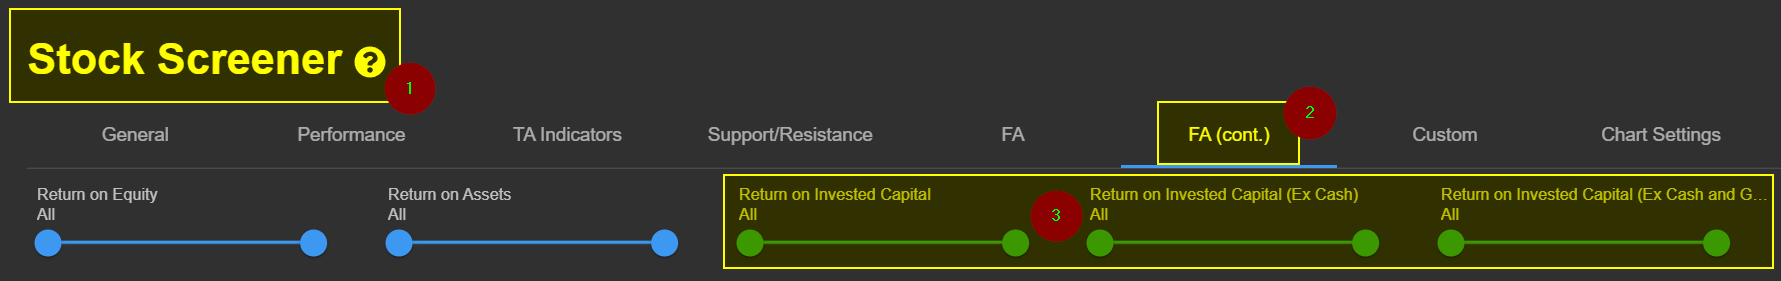
ROIC screening in the ChartMIll Stock Screener
The ChartMill Stock Screener is the only one exclusively offering the three versions of the ROIC ratio discussed above. You can find them on the stock screener page under the "FA (cont.)" tab.
Other Profitability ratios You Might Be Interested In...
Return on Assets Ratio (ROA) Explained
Return on Assets looks at returns from the perspective of total assets, not just equity as is the case with ROE. text
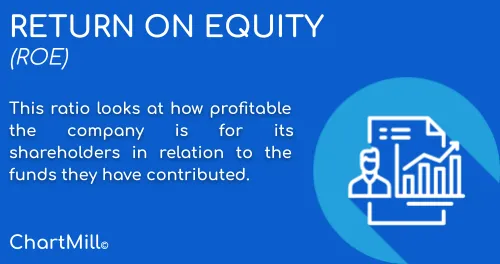
Return on Equity Ratio (ROE) Explained
Return on Equity approaches profitability from the perspective of equity. Read more...
Return on Capital Employed (ROCE) Explained
Return on Capital Employed or ROCE is a key figure that estimates the amount of profit a company can generate with the capital it uses. Read more...
Fundamental Profitability Filters
In this article we will discuss the fundamental filters related to the Profitability of a stock. Read more...