
Combining fundamental and technical analysis for stock pickings (like only ChartMill can)
Last update: Jun 21, 2022
Fundamental and technical analysis are concepts that are undoubtedly familiar to those who invest themselves. Both methods are used to analyze companies/shares with the intention of deciding what and/or when something is considered as a good idea to buy or sell.
The two methods are vastly different and each has its own pros and cons.
Which is better?
For as long as the two models have existed, there have been proponents and opponents. Granted, the differences are great when the two are compared.
The main objective of the fundamental investor is to value the real intrinsic value of the company, he or she looks for evidence that shows that the current value of the company is lower than the fair value. As soon as he or she has come to that conclusion the company is considered to be worth buying.
Contrary to the technical analyst who is convinced that all this information has already been incorporated in the price development. Only the price trend determines whether a stock is doing well or not. Where and when to buy or sell is mainly a matter of 'timing'.
Because every investor is unique, it is impossible to say what works best for you.
Perhaps the best option is a combination of both ways?
Imagine a company which is considered very cheap on the basis of fundamental analysis. However, from a technical point of view that same company is not worth buying because the price trend is currently caught in a longterm downward price cycle.
Especially when the general market sentiment is negative, companies which are fundamentally sound can nevertheless be dragged along in a general market decline. In this way the fundamental investor risks buying far too early. Subsequently, a lot of patience will be needed before the position in the stock will yield a profit. Applying a few elementary rules from technical analysis can easily overcome this.
However, the opposite is also true...
Suppose that a technical analyst sees two charts of companies in the same sector where the price breaks out above a resistance level and both companies are equally worthy of buying according to the visual analysis. Fundamental analysis can then be an added value to see if both companies are quoting above or below their intrinsic value. The outcome can be an additional parameter to decide which of the two companies to trade.
First and foremost, start with a thorough qualitative analysis and screening (FA)
As far as fundamental investors are concerned, a distinction is mainly made between value investors and growth investors. Nevertheless, you will find that both strategies have common characteristics.
Value Stocks
Value investors focus on stocks that are undervalued because they expect the price to rise again since the company is worth more than the current market price (based on the calculated intrinsic value). The greater the difference between the (lower) market value and the (higher) intrinsic value, the more interesting the stock becomes for the value investor.
Detailed article on Value Investing
Screening for Value
Getting a basic selection of value stocks with the stock screener ChartMill is possible in several ways. The easiest way is to use the predefined ChartMill fundamental ratings where you can set a score from one to 10 for each component.
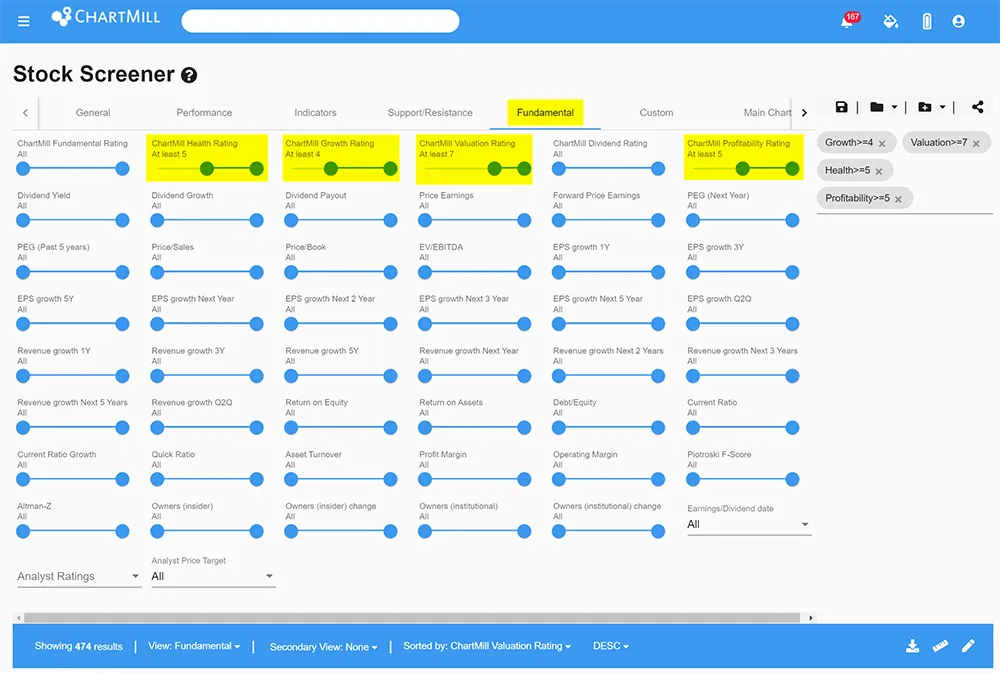
In the screenshot below, I have set the ChartMill Value Rating to 7. The ChartMill Growth Rating requires only 4/10, after all I am looking for value stocks rather than growth stocks. I set the company's profitability and financial health ratings to 5 by default, which is a neutral score.
By applying only this limited number of filters to the entire database of more than 22,500 shares, only 474 shares remain.
All screens in this article were conducted on the date of Sunday, June 19, 2022
Access this filter directly in ChartMill.
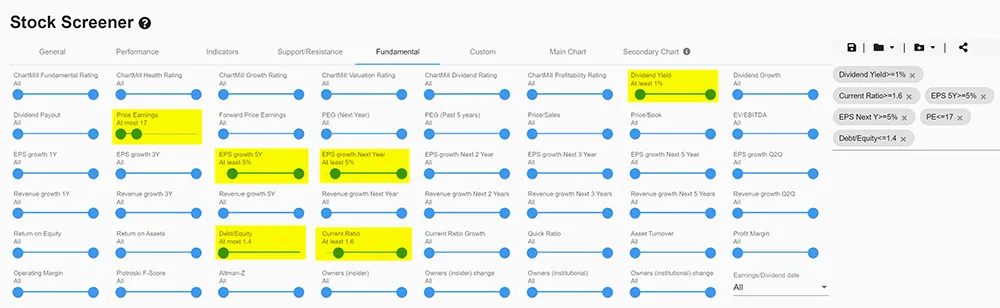
A second way to find value stocks is to individually select and set the typical value ratios yourself. This way you can put your own emphasis on specific aspects of value investing. In the screenshot below I have used some typical valuation ratio filters individually to obtain a basic selection of value stocks.
Access this filter directly in ChartMill.
Growth Stocks
Stocks that are expected to grow significantly faster than their sector peers and the overall market average (both in terms of earnings and price evolution) are considered growth stocks. Investors who invest in growth stocks do so specifically because they expect the price of the stock to rise exponentially, thereby aiming for capital appreciation rather than dividends.
Detailed article on Growth Investing
Screening for Growth
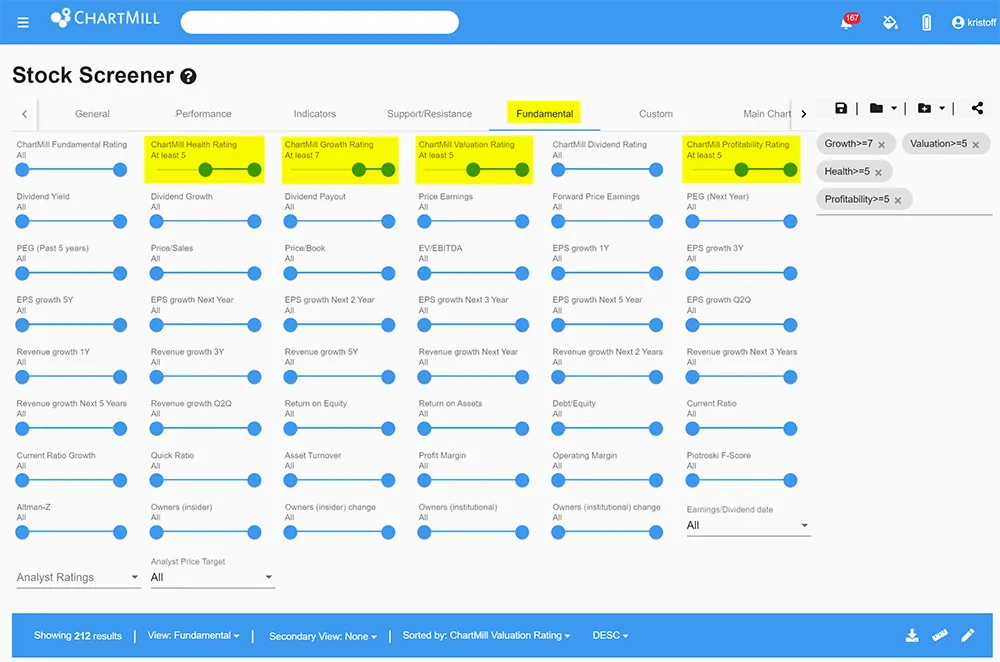
In the screenshot below, a combination of predefined fundamental ratings was used to arrive at a first basic selection of stocks with typical growth characteristics. Using only 4 fundamental filters, we are barely left with 212 stocks that meet the set criteria.
Access this filter directly in ChartMill.
This article provides some more information on the individual filters that are important in identifying and selecting growth stocks.
Dig Deeper...
With the fundamental value or growth filters used, you end up with a list of stocks that meet a number of basic conditions. Depending on where your focus lies (more fundamental or more technical) you can either proceed immediately with the application of technical analysis or you can opt to first examine companies even more fundamentally on the basis of their specific financial results and compare these companies with each other.
On the profile page of the company in question you will find all sorts of information that can help you with your further analysis. Be sure to check out the fundamental report where - by means of a visual summary - you can check at a glance all the details about a company's profitability, financial health, valuation and growth.
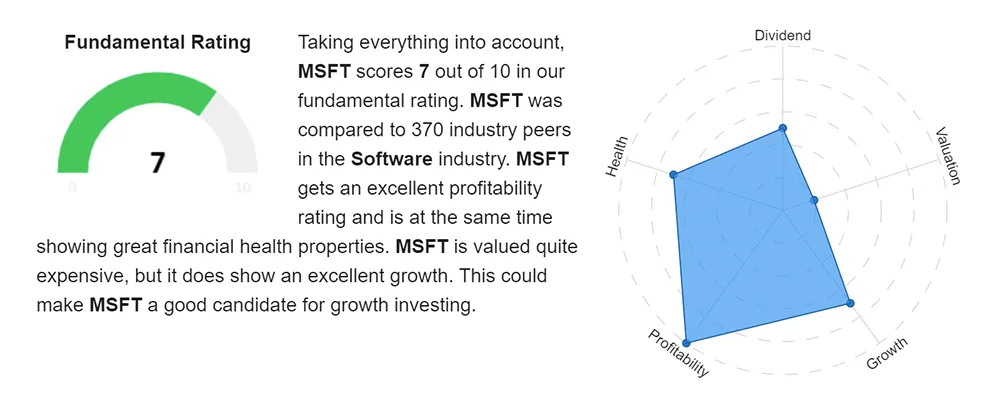
example: fundamental report Microsoft - click here for the full report.
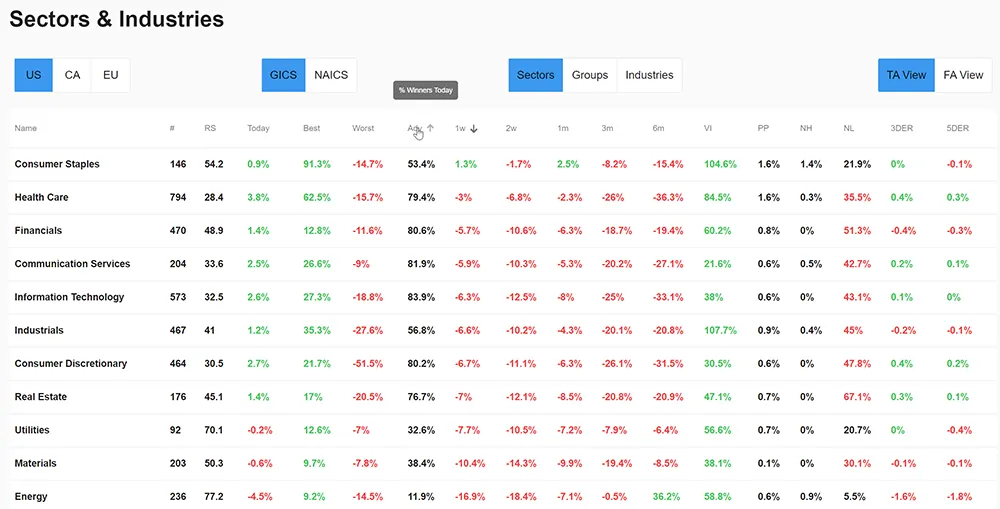
The profile page also features the company's historical financial numbers, as well as analyst ratings, largest institutional shareholders and recent insider transactions. Don't forget to check out the sector page to get an idea of which sectors are currently attractive and performing well.
One last important tip: When comparing certain ratios between companies, always make sure that the companies belong to the same sector or industry. For example, capital-intensive industries will have a higher average debt ratio. Comparing such a ratio between companies from different sectors can therefore lead to wrong conclusions.
Step 2, apply technical analysis (TA)
Once you have a final selection of stocks that seem fundamentally interesting to invest in, you can start with the technical filters.
Some general filters
- Exchange
- Price
- Average Volume
- Market Cap
- Sector/Industry
Below, I used the same screen filter for growth stocks as earlier in this article. In this case, an additional technical selection was made based on region, minimum price, minimum volume and maximum market capitalization.
The region is a purely personal choice (US only). The minimum price, being $5 is intended to exclude very low priced stocks from the selection. Together with the required minimum volume filter (at least 300,000 shares traded on a daily basis), this should ensure that the most illiquid stocks will be excluded from the selection.
The market capitalization filter serves to exclude the really very large companies as such companies are likely to have already grown strongly and further growth potential will be rather limited anyway.
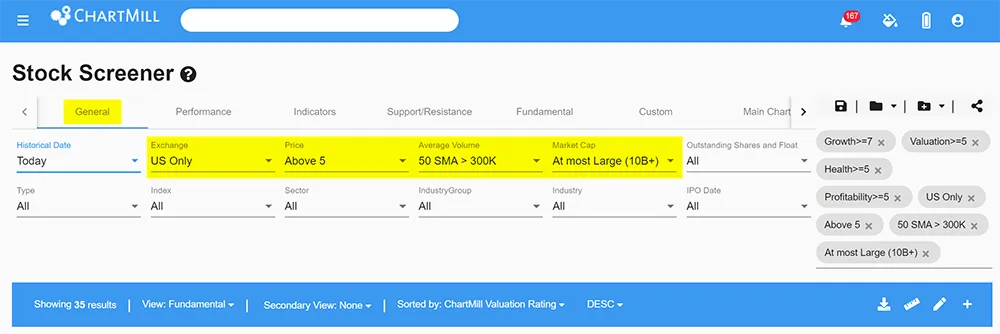
With these additional general price filters, the selection is further narrowed from 212 to only 35 remaining stocks.
Trend filters
In today's negative market environment, a lot of stocks are falling, even established companies with a strong reputation are taking hits. The fact that these companies are now trading at a steep discount is undoubtedly attractive. The problem that arises is that we do not know when the bottom will be reached. What is cheap today could suddenly become much cheaper tomorrow...
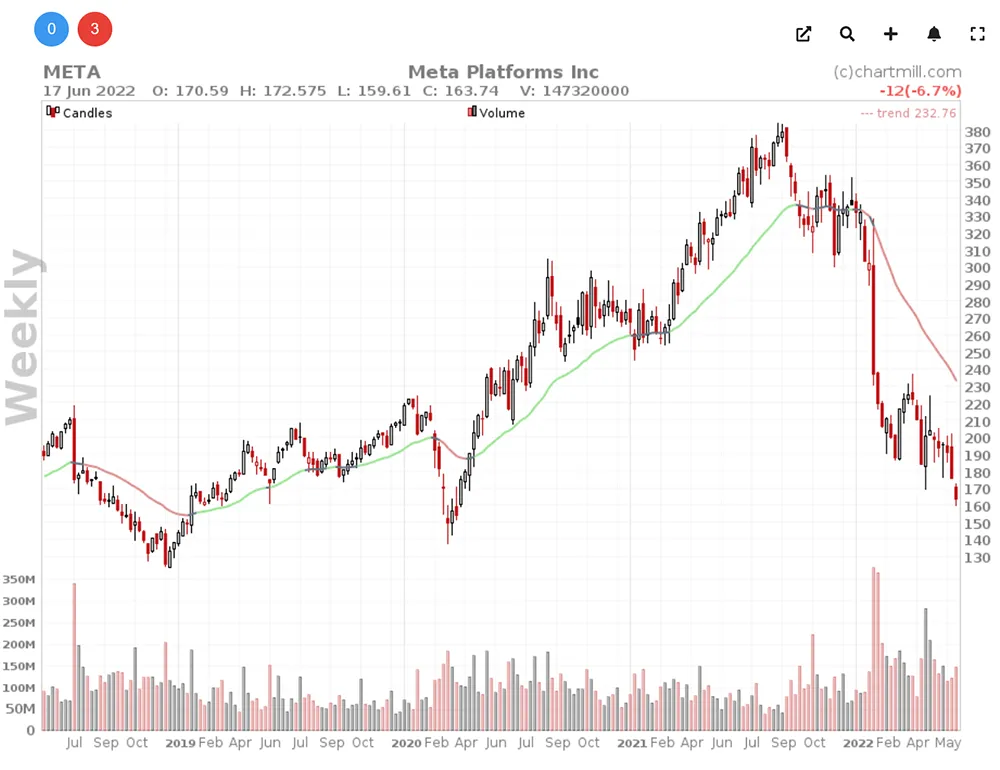
One solution is to only buy when the long-term trend is once again upward. To determine this long-term trend, there are several possibilities in ChartMill. In the example below, I have used the ChartMill Trend Indicator. A 30-week sliding average which is applied to the weekly chart. If it is green it means that the long-term trend is bullish, red stands for bearish and gray is considered neutral.
Filtering based on a long-term bullish trend is easy. Click on the 'indicators' tab. Under the item 'ChartMill Trend' select 'Long term trend positive'.
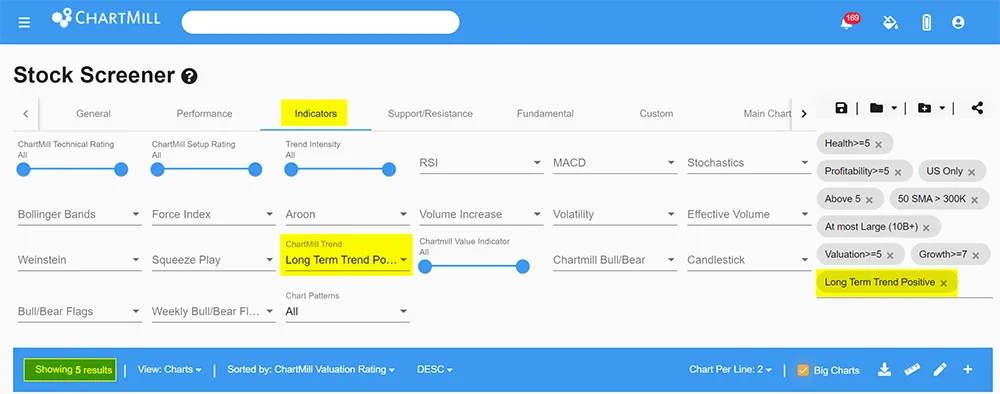
By additionally applying this long-term trend filter, we further narrowed the selection to only 5 stocks.
Additional technical filters
one possibility, for example, is to withhold only those stocks that are oversold based on a technical indicator. To do this, go to the 'indicators' tab and open the drop down menu under the desired indicator.
In this example I have specified that the value of the RSI indicator should be lower than 30.
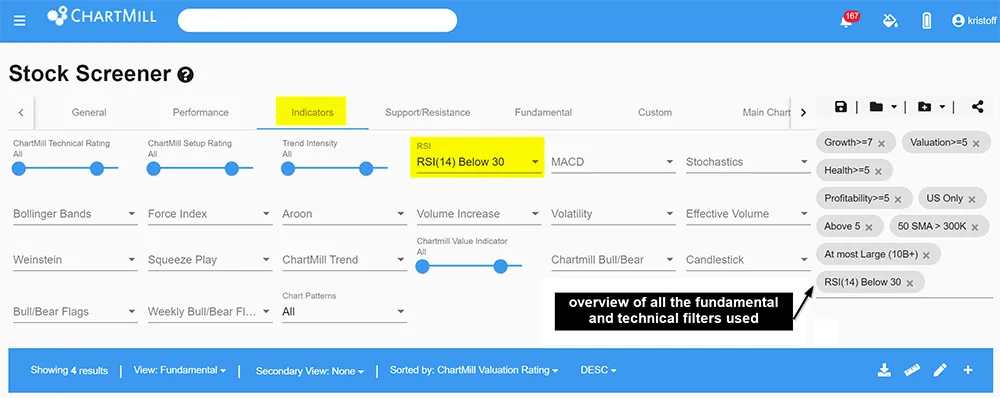
Of the 35 stocks (basic growth selection which was covered earlier in this article including the general price filters but without the trend filter), only 4 were left after applying the RSI screen filter.
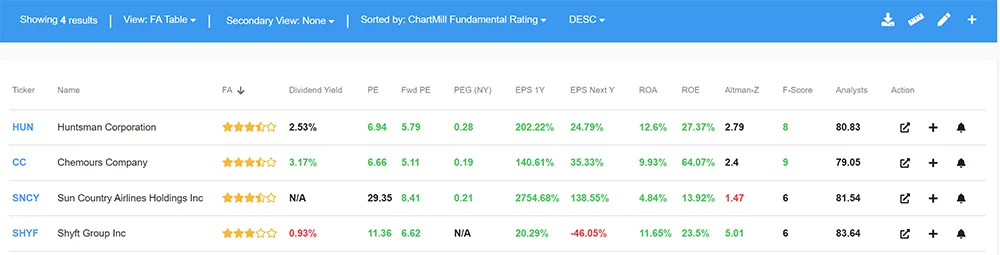
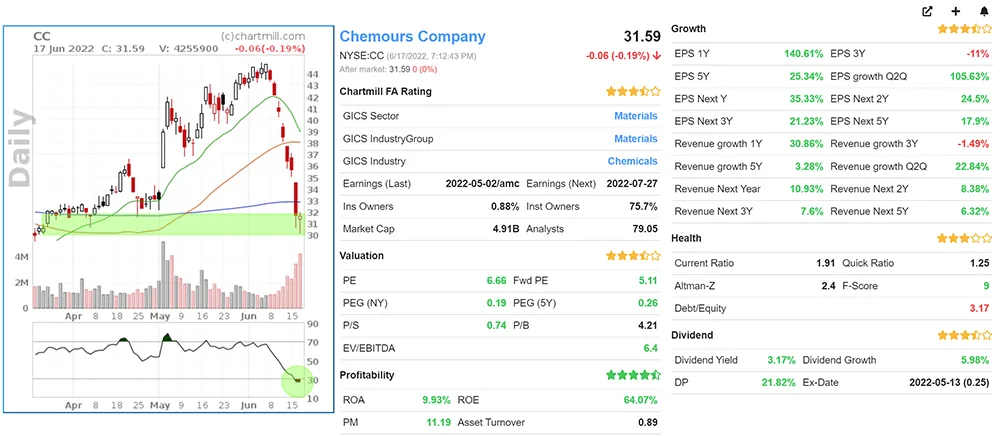
Taking a quick look at the candidates, Chemours Company in particular stands out. The company not only has a good ChartMill Growth rating but also scores well on the other fundamental ratings. Like so many growth companies, the stock is struggling in the current negative market conditions.
However, the chart does show that the stock is now at a support level and a doji candle was formed on the last trading day. As we defined in the screener, this stock is currently oversold according to the RSI. Definitely to keep an eye on if the stock can rise above its 200-day moving average again (the blue average line on the chart).
If instead of the RSI indicator we use the Stochastics indicator, set with a value lower than 10, 8 stocks remain.
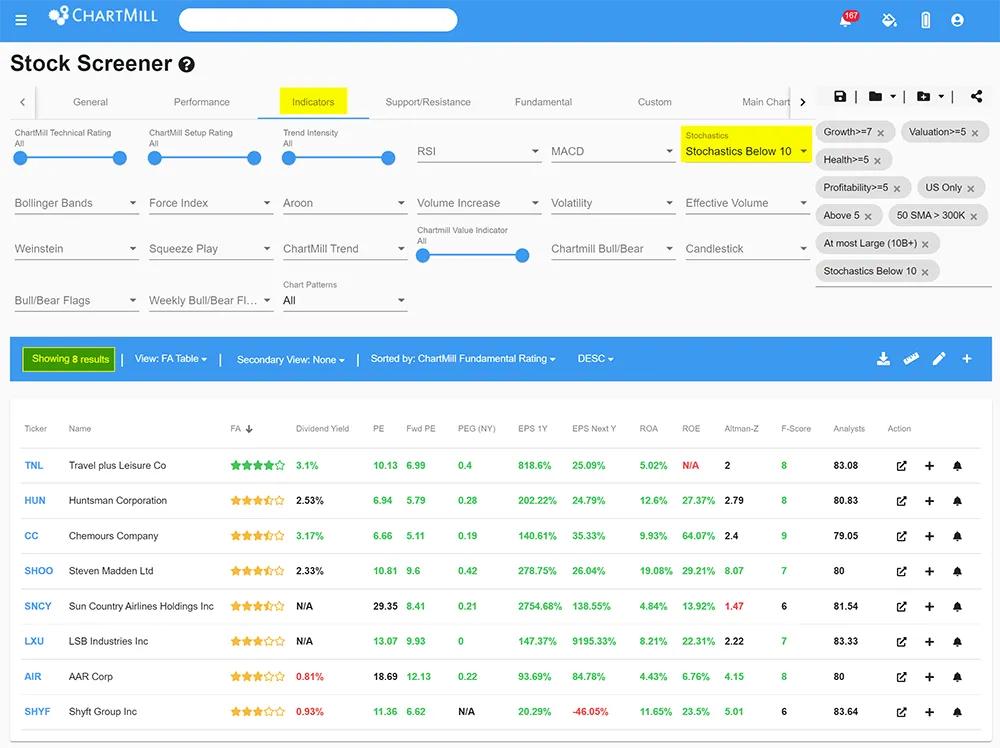
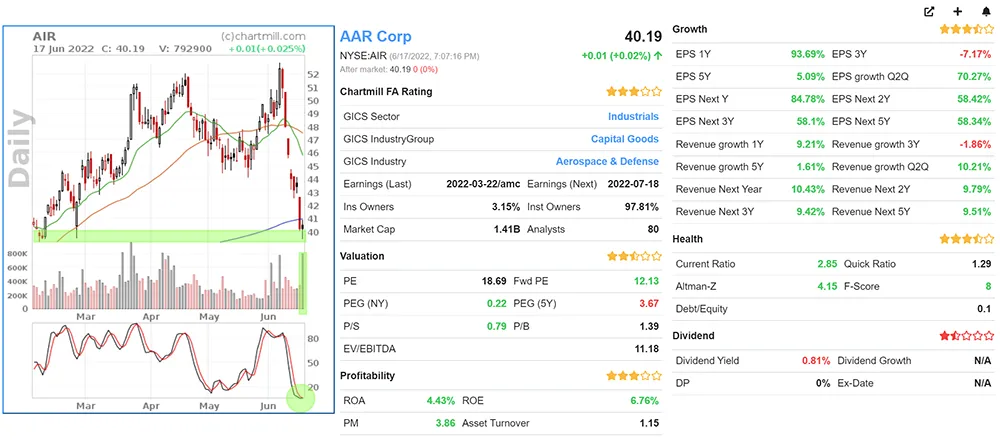
Here, it's mainly AAR Corp. that stands out. The stock is trading at a very important support level and is equally showing a doji candle. The buying volume last Friday (2022-06-17) was much higher than usual and the oversold signal of the Stochastics indicator is now very strong. Again, the stock is trading just below the long-term 200-day average and it is advisable to wait until the price can close above it before taking further action.
There you have it, these were two simple examples where we started with a fundamental screen to find typical growth stocks and where we then used some additional technical filters to end up with two interesting setups worth following.
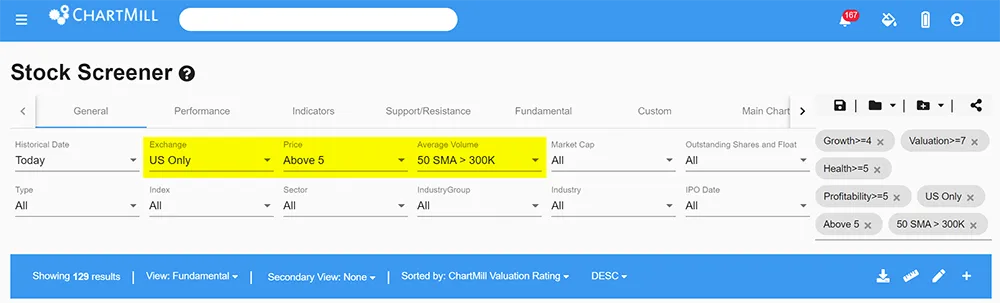
Finally, I'll give another example using the screen filter for value stocks. The general filters are almost the same as the screen for growth stocks, only the maximum market capitalization is omitted. With these additional basic filters, 129 typical value stocks remain.
Next, I'm using an additional technical trend filter by which I require that the long-term trend may be neutral or positive but not negative. To do this, once again select the indicators tab and under the 'Chartmill trend' section specify the option 'short term trend neutral or positive'.
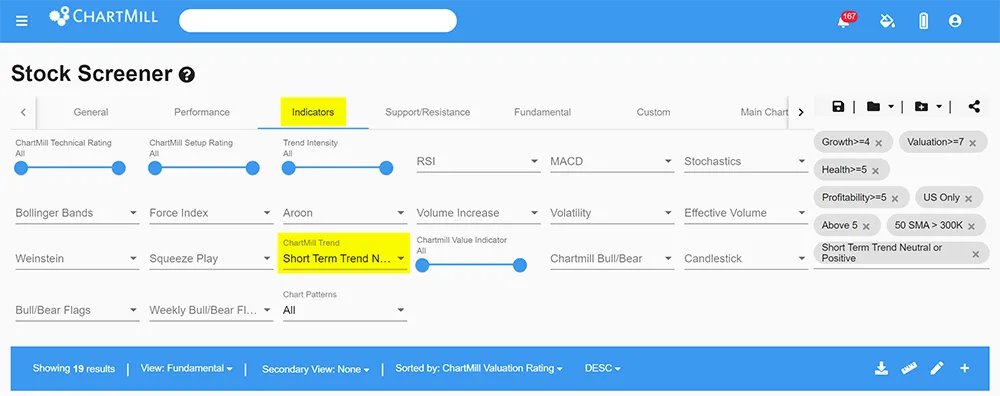
This leaves only 19 stocks. But we do know that all these stocks are still showing a neutral or even positive price trend in the long term.
Now, rising volume is very important when looking for the best setups because it indicates that more buyers are interested in the stock. ChartMill allows you to filter for increased volume strength. That is exactly what we are going to do with the following filter. Using the same indicators menu, I now use the 'volume increase' item and set the filter to "Volume 100% more than previous volume". Using this specific filter, only stocks will be retained whose trading volume in the last trading session was at least twice as high as the day before.
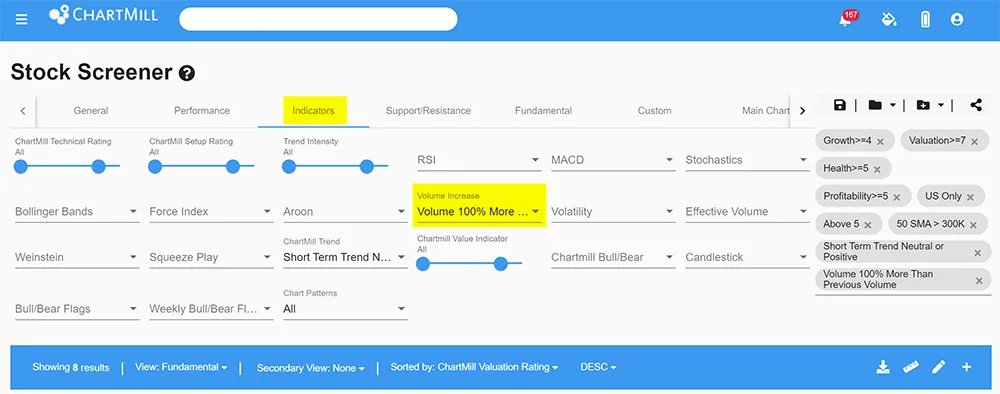
We are now left with 8 shares.
Finally, if we also set that the price must have closed positively on the last trading day (via the performance tab and then using the section 'todays performance') we end up with a core selection of barely 4 stocks that meet all the set criteria.
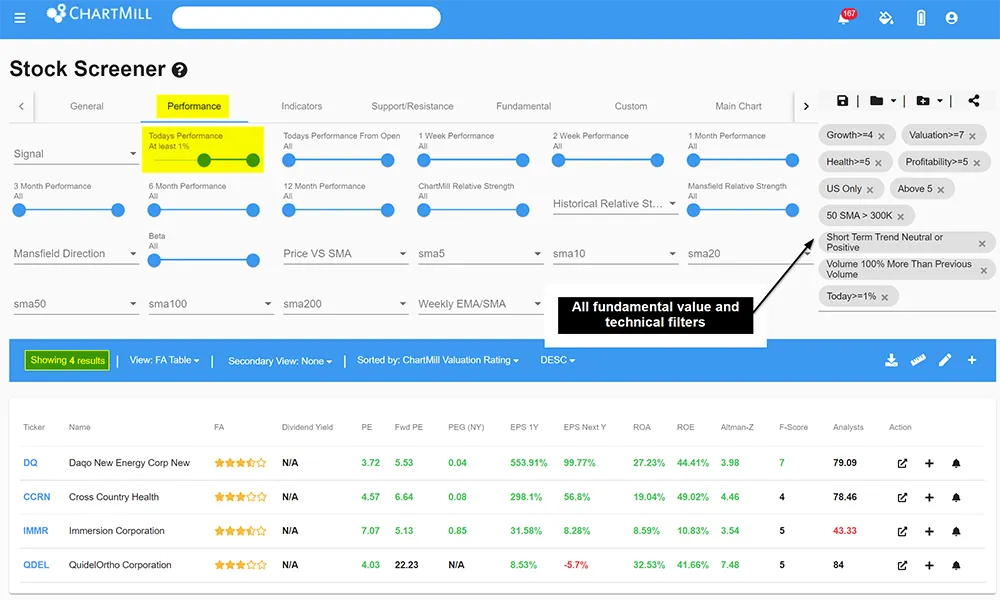
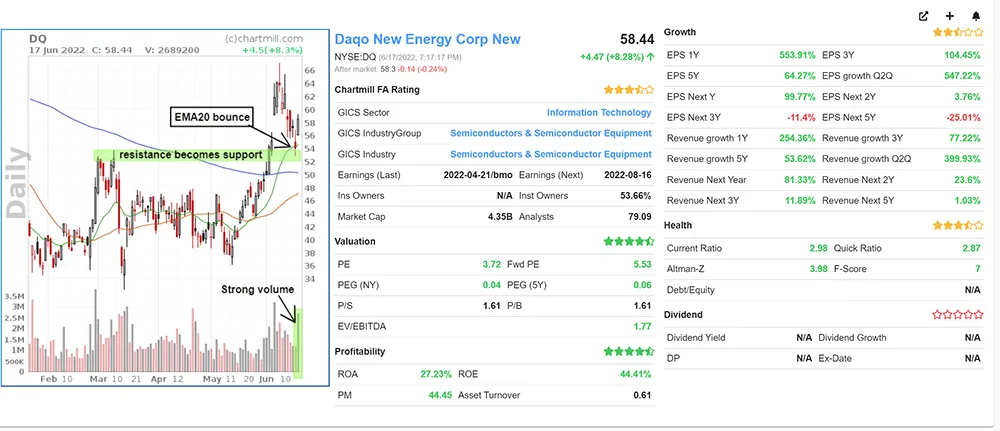
Looking at the individual charts of these 4 stocks, Daqo New Energy Corp in particular stands out. Its price has experienced a pullback to the SMA20 which corresponds to a former resistance level (March 2022) that has now served as support ($52-54 zone, green horizontal bar on the chart). The share price rose hard last Friday by more than 8%. The associated volume was sharply elevated. Quite a nice setup for a long position, assuming a continuation of the existing upward trend since May 09, 2022.
Conclusion
"To choose is to lose" is sometimes said. But why would anyone be forced to choose between the two? There's a world of difference between fundamental and technical analysis but that doesn't mean you can't combine them!
Feel free to experiment with your own filter combinations (if you don't have an account yet, you can create one via this link. Payment information is not requested, basic use of chartMill is truly free). The many filter possibilities allow almost endless combinations but above all don't try to push it too far. Applying more filters is no guarantee for better results.
Using ChartMill to identify financially sound and mature companies with strong balance sheets and then only buying them when the long-term trend has turned bullish again is a simple example of combining fundamental and technical analysis filters. But in today's volatile market conditions, this simple screening strategy might be the perfect balance between "what" and "when" to buy....
Trade safe!
The ChartMill Team
![]()
![]()
![]()
![]()
