US Market Update
Last update: Jun 13, 2022
It’s Always Darkest Before the Dawn...
Substantial weekly losses for the US ETF indices. Particularly last Thursday and Friday saw heavy losses. The reason is obvious, an ever-increasing consumer price index for the month of May. That figure rose to 8.6%, well above expectations (8.2%), mainly due to rising oil and food prices.
Investors fear further aggressive interest rate hikes where the Fed will not only raise the base rate by 50 basis points in the next two months. It is now also assumed that this will be equally the case for August and September.
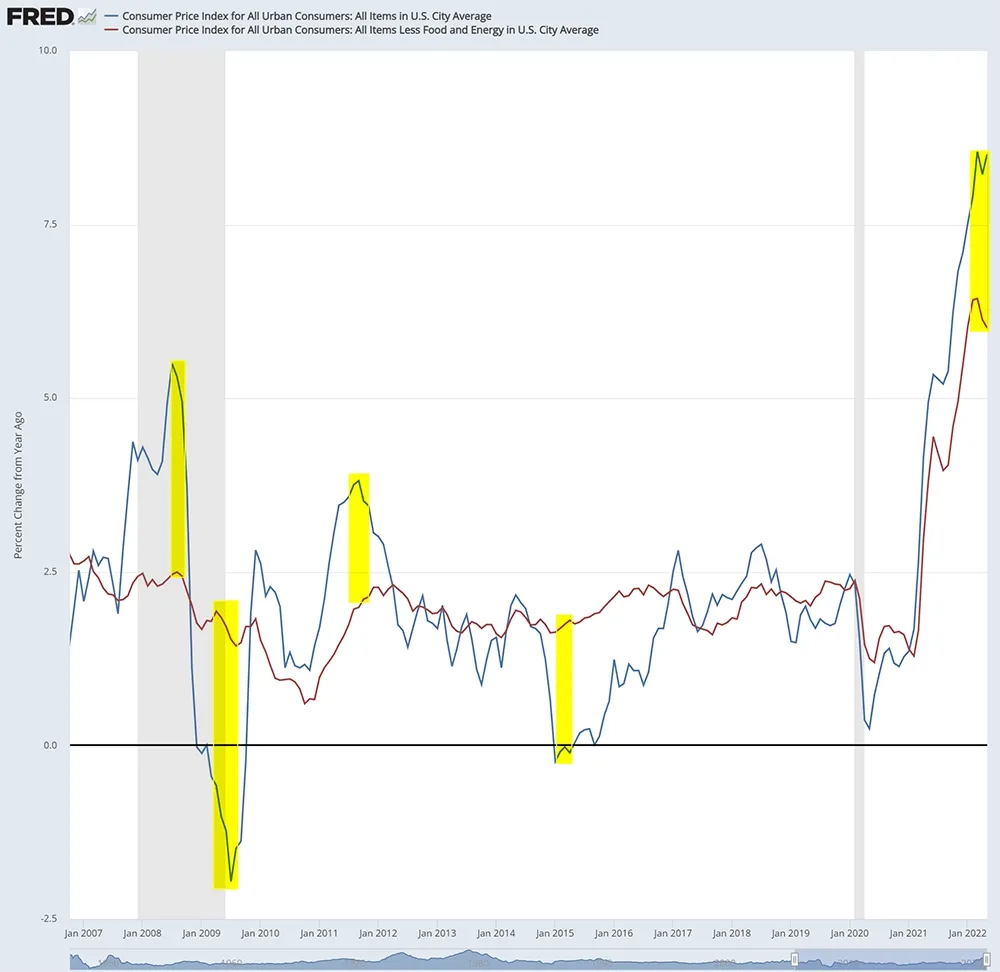
https://fred.stlouisfed.org/
A small ray of hope is visible in the evolution of core inflation where, for the second month in a row, a slight decrease can be observed. The figure came out at 6% and was therefore more or less the same as predicted (5.9%).
What is further striking in the above graph is the substantial difference between headline inflation and core inflation. If the comparison is made with similar events in the past, one notices that such differences were always followed by a correction, so that headline inflation is again more in line with core inflation.
But as with equity prices, the warning applies that past performance is no guarantee of future results...
The negative sentiment is particularly evident in the preliminary figures from the Michigan Consumer Sentiment Index, which suggest that consumer confidence has taken a hit.
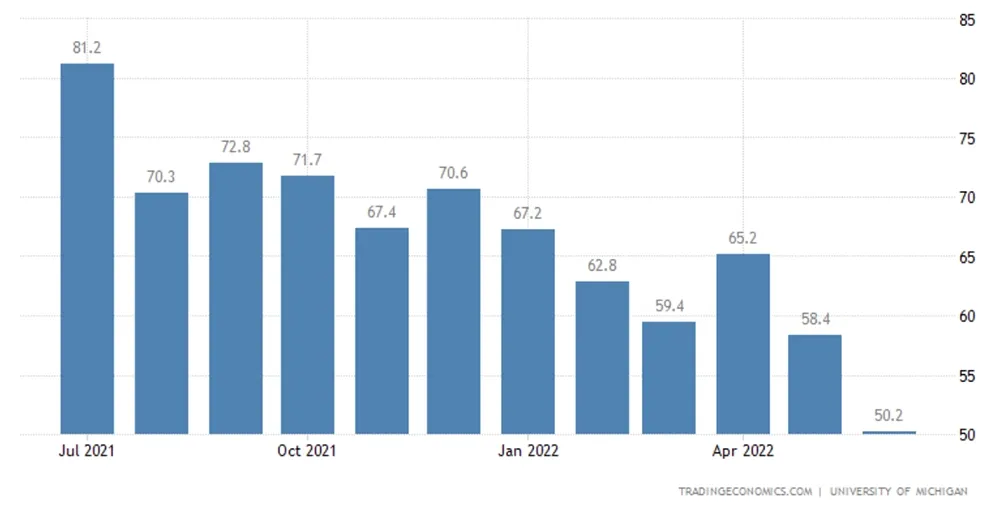
https://tradingeconomics.com/
With a figure of 50.2 - where estimates only suggested a drop to 58.1 - it is clear that consumers are very pessimistic about the economy and the specter of a global recession is becoming increasingly real.
A doom scenario that is reinforced by the rising long-term interest rates, which will make companies less inclined to invest and will logically reduce expenditures.
The long-term charts (SPY, QQQ, DIA and IWM on a weekly timeframe)
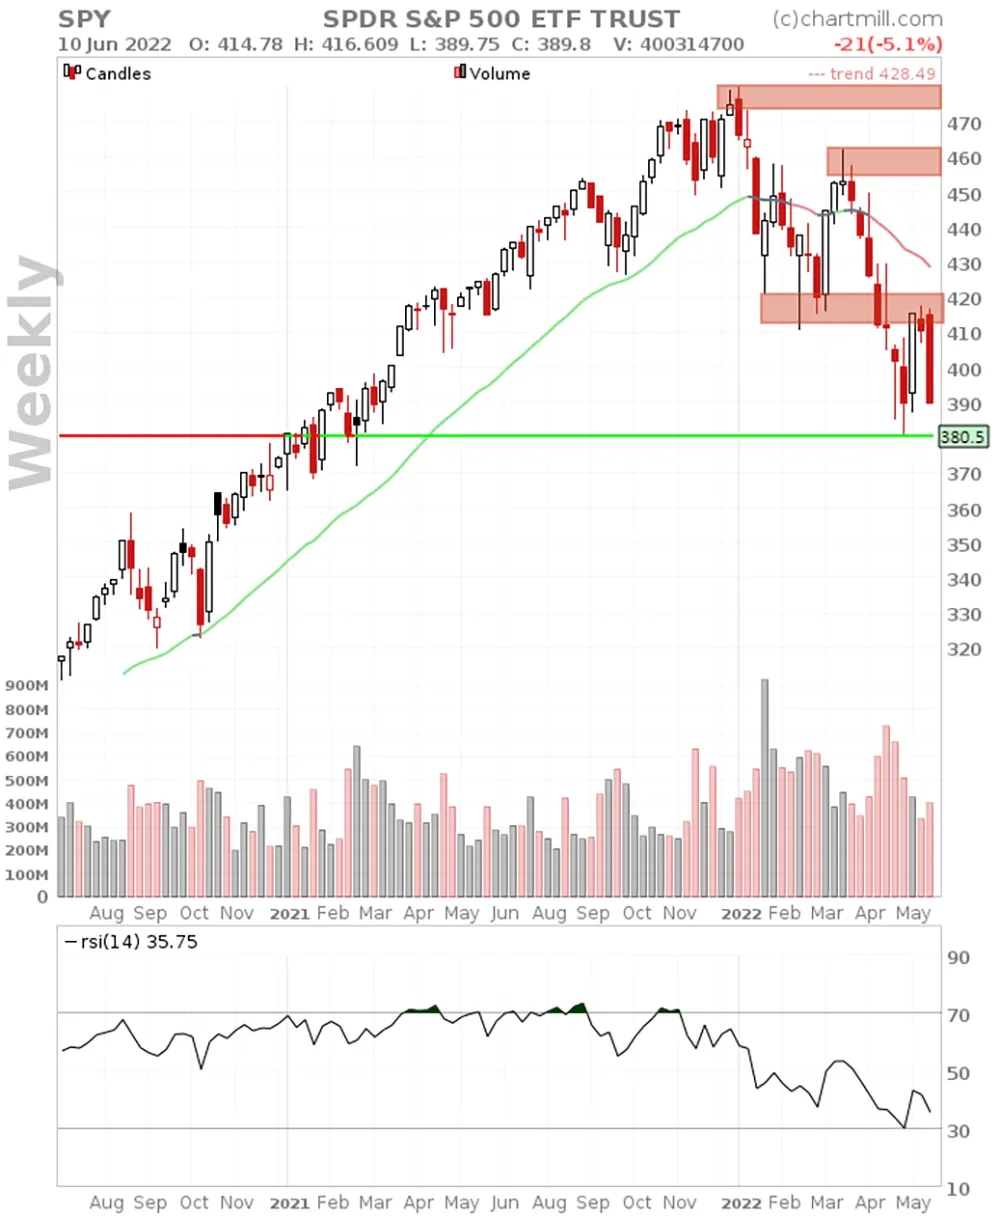
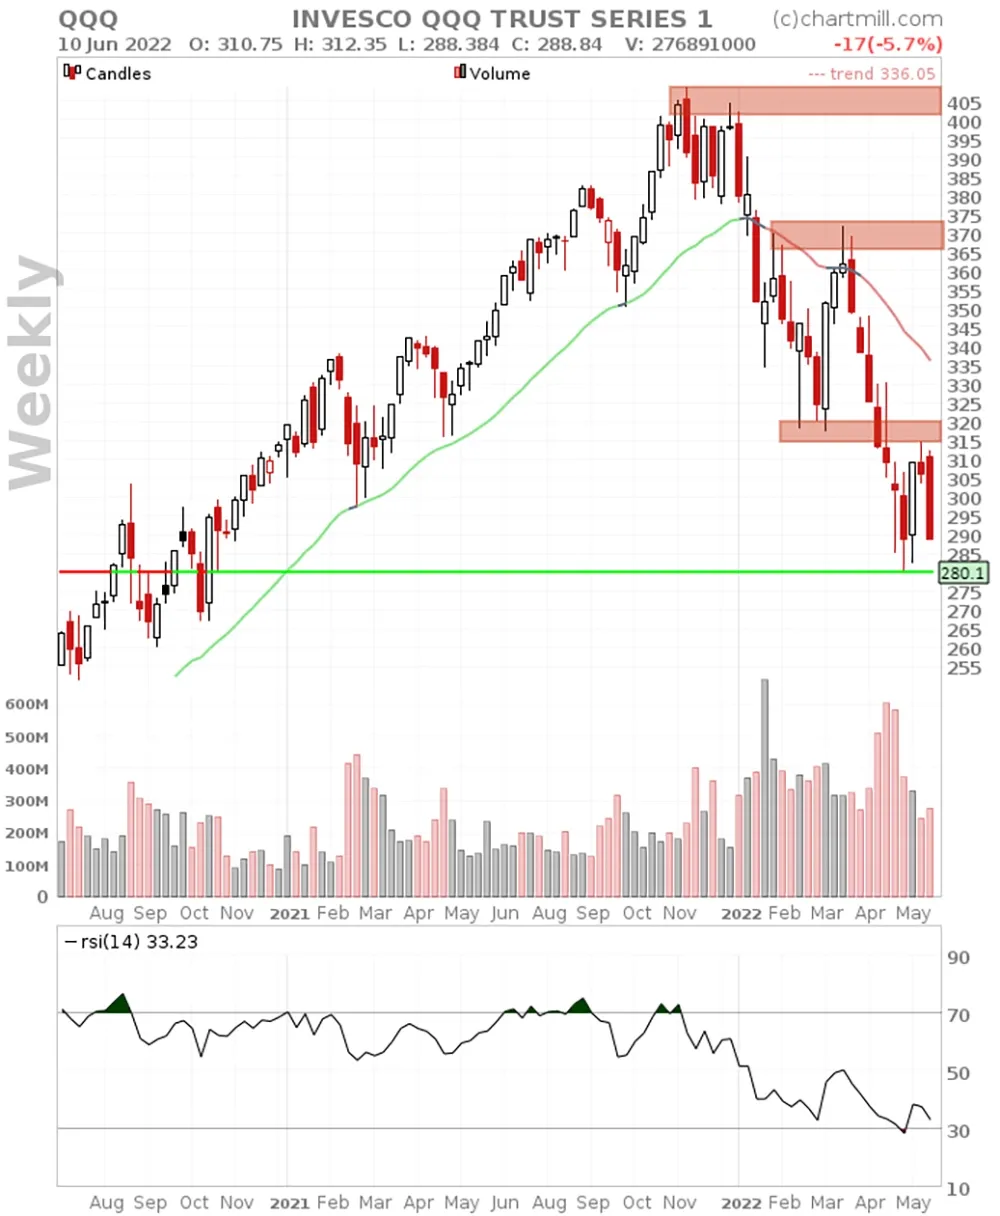
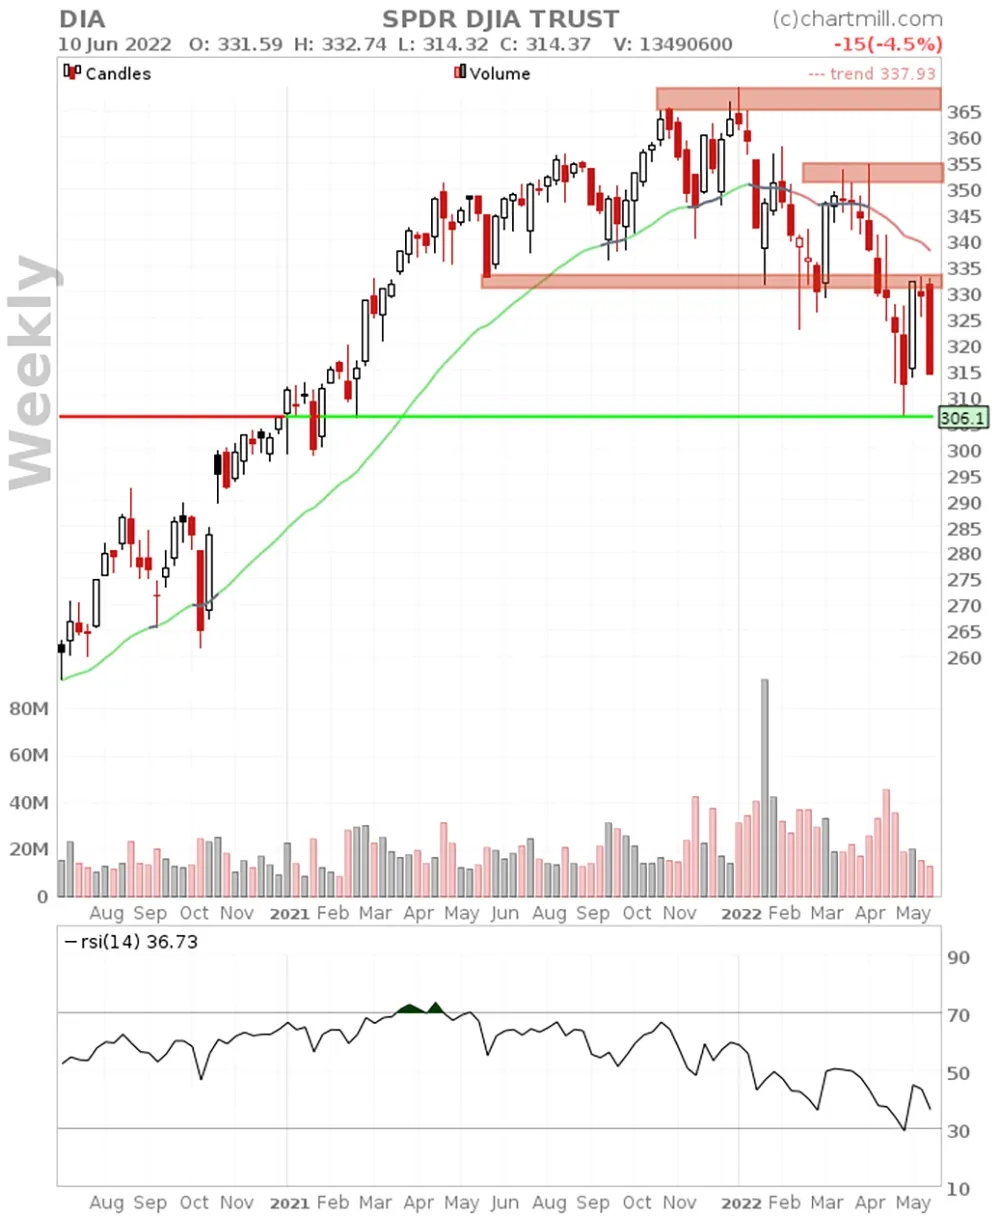
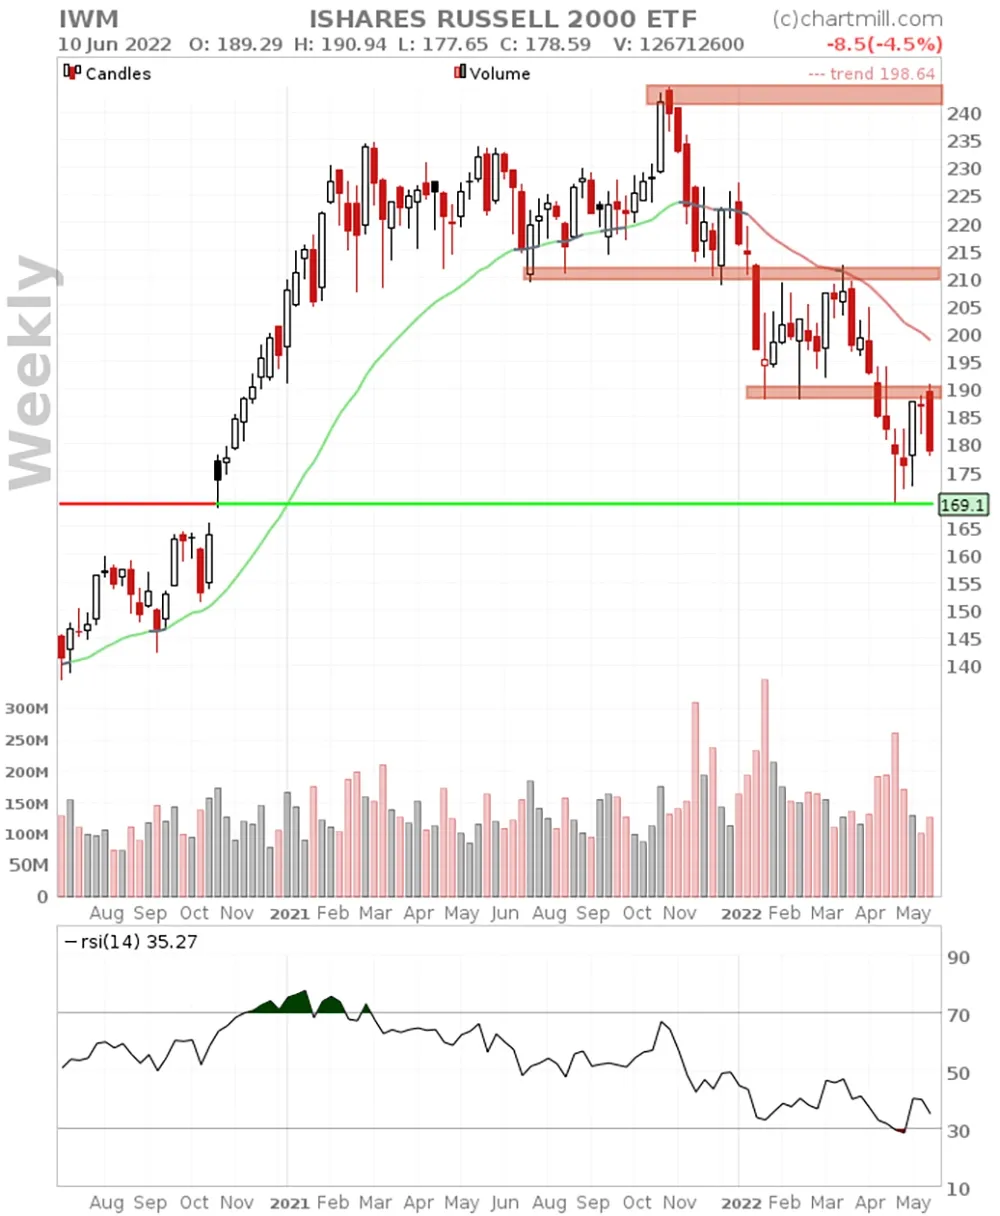
SPY | QQQ | DIA |IWM
- ChartMill Trend Indicator: RED (down)
- Stage Analysis phase: 4 (declining)
The previously mentioned resistance zones (red horizontal markers on the charts above) have played their role perfectly in combination with the negative stock market news and have once again directed the price downwards. Two weeks ago, after a strong weekly rally, we still took into account a further recovery to the level of the falling ChartMill Trend Indicator but that clearly did not happen. Over the past few weeks, up until last Thursday, the indices have been treading water, which in itself is a confirmation of the predominantly negative sentiment.
For the time being, the current long-term bottom (red-green horizontal line) is still intact for all indices and in the coming week this will be a very important line to keep an eye on. If prices fall below this level, it will confirm the formation of a new lower bottom and thus a continuation of the long-term downward price trend.
In a more optimistic scenario, we take into account the formation of a double bottom in the coming weeks. And for those who, against all odds, want to take into account a quick price recovery from these levels, we recommend keeping an eye on the falling ChartMill Trend Indicator as an important resistance level. Selling volumes are still high. The stock market climate therefore remains negative.
The ChartMill Team
![]()
![]()
![]()
![]()
265.76
+0.25 (+0.09%)
621.26
-0.52 (-0.08%)
691.66
-0.58 (-0.08%)
493.42
-1.06 (-0.21%)
Find more stocks in the Stock Screener