Market Monitor Trends and Breadth July 11 BMO
By Kristoff De Turck - reviewed by Aldwin Keppens
Last update: Jul 11, 2025

(All data & visualisations by ChartMill.com)
Daily Market Trend Analysis – July 10, 2025 (After Market Close)
IWM is catching up with SPY and QQQ
Short Term Trend
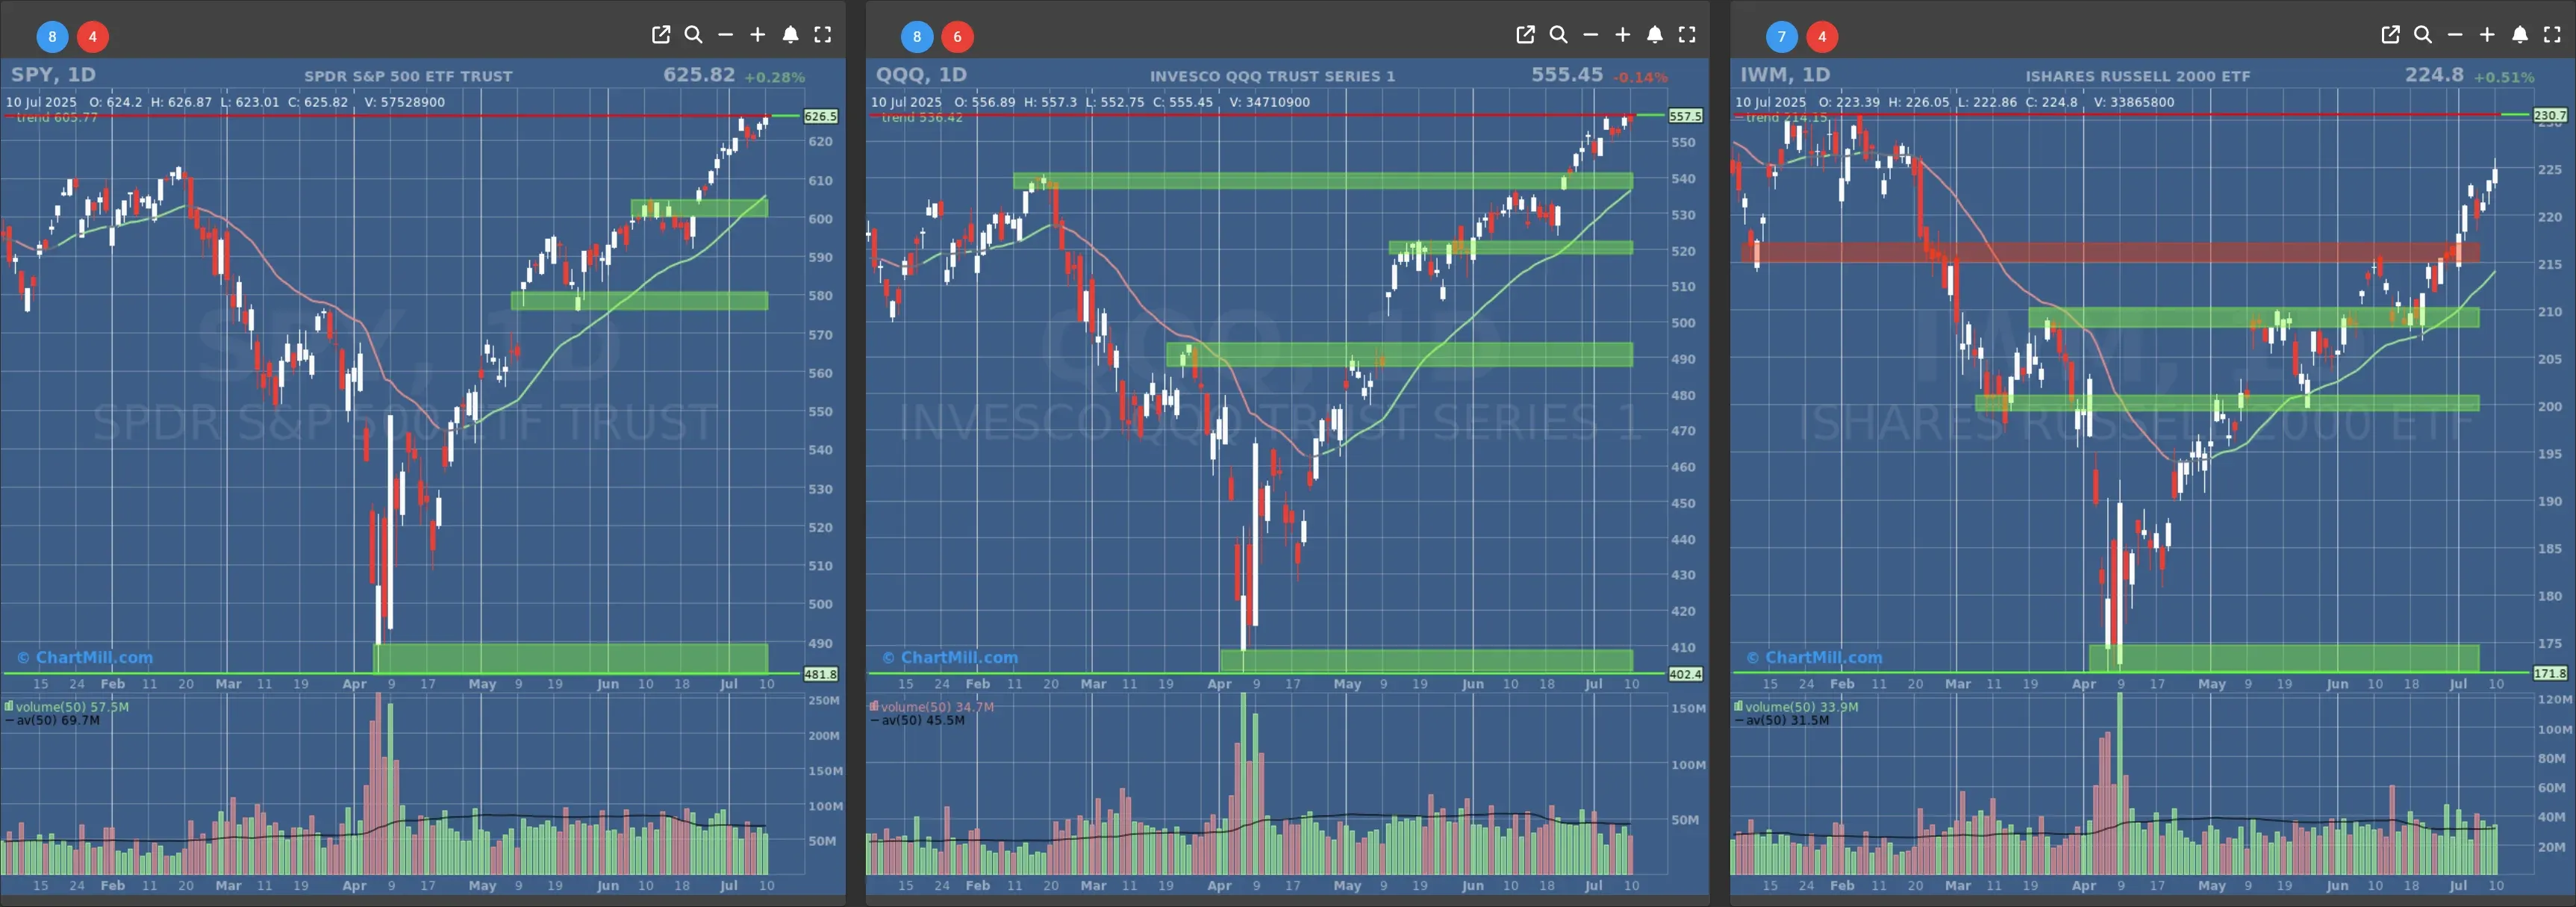
- Short-Term Trend: Bullish (no change)
- Next Support at $600 to $610
- Next Resistance at /
- Volume: Slightly Below Average (50)
- Pattern: Up Day
- Short-Term Trend: Bullish (no change)
- Next Support at $540
- Next Resistance at /
- Volume: Slightly Below Average (50)
- Pattern: Up Day
- Short-Term Trend: Bullish (no change)
- Next Support at $210
- Next Resistance at $215 to $220
- Volume: Slightly Above Average (50)
- Pattern: Up Day
Long Term Trend
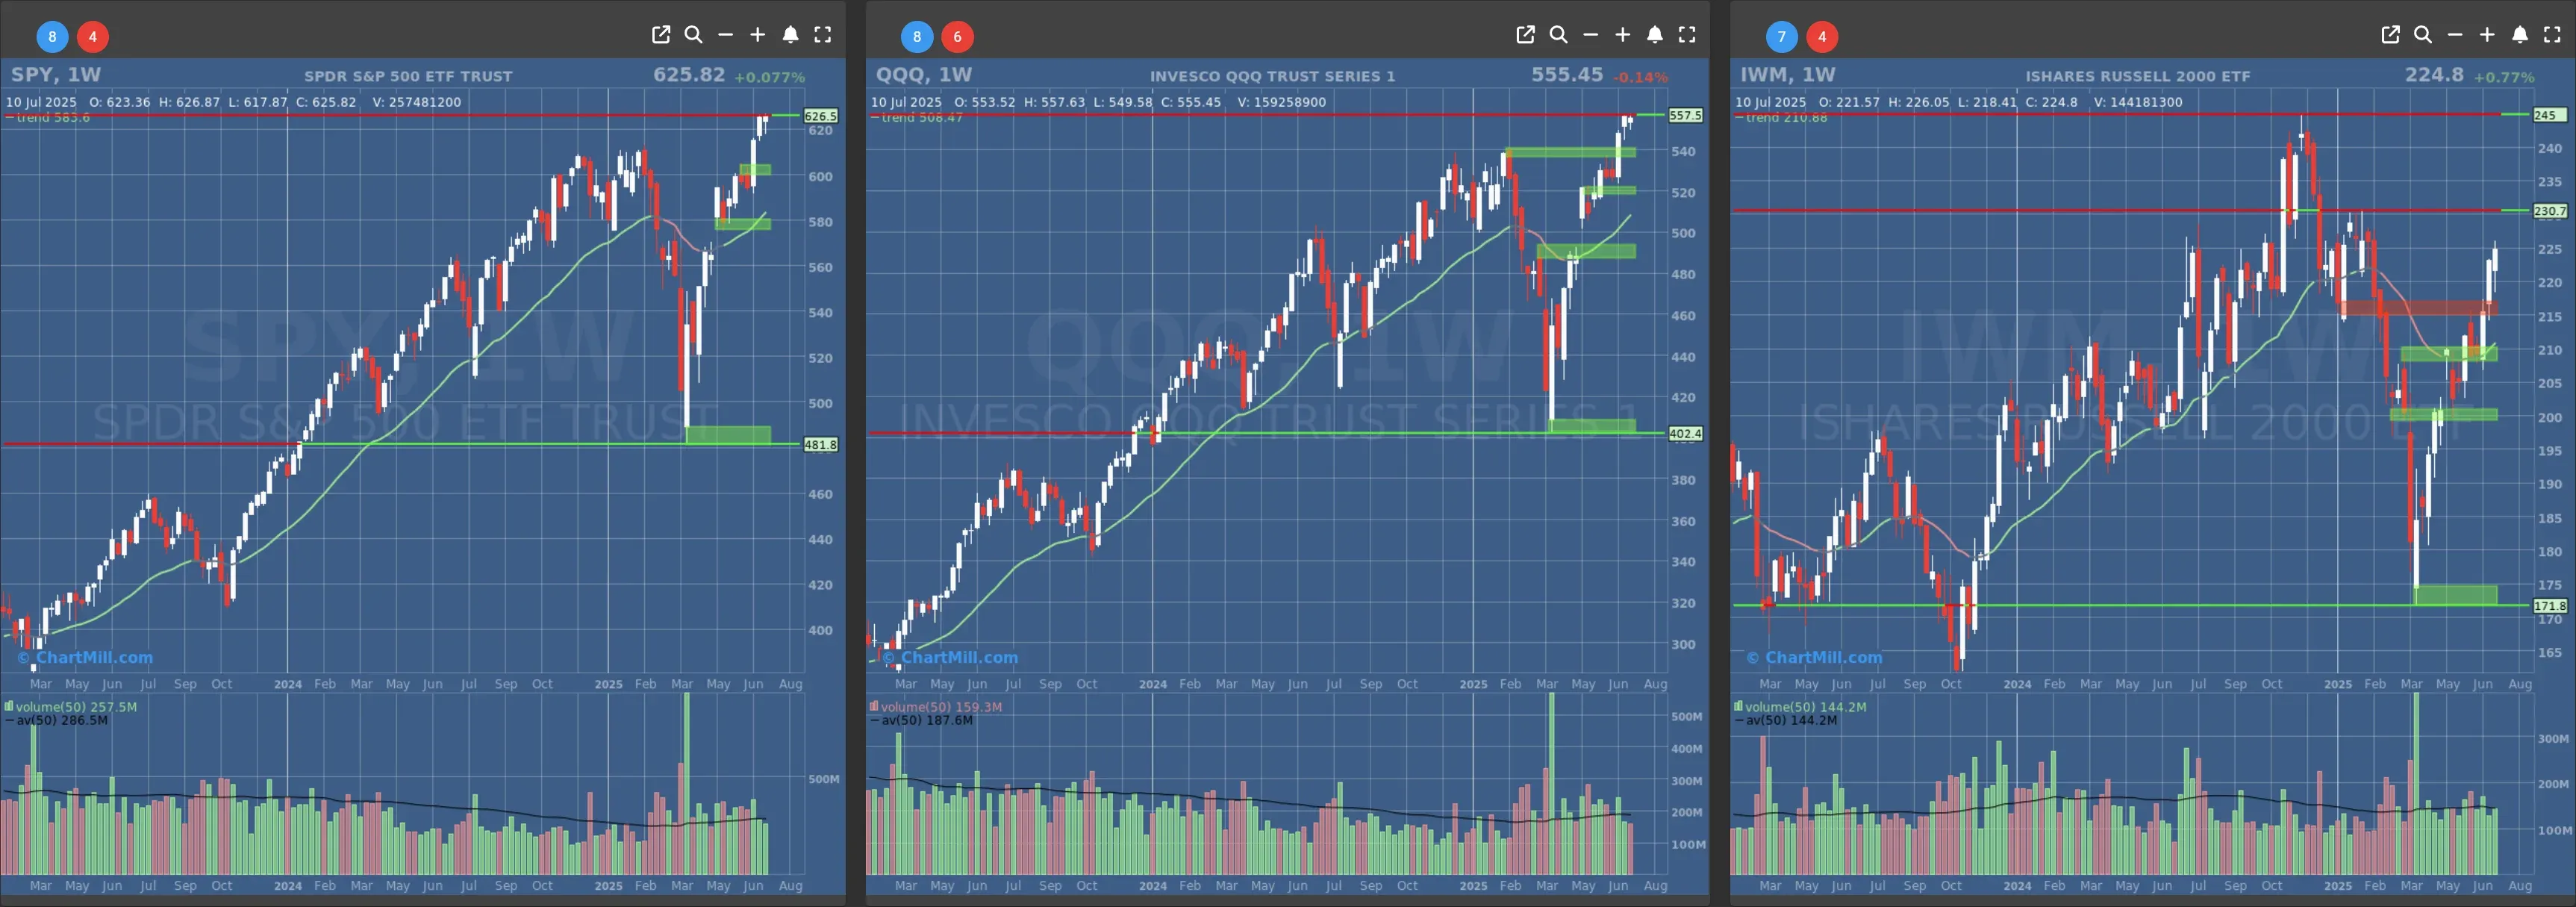
- Long-Term Trend: Positive (no change)
- Long-Term Trend: Positive (no change)
- Long-Term Trend: Positive (no change)
Daily Market Breadth Analysis – July 10, 2025 (After Market Close)
After Wednesday’s strong rebound in the major indices, you’d expect market internals to offer confirmation, and they largely did. Breadth was solid again, though not as enthusiastic as Tuesday’s pop. Underneath the surface, I’m seeing the early signs of some rotation and consolidation.
Let’s dig into what the data from July 10 reveals and how it fits into the bigger picture.
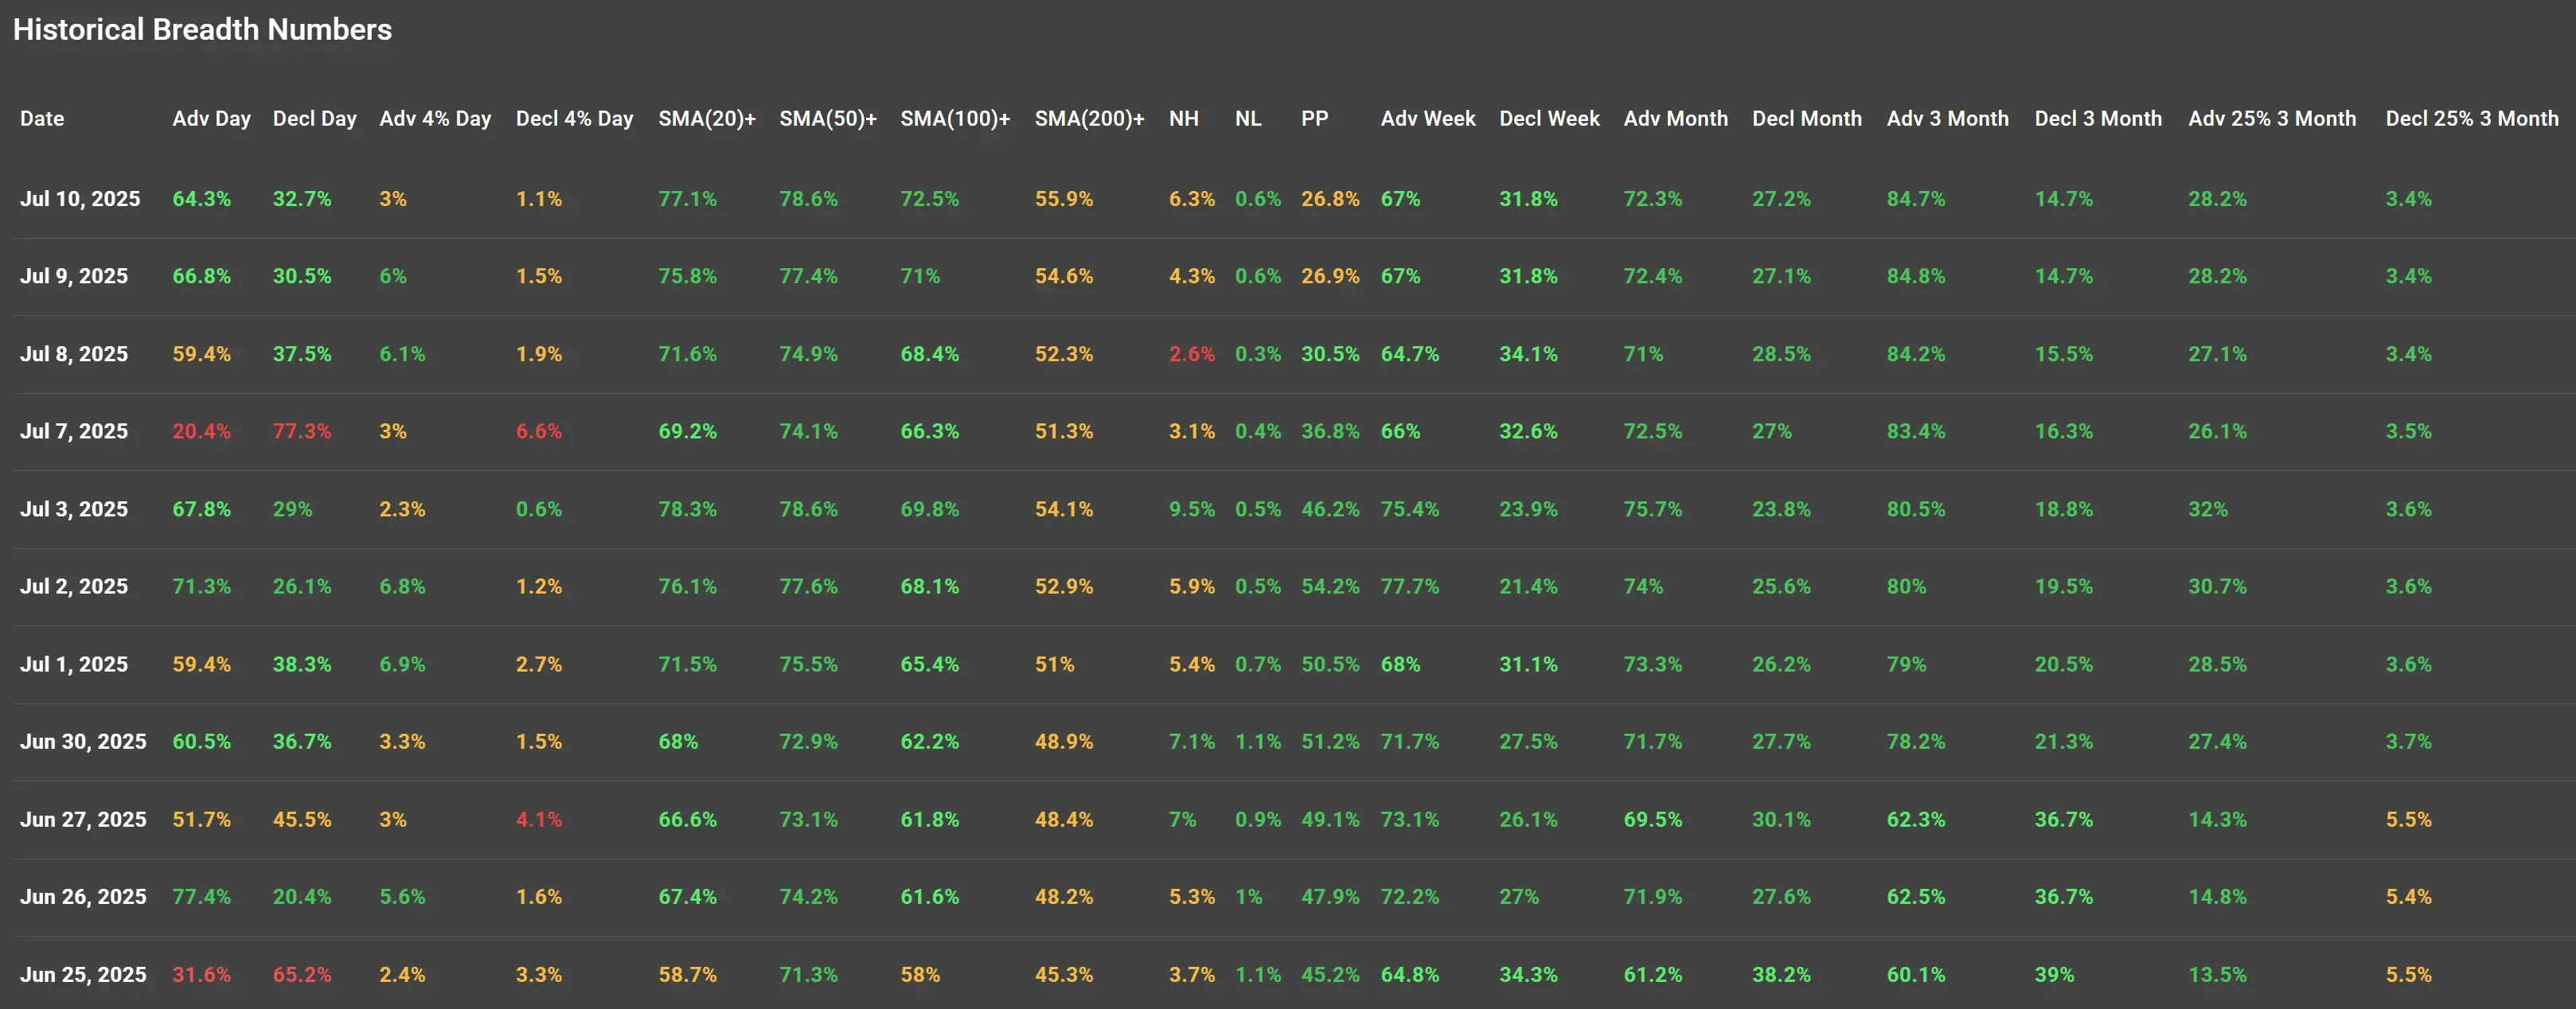
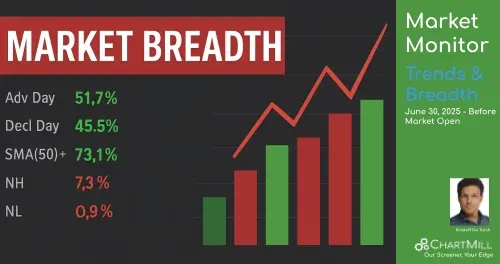
This is another strong showing, but notably - the percentage of stocks above their 20/50/100/200 SMAs remains virtually unchanged from the previous session (July 9). We’re still in bullish territory, but with signs of leveling off.
The Pocket Pivot activity (26.8%) dipped just a bit from 26.9%, which reinforces the idea that while strength remains, fewer stocks are punching through resistance with forceful volume. Translation: the leadership cohort is consolidating.
Comparing to Previous Trading Days
Despite the July 7 panic sell-off - where only 20.4% of stocks advanced and 77.3% declined - Pocket Pivot activity actually spiked to 36.8%, the highest of the last 10 trading days. That was a surprising and bullish divergence under the hood.
It suggested that while broader sentiment was shaken, institutional accumulation quietly picked up in select names, often a sign of early positioning.
Here's how that developed over the past week:
-
July 7: Breadth collapsed on the surface, but 36.8% PP = big buyers stepped in beneath the noise.
-
July 8: Bounce day with breadth stabilizing (59.4% advancers), PP drops to 30.5%, still strong.
-
July 9: Breakout strength with 66.8% advancers, PP slightly lower at 26.9%.
-
July 10: Momentum holds (64.3% advancers), PP at 26.8%.
The message here is clear: while price volatility spiked around tariff headlines, smart money didn’t retreat, it got selective. The high Pocket Pivot reading on July 7 was a red flag for bears and a potential signal for swing traders to get back on watch.
Sentiment Meets Stats
The tariff rhetoric from President Trump, while loud, didn’t shake breadth data after Monday’s fallout. Market internals quickly stabilized, showing that investors are still buying dips, especially in AI, tech, and industrials, where big names like Delta (DAL), AMD (AMD), and Nvidia (NVDA) helped sentiment turn.
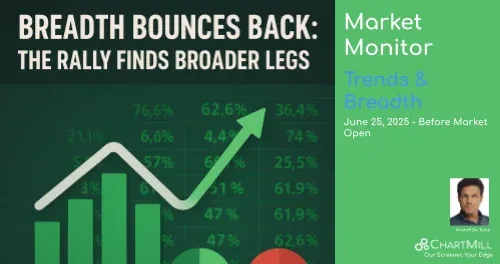
The breadth thrust on July 9 (Advancers at 66.8%) was a key moment. Historically, these types of spikes tend to precede a continuation move and while July 10’s numbers weren’t as euphoric, they held the line.
That’s bullish.
What to Watch Next
-
Breadth fatigue or breakout? If Pocket Pivots stay above 25% and SMA participation doesn’t drop, this market likely continues to climb the wall of worry.
-
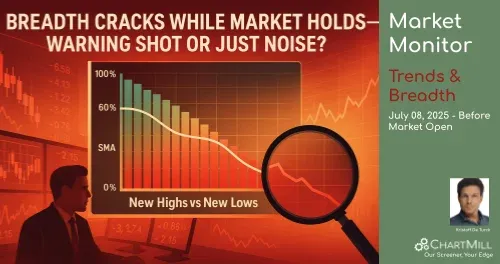
New highs expanding? At 6.3%, New Highs are improving, but still not exploding. If we push past 10% in the coming sessions, that’d confirm a new leg higher.
-
Sector Rotation Alert: Watch if defensive sectors begin to outperform, it would suggest early signs of market hedging.
Final Thought
The data doesn’t lie: breadth is strong, leadership is present, and sentiment is recovering. But there’s a subtle shift underway, strength is becoming more selective, and big breakouts (as shown by fewer new highs and slightly lower Pocket Pivot percentages) are slowing.
This isn’t the time to go all-in blindly. Stay with leading names, tighten stops on extended runners, and watch the breadth trends closely. If this rally is for real, we’ll see even broader participation, not just a handful of big names doing the heavy lifting.
Let’s see what Friday brings.
Kristoff - Co-founder, ChartMill
Next to read: Market Monitor News, July 11
221.7
-3.1 (-1.38%)
554.2
-1.25 (-0.23%)
623.62
-2.2 (-0.35%)
Find more stocks in the Stock Screener
IWM Latest News and Analysis
 3 days ago - ChartmillMarket Monitor Trends and Breadth July 11 BMO
Market breadth continues to support the rally… but not without friction.
 4 days ago - ChartmillMarket Monitor Trends and Breadth July 10 BMO
Bullish Recovery Confirmed, But Caution Lingers Under the Hood
 5 days ago - ChartmillMarket Monitor Trends and Breadth July 09 BMO
Market Breadth Holds Firm as Volatility Flares But Watch for a Momentum Stall
 6 days ago - ChartmillMarket Monitor Trends and Breadth July 08 BMO
Breadth Breakdown: One Bad Day Doesn’t Break the Bull - Yet
 12 days ago - ChartmillMarket Monitor Trends and Breadth July 02 BMO
Breadth Check: Market Still Holding Up — But the Momentum Is Looking a Bit Tired
 13 days ago - ChartmillMarket Monitor Trends and Breadth July 01 BMO
Market Breadth Holds Strong as Quarter Ends With Momentum
 14 days ago - ChartmillMarket Monitor Trends and Breadth June 30 BMO
Stocks Hold the Line, but Under the Surface? Mixed Signals Persist
 17 days ago - ChartmillMarket Monitor Trends and Breadth June 27
Market Breadth Roars Back: Bulls Reclaim Control, But Will They Hold the Line?
 18 days ago - ChartmillMarket Monitor Trends and Breadth June 26
Breadth Falters Again as Bulls Lose Steam After One-Day Comeback
 19 days ago - ChartmillMarket Monitor Trends BMO (SPY, QQQ, IWM) and Breadth June 25
Breadth Bounces Back: The Rally Finds Broader Legs
 20 days ago - ChartmillMarket Monitor Trends BMO (SPY, QQQ, IWM) and Breadth June 24
Market breadth bounces back, more stocks trading above key averages as bullish momentum builds after last week's chop.
