Market Monitor Trends and Breadth June 26
By Kristoff De Turck - reviewed by Aldwin Keppens
Last update: Jun 26, 2025
(All data & visualisations by ChartMill.com)
Daily Market Trend Analysis – June 25, 2025 (After Market Close)
The existing resistance levels are playing their role to the fullest...
Short Term Trend
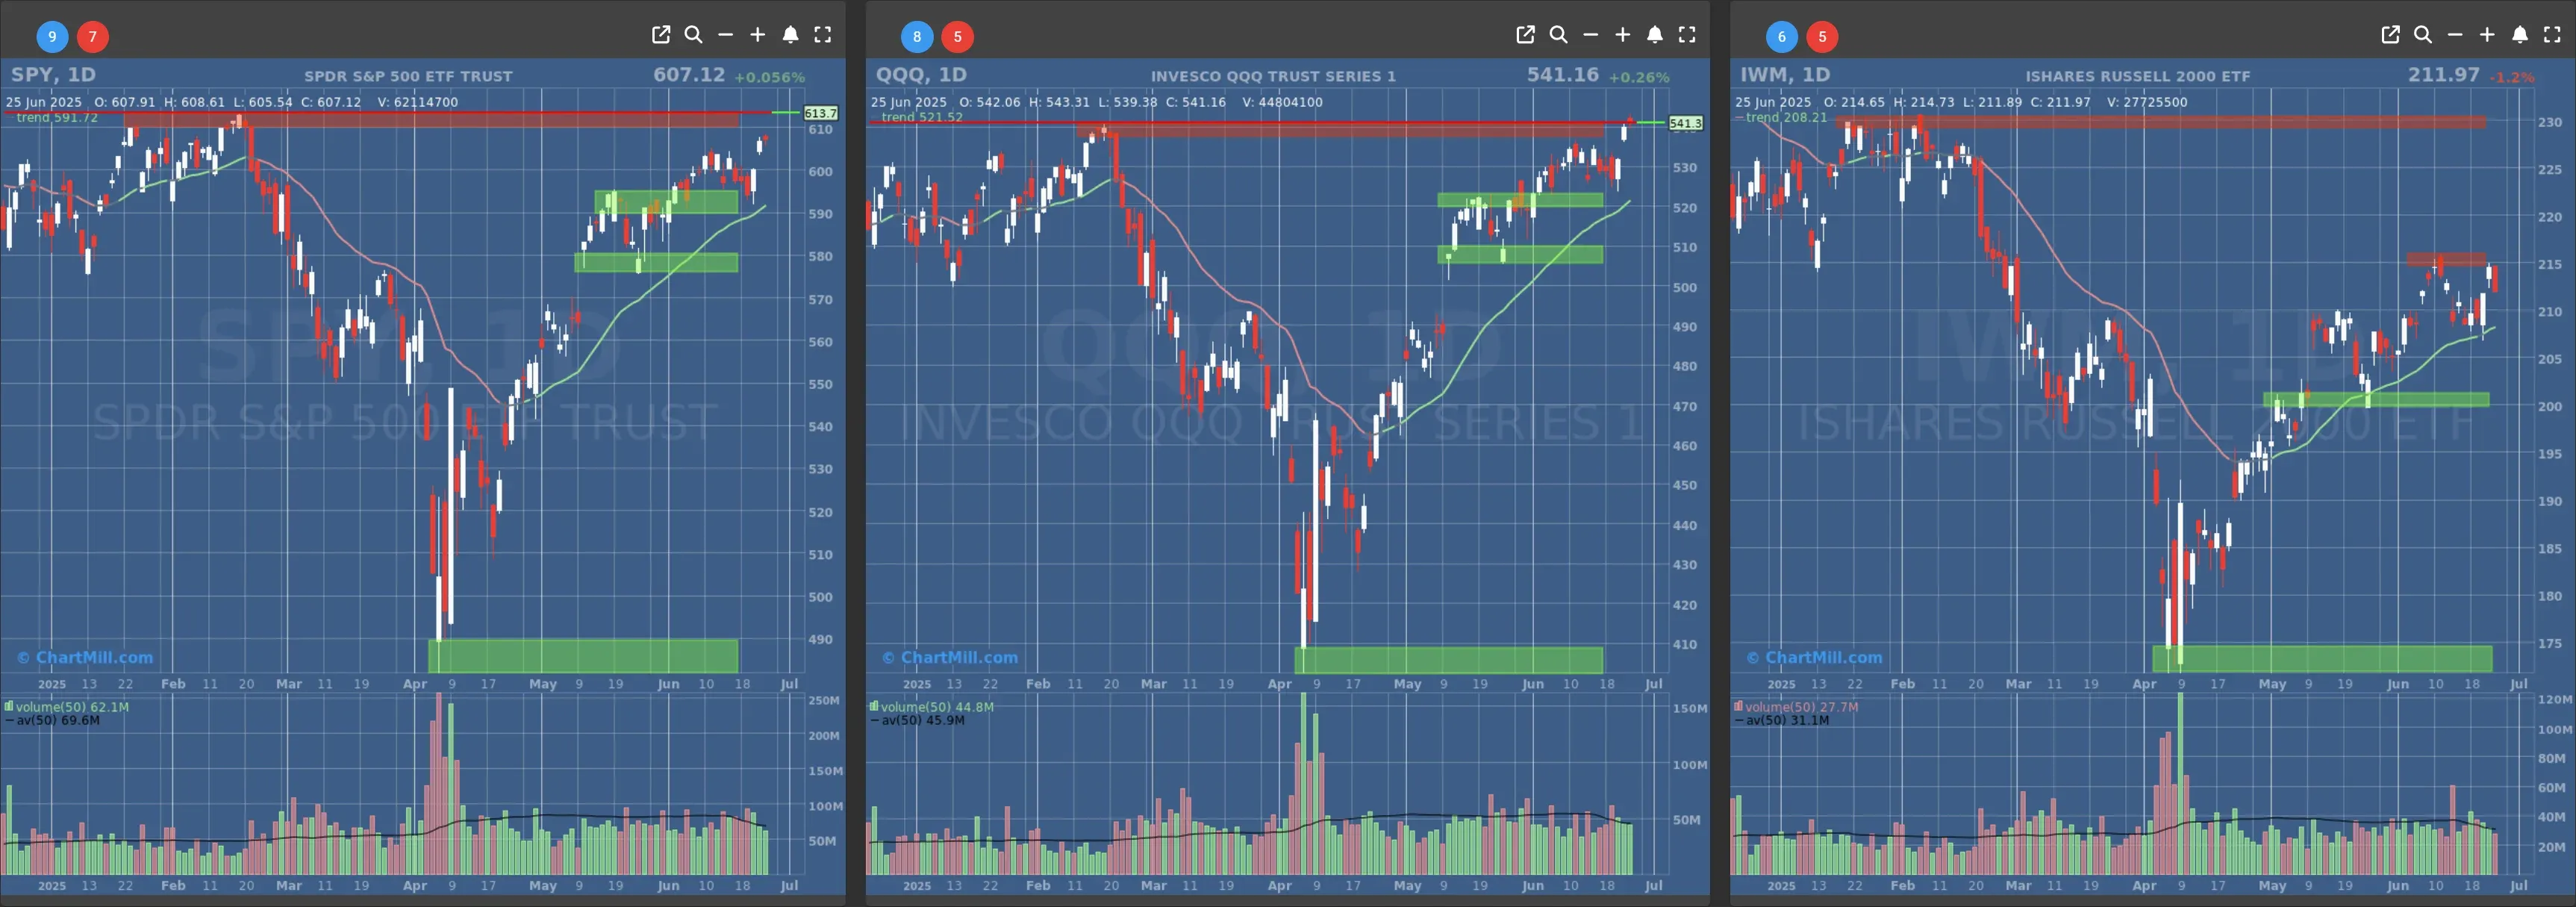
- Short-Term Trend: Bullish (no change)
- Next Support at $580
- Next Resistance at $610
- Volume: Slightly Below Average (50)
- Pattern: Hanging Man Candlestick
- Short-Term Trend: Bullish (no change)
- Next Support at $520
- Next Resistance at $540
- Volume: At Average (50)
- Pattern: Doji Candle
- Short-Term Trend: Bullish (no change)
- Next Support at $210 & $205
- Next Resistance at $215 & $230
- Volume: Slightly Below Average (50)
- Pattern: Down Day
Long Term Trend
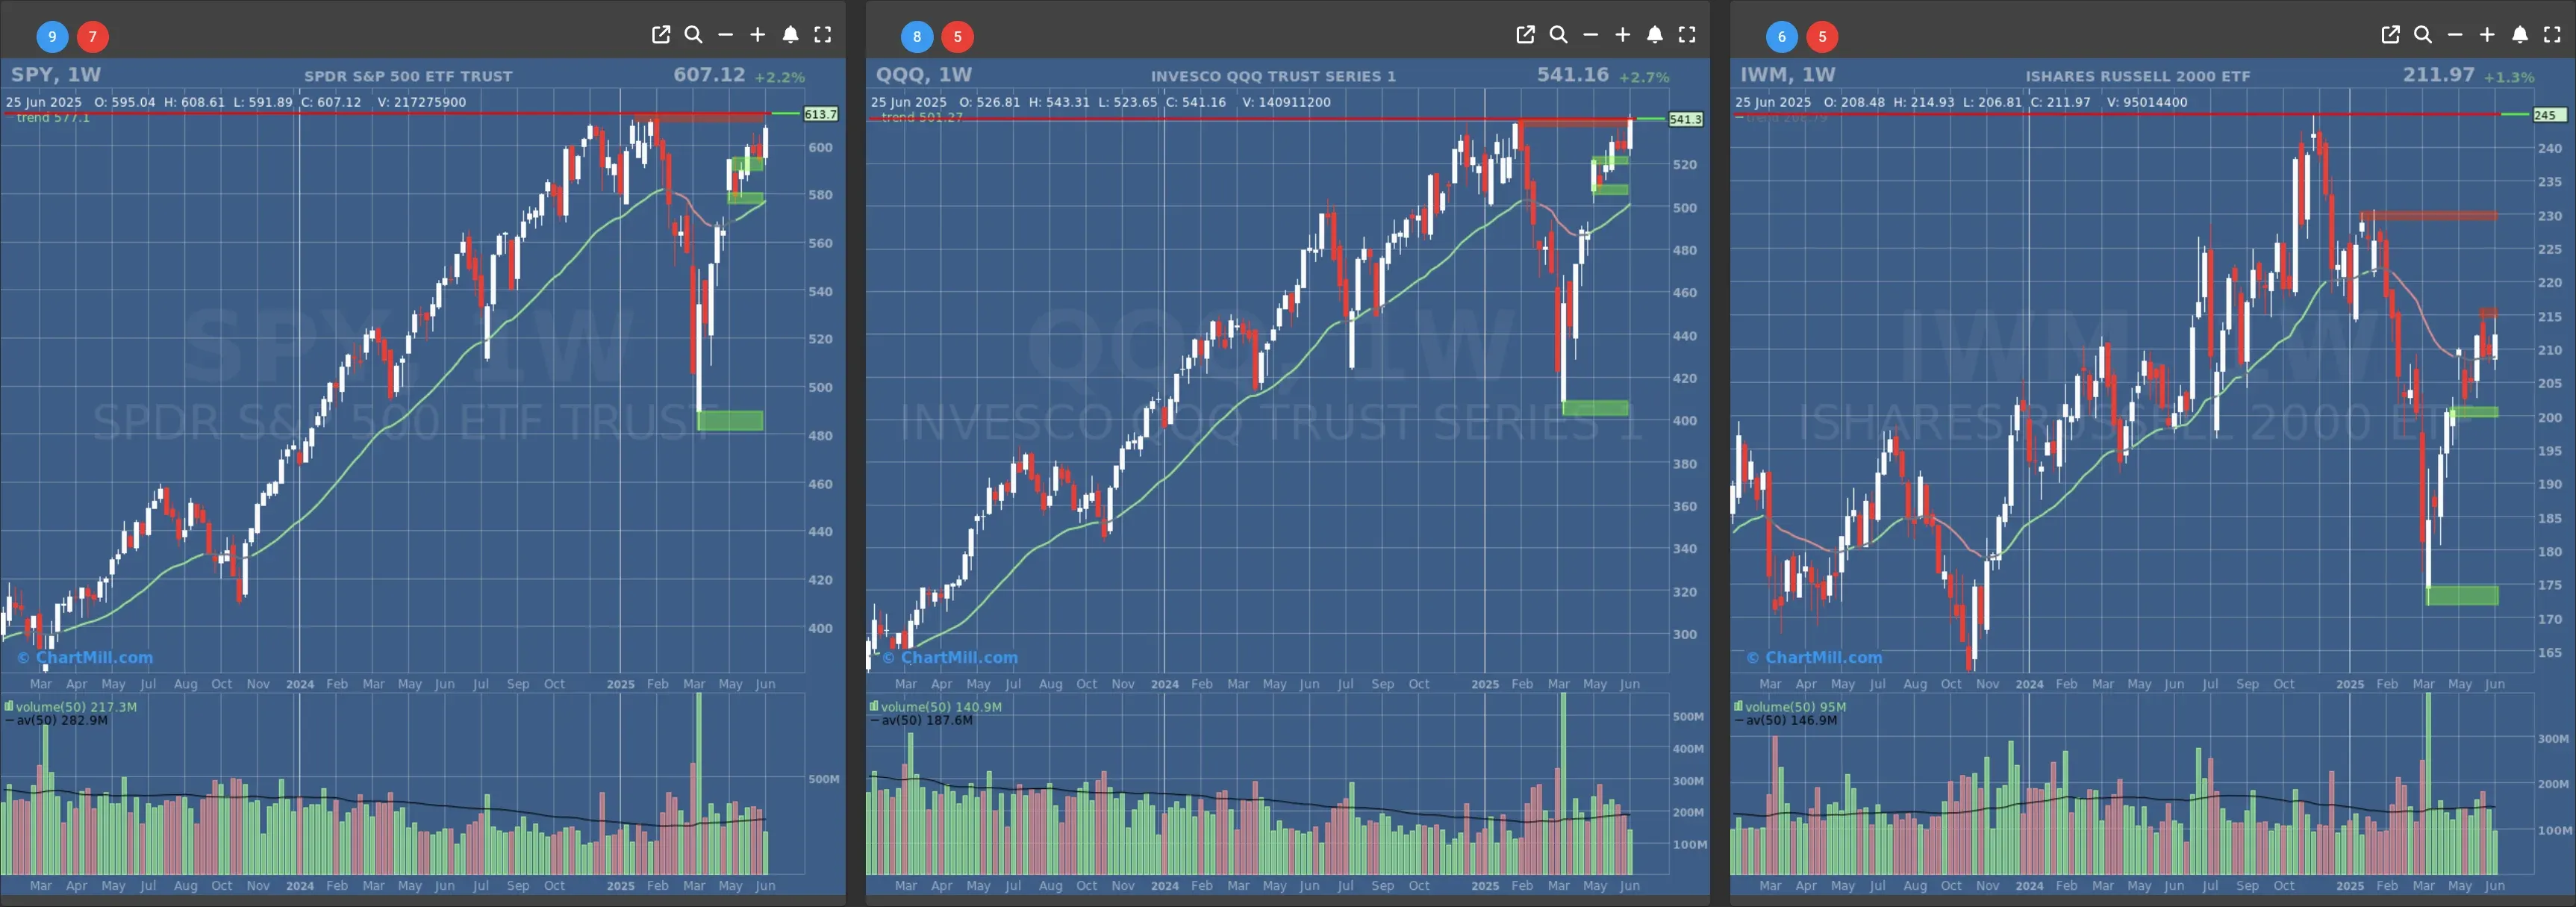
- Long-Term Trend: Positive (no change)
- Long-Term Trend: Positive (no change)
- Long-Term Trend: Neutral (no change)
Daily Market Breadth Analysis – June 25, 2025 (After Market Close)
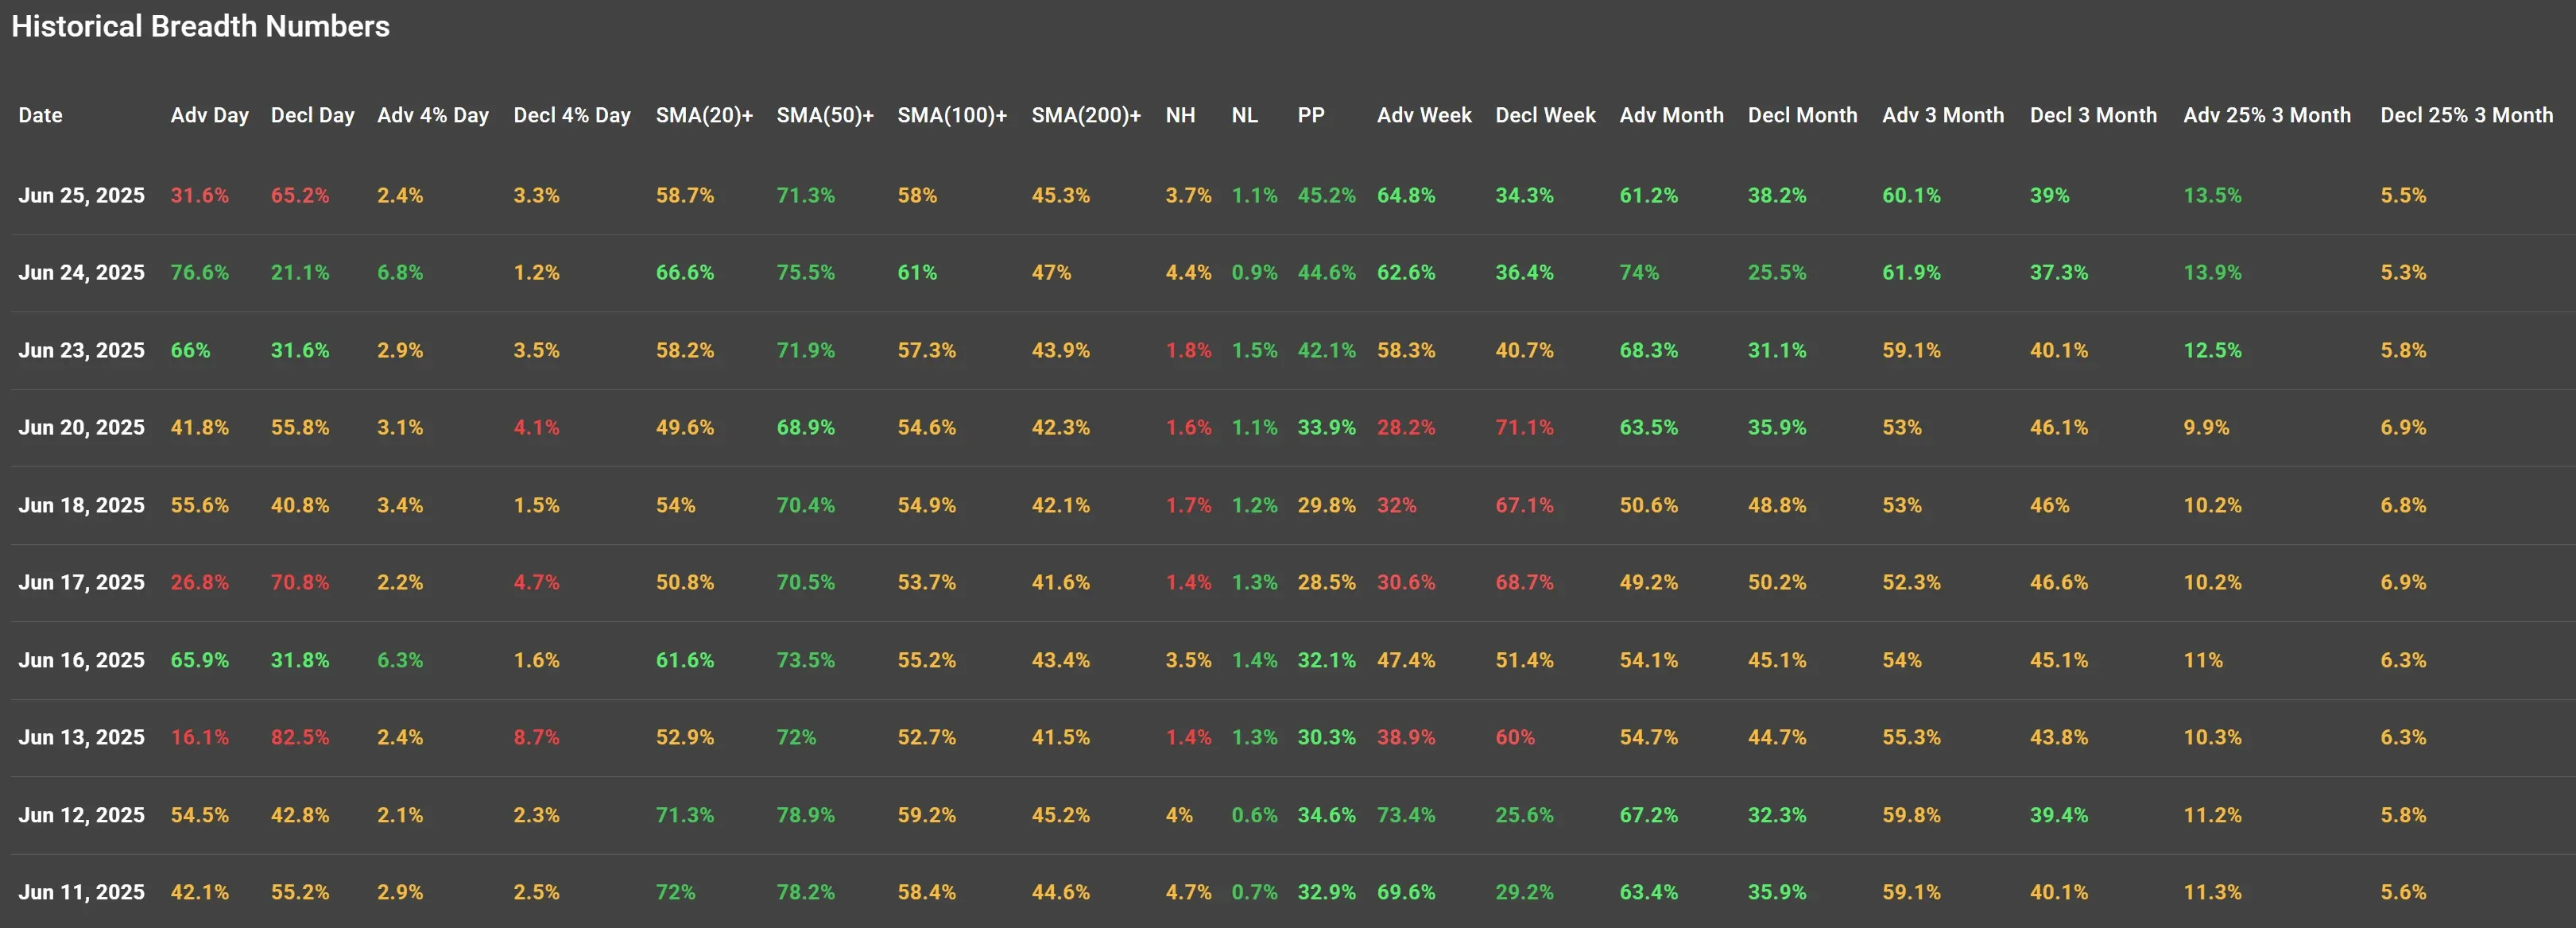
You’d think after Tuesday’s powerful breadth surge - where over 75% of stocks advanced - we might see some follow-through.
But no. On Wednesday, the market once again showed its split personality. If you were watching only the indices, the picture might have seemed neutral. But under the hood? Not great.
From Broad Strength… Back to Weak Breadth
So what are we looking at here? A complete 180 in participation. On Tuesday, nearly 77% of the market was in the green, a clear sign of broad-based strength. By Wednesday, that collapsed to just 31.6%. That’s a nasty swing.
While price levels on the indices held reasonably well, we’re again dealing with a declining percentage of stocks holding their ground above major moving averages. For example, only 58% of stocks are now above their 100-day SMA, and that number continues to drift lower.
This isn’t panic territory yet, but it is weakening breadth, and that never happens in a vacuum.
Advance/Decline Momentum: Cooling Off
The week-over-week numbers show a similar picture. The 5-day average for advancing stocks has started to contract again:
-
Adv Week: Down to 64.8% from 62.6% the day before—yes, a small bump. But it’s fragile.
-
Decl Week: Back up to 34.3%, erasing much of Tuesday’s drop.
-
Adv 25% over 3 months: Edged slightly lower to 13.5% from 13.9%. That confirms fewer stocks are delivering outsized gains.
The "up volume" we saw on Tuesday now looks more like a single-day anomaly than the start of a trend.
Short-Term Pop, Long-Term Grind
It’s interesting to see that even as daily breadth fluctuates wildly, the longer-term metrics are holding relatively steady:
-
50SMA+: 71.3% — slightly lower, but still showing decent medium-term strength.
-
200SMA+: 45.3% — this hasn’t budged much in weeks, a classic sign of broad indecision. We're not trending down, but we're not convincingly climbing either.
Momentum is being squeezed toward a pivot—either we get a genuine breakout and breadth follows, or this resolves downward with market leaders losing their grip.
Context: Sentiment Still Vulnerable
There wasn’t a major catalyst on Wednesday that justified the broad drop in advancing stocks, but remember: Tuesday’s strength came on the heels of a relatively calm session and strong tech-led optimism (thanks again to Nvidia). Wednesday may have simply been a digestion day, a classic post-bounce cooldown.
Also, investor sensitivity to headlines around tariffs, Fed policy, and geopolitical tensions (especially the Israel-Iran situation) remains very high. That makes breadth swings more abrupt and less predictable.
Bottom Line
Tuesday looked like a turning point. Wednesday reminded us that confidence is fragile. Market breadth is still stuck in a frustrating cycle: enough strength to prevent a breakdown, but not enough participation to fuel a sustained breakout.
Until we see several consecutive days of solid breadth, especially with more stocks reclaiming the 100- and 200-day SMAs, I remain cautiously skeptical.
The trend hasn’t broken, but it’s definitely wobbling.
Kristoff - Co-founder, ChartMill
Next to read: Market Monitor News, June 26
221.7
-3.1 (-1.38%)
554.2
-1.25 (-0.23%)
623.62
-2.2 (-0.35%)
Find more stocks in the Stock Screener
IWM Latest News and Analysis
 3 days ago - ChartmillMarket Monitor Trends and Breadth July 11 BMO
Market breadth continues to support the rally… but not without friction.
 4 days ago - ChartmillMarket Monitor Trends and Breadth July 10 BMO
Bullish Recovery Confirmed, But Caution Lingers Under the Hood
 5 days ago - ChartmillMarket Monitor Trends and Breadth July 09 BMO
Market Breadth Holds Firm as Volatility Flares But Watch for a Momentum Stall
 7 days ago - ChartmillMarket Monitor Trends and Breadth July 08 BMO
Breadth Breakdown: One Bad Day Doesn’t Break the Bull - Yet
 12 days ago - ChartmillMarket Monitor Trends and Breadth July 02 BMO
Breadth Check: Market Still Holding Up — But the Momentum Is Looking a Bit Tired
 13 days ago - ChartmillMarket Monitor Trends and Breadth July 01 BMO
Market Breadth Holds Strong as Quarter Ends With Momentum
 14 days ago - ChartmillMarket Monitor Trends and Breadth June 30 BMO
Stocks Hold the Line, but Under the Surface? Mixed Signals Persist
 17 days ago - ChartmillMarket Monitor Trends and Breadth June 27
Market Breadth Roars Back: Bulls Reclaim Control, But Will They Hold the Line?
 18 days ago - ChartmillMarket Monitor Trends and Breadth June 26
Breadth Falters Again as Bulls Lose Steam After One-Day Comeback
 19 days ago - ChartmillMarket Monitor Trends BMO (SPY, QQQ, IWM) and Breadth June 25
Breadth Bounces Back: The Rally Finds Broader Legs
 20 days ago - ChartmillMarket Monitor Trends BMO (SPY, QQQ, IWM) and Breadth June 24
Market breadth bounces back, more stocks trading above key averages as bullish momentum builds after last week's chop.
