Market Monitor Trends BMO (SPY, QQQ, IWM) and Breadth June 23
By Kristoff De Turck - reviewed by Aldwin Keppens
Last update: Jun 23, 2025

(All data & visualisations by ChartMill.com)
Daily Market Trend Analysis – June 20, 2025 (After Market Close)
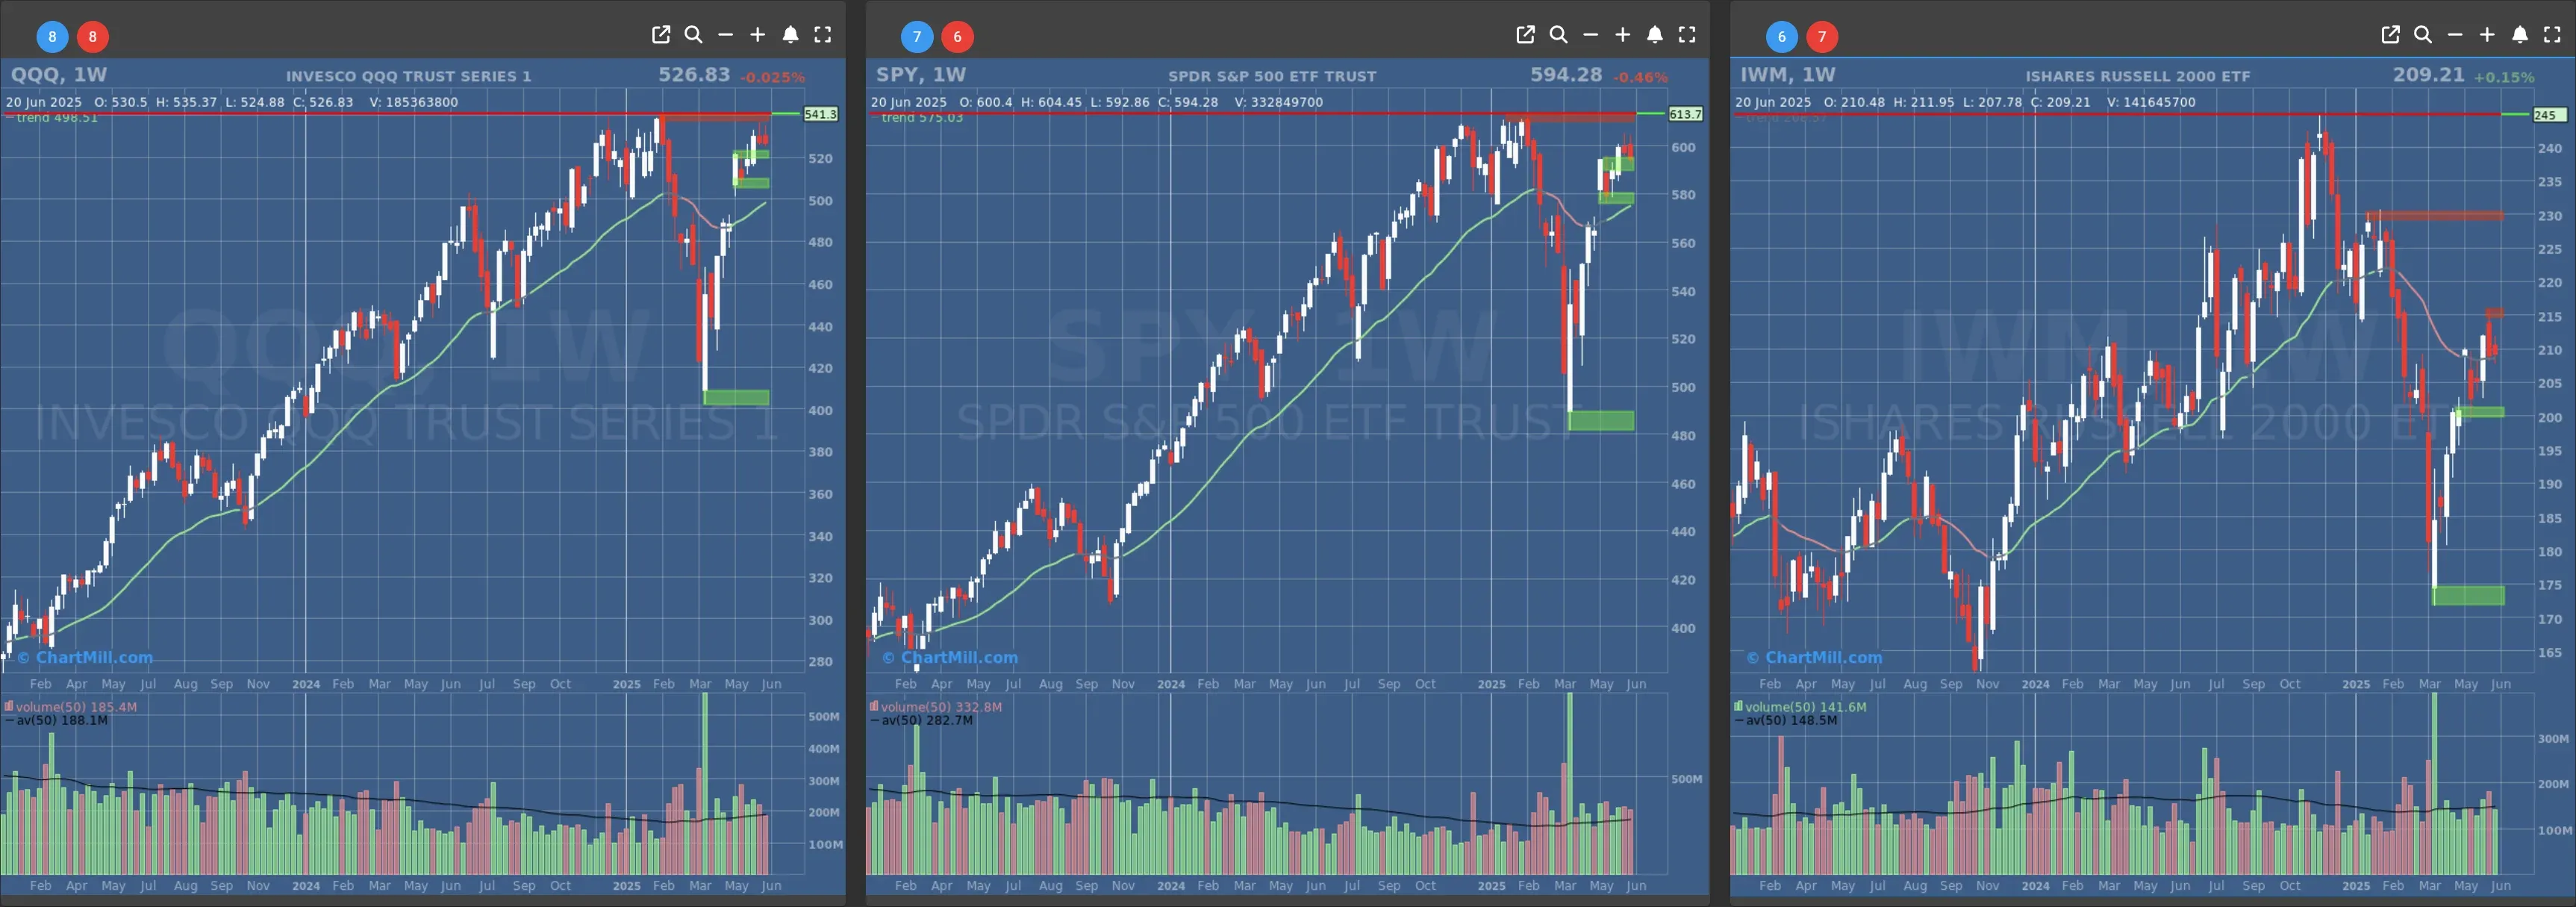
SPY, QQQ and IWM: still within their short-term trading range.
Short Term Trend
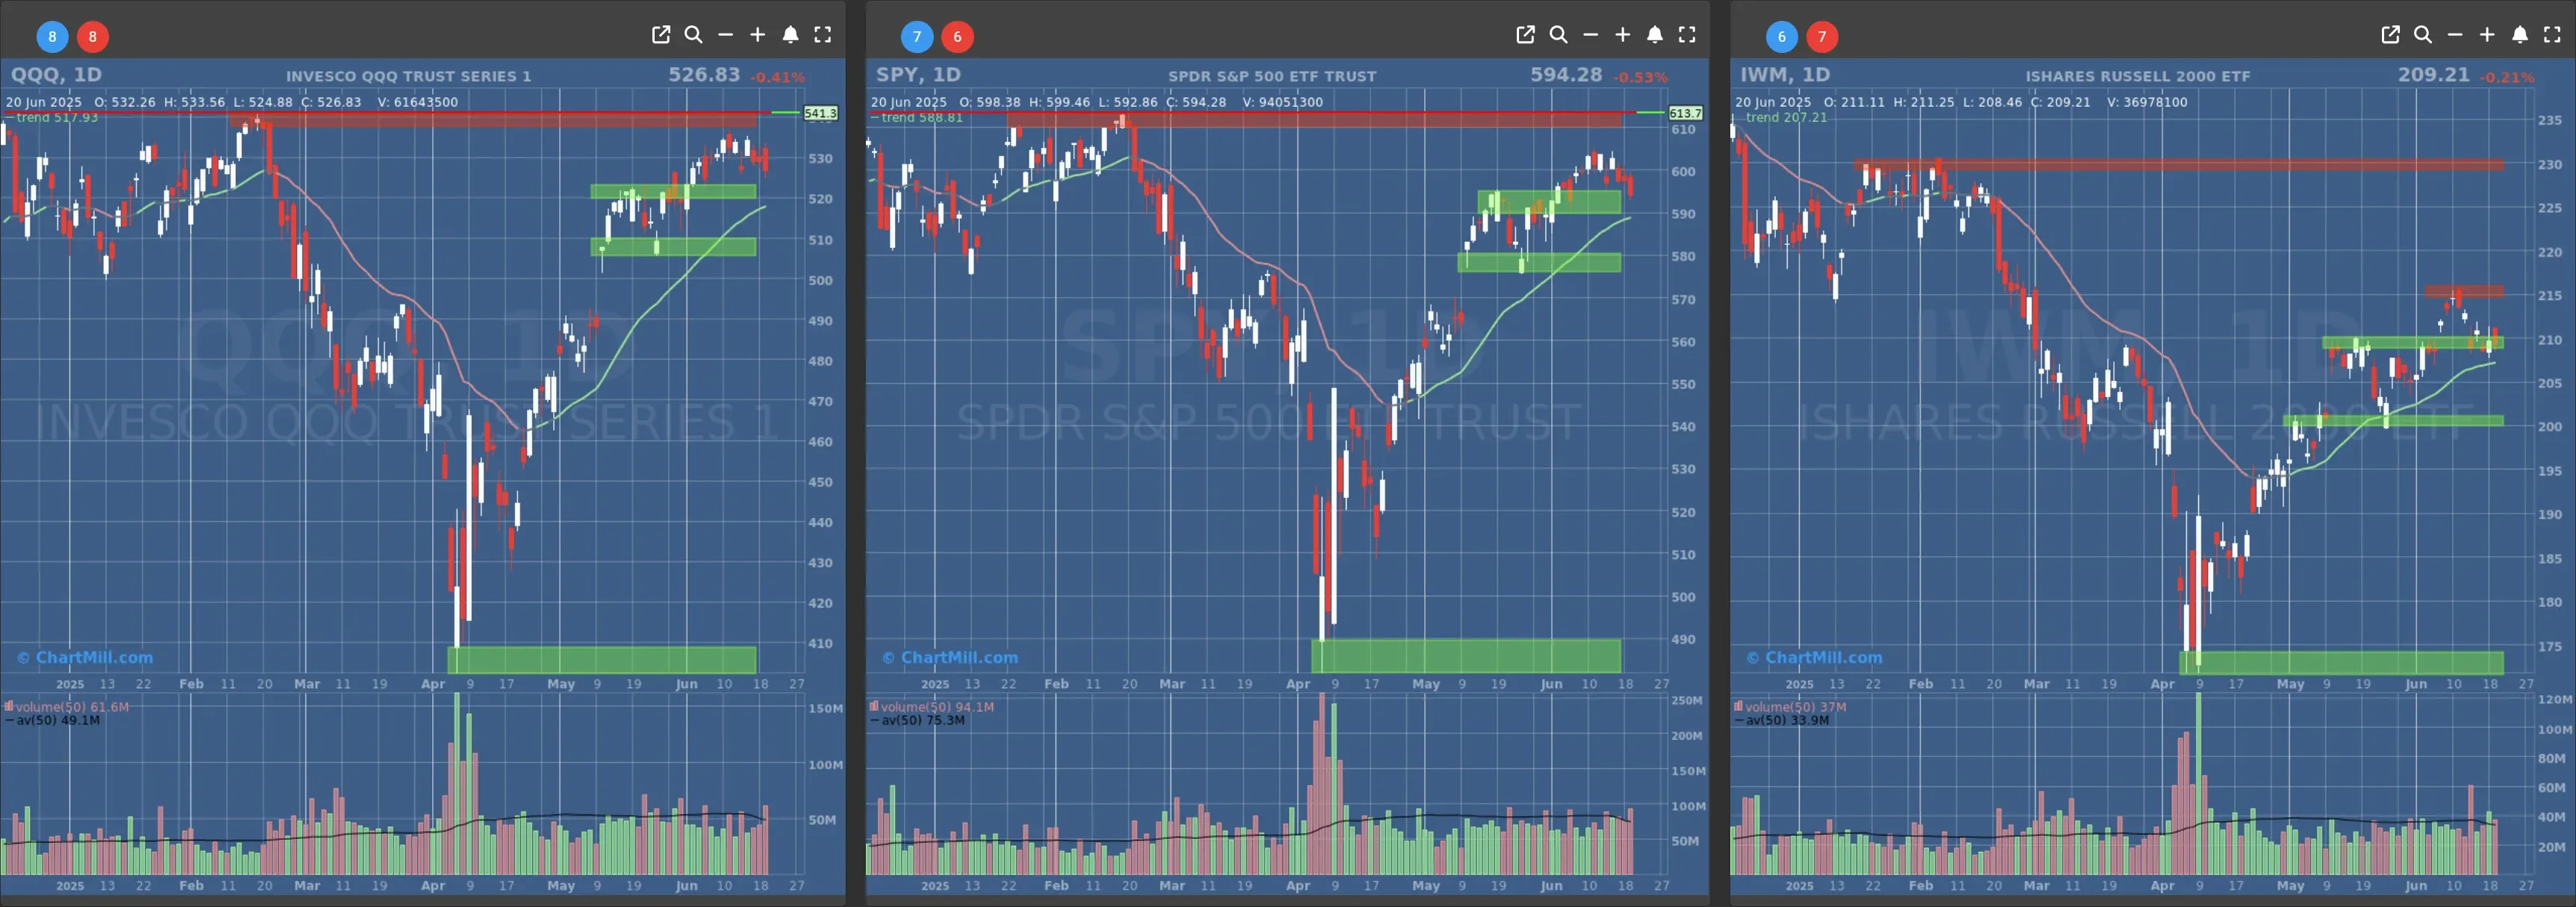
- Short-Term Trend: Bullish (no change)
- Next Support at $580
- Next Resistance at $610
- Volume: above Average (50)
- Pattern: Bearish Engulfing Candle
- Short-Term Trend: Bullish (no change)
- Next Support at $520
- Next Resistance at $540
- Volume: Above Average (50)
- Pattern: Down Day
- Short-Term Trend: Bullish (no change)
- Next Support at $210 & $205
- Next Resistance at $215 & $230
- Volume: Above Average (50)
- Pattern: Down Day
Long Term Trend
- Long-Term Trend: Positive (no change)
- Long-Term Trend: Positive (no change)
- Long-Term Trend: Neutral (no change)
Daily Market Breadth Analysis – June 20, 2025 (After Market Close)
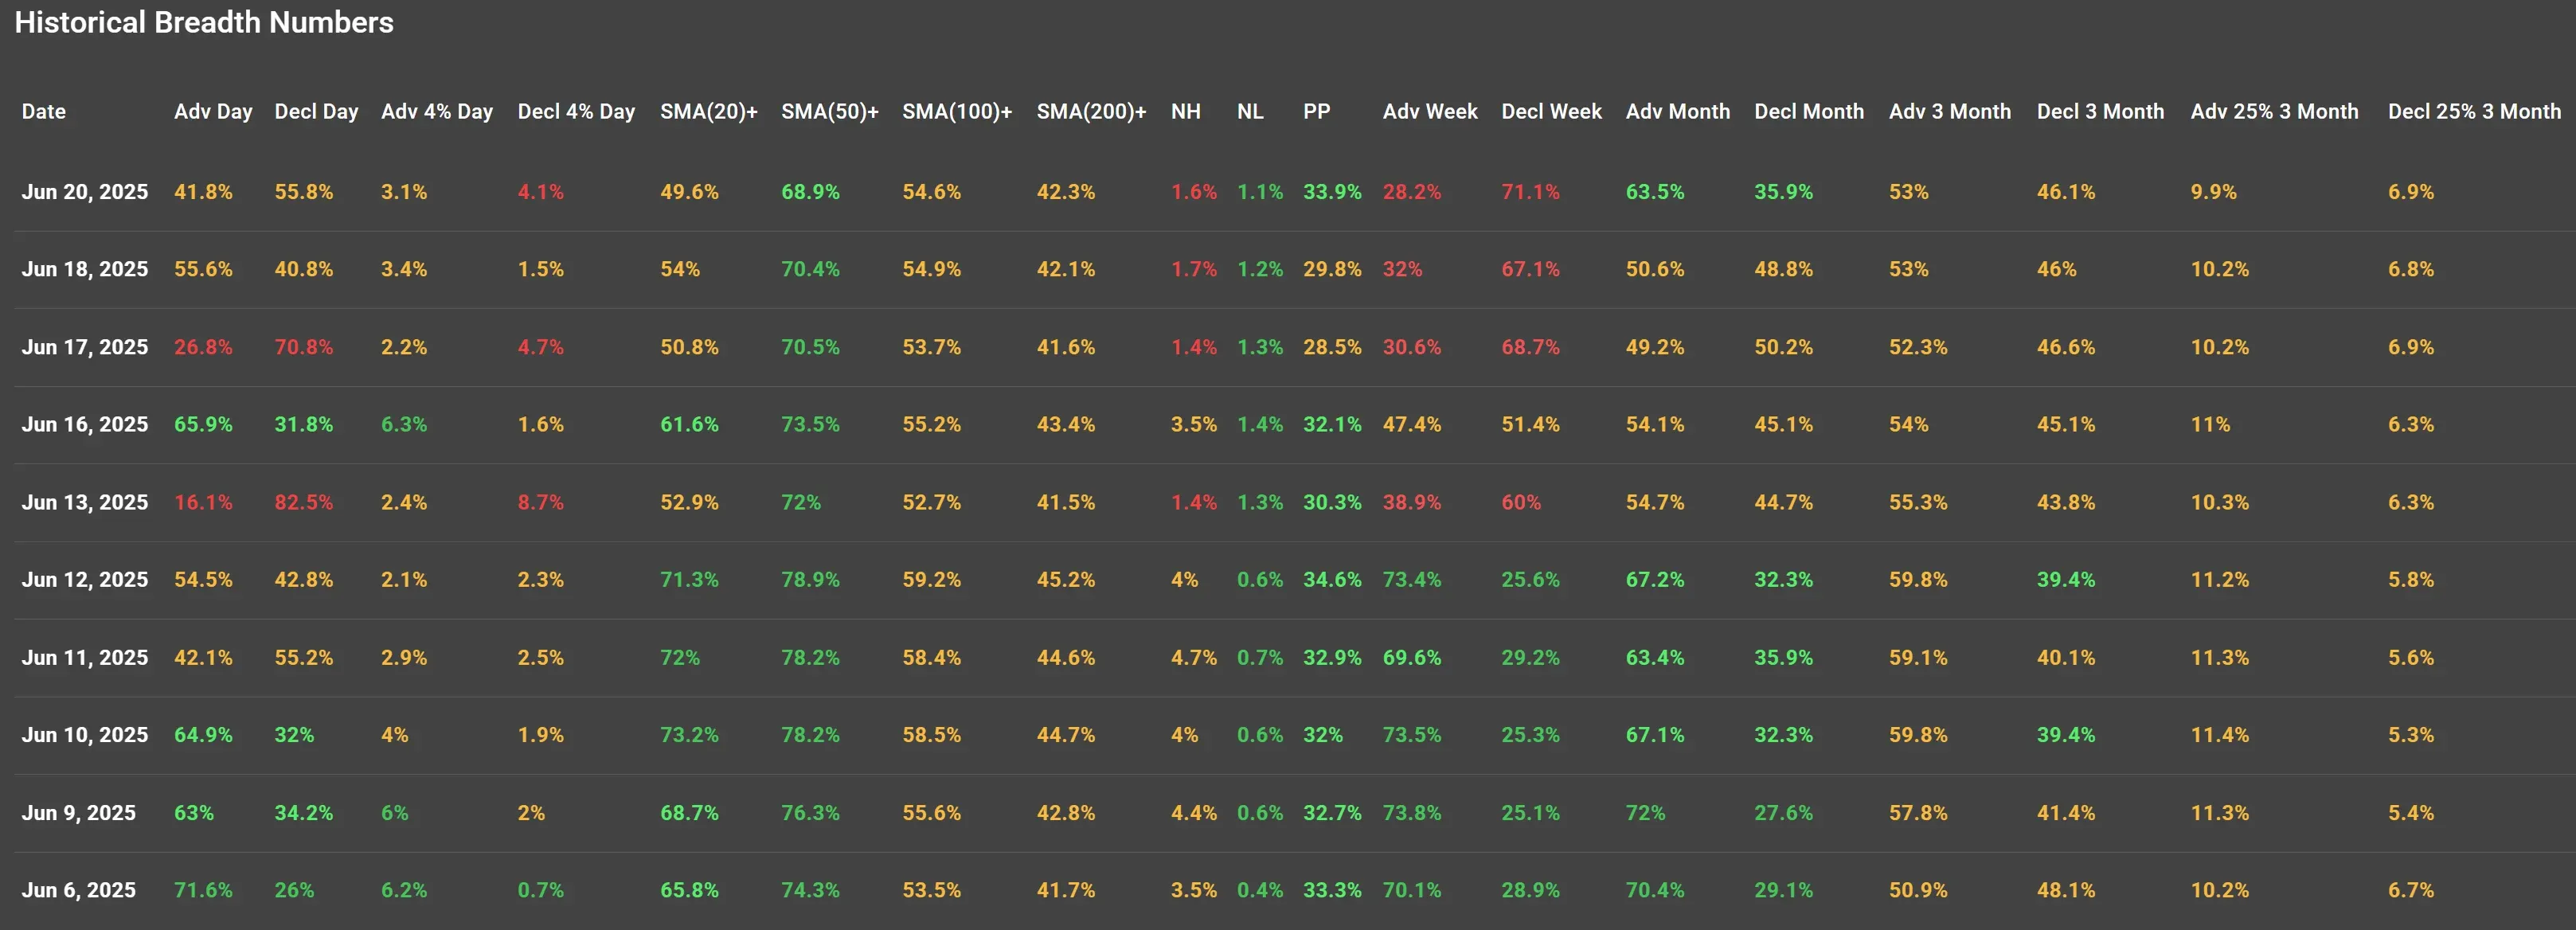
Breathless Breadth Before the Bombs
Friday’s closing data, dated June 20, offered an eerily prescient snapshot of a market already on edge, days before news of the U.S. strike on Iran would break. The mood was sour, and the internals made that crystal clear.
From daily advance-decline ratios to longer-term trend signals, the picture was one of rising caution and faltering momentum.
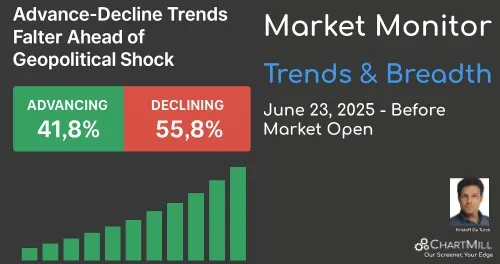
The Numbers Don't Lie And They Weren’t Pretty
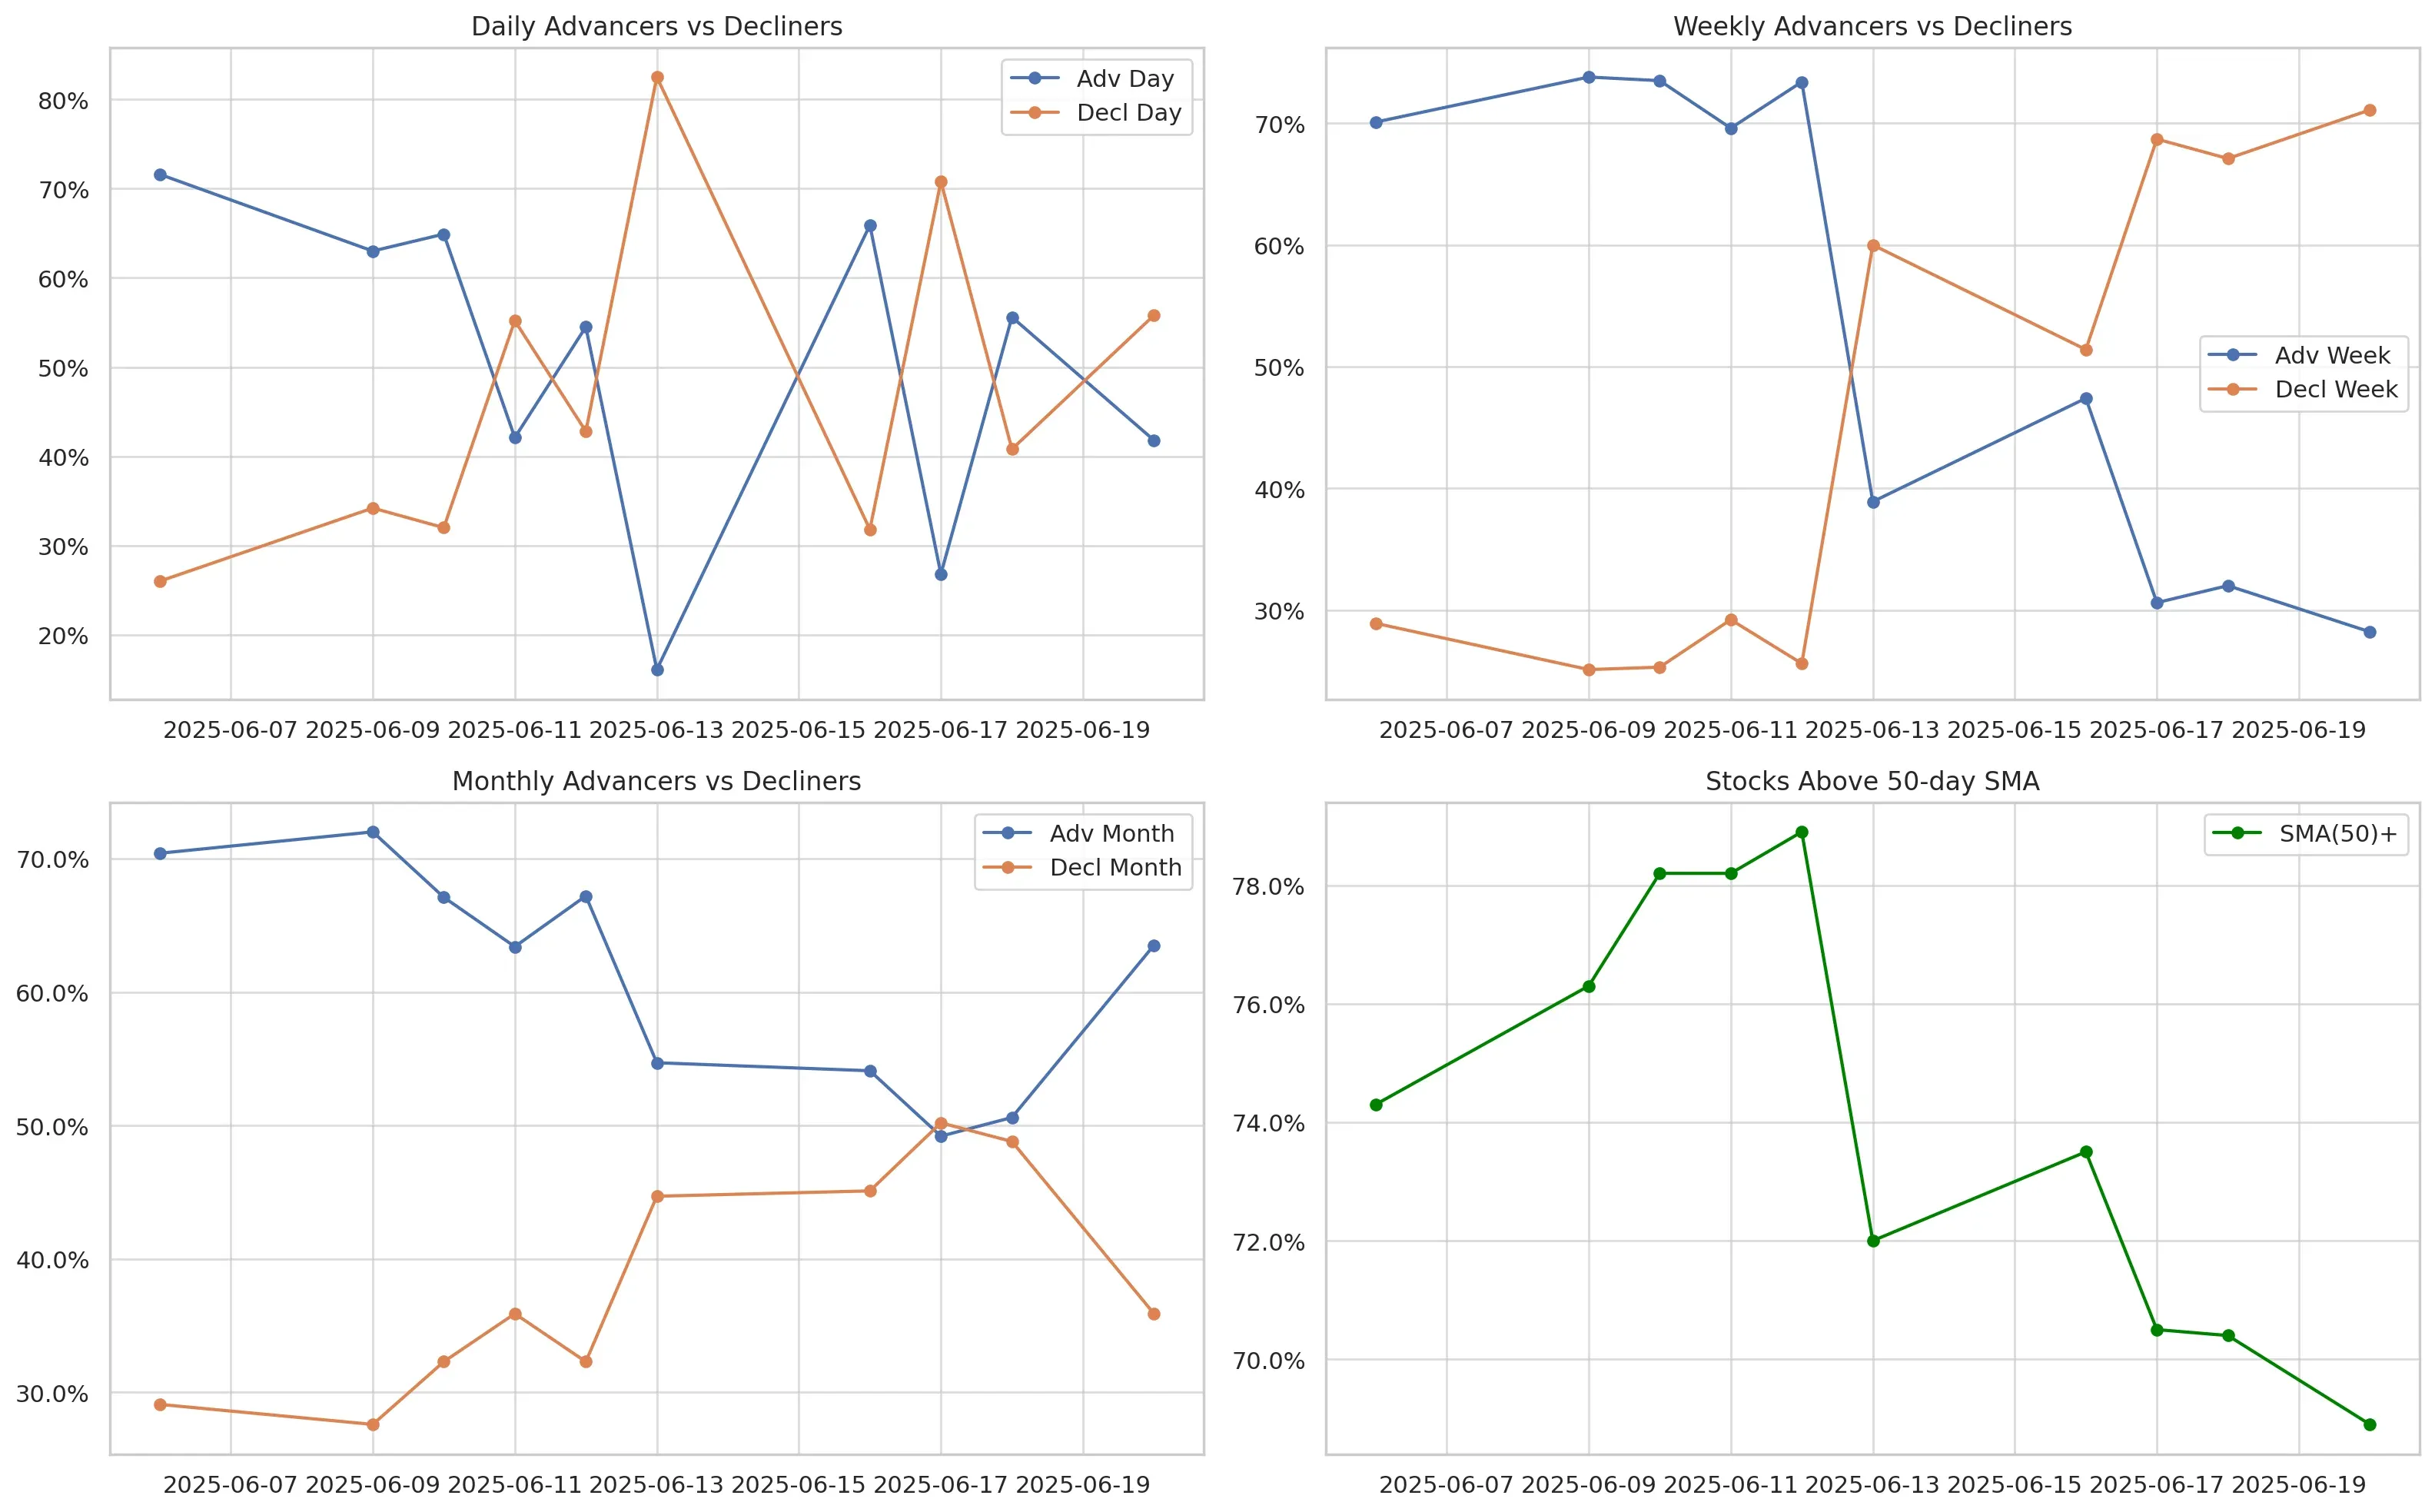
The advance-decline ratio flipped back to bearish territory: only 41.8% of stocks advanced on Friday, while 55.8% declined. That drop in advancers confirmed the bearish pivot we saw midweek, and came just two days after a brief bounce to 55.6% advancing (June 18).
It's now safe to say: that rebound had no staying power.
Looking at weekly breadth, the deterioration was even sharper. Only 28.2% of stocks showed net gains over the past five sessions. That’s down from 32% the day before and nearly half the 47.4% reading on June 16.
On the flipside, 71.1% of stocks were in decline territory for the week, an unmistakable shift toward risk-off behavior.
The SMA(50)+ Trend Is Rolling Over
Perhaps the most telling indicator: the percentage of stocks trading above their 50-day simple moving average (SMA) slipped again to 68.9%. Just two weeks ago, that figure was hovering around 78%.
It might not seem like a huge swing at first glance, but in breadth terms, that’s a notable loss in technical participation.
It means that fewer stocks are holding up technically, even if major indexes still appear relatively stable on the surface. This erosion in medium-term momentum often precedes broader corrections.
Monthly Breadth: A Tug of War Emerges
Over the monthly window, 63.5% of stocks remain positive, versus 35.9% in the red. But that’s less comforting than it sounds. The bulls have lost grip, on June 10, nearly 72% of stocks were higher month-to-date. The monthly trend remains net-positive, but it’s losing steam quickly.
Comparison to the Day Before: The Slow Fade
While Wednesday (June 18) gave us a slightly more neutral tone, 55.6% advancers vs 40.8% decliners, the erosion was already underway in the weekly and monthly numbers. The drop in stocks above key moving averages and the declining number of high-momentum stocks warned that participation was thinning.
That thinning, quiet, gradual, and subtle, is how markets often weaken before a bigger jolt. Friday’s breadth confirmed that many investors had already started stepping to the sidelines, even before missiles entered the headlines.
What’s the Takeaway?
Market breadth, especially over multiple timeframes, is whispering what price alone might not yet show: this rally is fraying. It’s no surprise that on a day when macro news was still “contained” to inflation talk and trade tension headlines, the market was already flashing stress signals.
Now, with the geopolitical narrative flipped on its head over the weekend, breadth may go from a whisper to a scream. All eyes Monday will be on follow-through, or breakdown.
One thing’s clear: this isn’t the time to chase highs. It's time to listen to what the underlying internals are telling us. And right now, they’re saying: “Risk is rising.”
Kristoff - Co-founder, ChartMill
Next to read: Market Monitor News, June 23
NYSEARCA:IWM (6/23/2025, 3:26:09 PM)
210.98
+1.77 (+0.85%)
NASDAQ:QQQ (6/23/2025, 3:26:10 PM)
531.14
+4.31 (+0.82%)
NYSEARCA:SPY (6/23/2025, 3:26:09 PM)
599.08
+4.8 (+0.81%)
Find more stocks in the Stock Screener
IWM Latest News and Analysis
 11 hours ago - ChartmillMarket Monitor Trends BMO (SPY, QQQ, IWM) and Breadth June 23
Market internals weaken ahead of U.S. strike on Iran; advance-decline ratios and breadth metrics flash growing risk aversion.
 4 days ago - ChartmillMarket Monitor Trends (SPY, QQQ, IWM) and Breadth June 20
Steady But Fragile: Breadth Signals a Market in Flux
 5 days ago - ChartmillMarket Monitor Trends (SPY, QQQ, IWM) and Breadth June 18
The Market Breathes Out Again – But It’s a Nervous Exhale
 6 days ago - ChartmillMarket Monitor Trends (SPY, QQQ, IWM) and Breadth June 17
Friday’s breadth collapse raised some eyebrows, but Monday erased a lot of that doubt.
 7 days ago - ChartmillMarket Monitor Trends (SPY, QQQ, IWM) and Breadth June 16
Sharp Reversal as Breadth Collapses
 10 days ago - ChartmillMarket Monitor Trends (SPY, QQQ, IWM) and Breadth June 13
Bulls still have the ball, but they’re no longer sprinting. They’re looking over their shoulder.
 12 days ago - ChartmillMarket Monitor Trends (SPY, QQQ, IWM) and Breadth June 12
While fewer stocks participated in gains today, most remain above key moving averages, and longer-term momentum is holding.
 13 days ago - ChartmillMarket Monitor Trends (SPY, QQQ, IWM) and Breadth June 11
The market breadth on June 10, 2025, points to a strengthening bullish undercurrent, especially after the volatility of early June. Breadth metrics now show consistency across daily, weekly, and medium-term indicators.
 13 days ago - ChartmillMarket Monitor Trends (SPY, QQQ, IWM) and Breadth June 10
Breadth metrics for June 9 confirm that last week’s sharp selloff on June 5 was likely a short-lived pullback rather than the start of a new bearish phase.
 15 days ago - ChartmillMarket Monitor Trends (SPY, QQQ, IWM) and Breadth June 09
The June 6 session confirms that breadth is not only improving but now supporting the index-level gains we’ve seen in the major averages.
 18 days ago - ChartmillMarket Monitor Trends (SPY, QQQ, IWM) and Breadth June 06
SPY, QQQ both showing a distribution day after yesterday's session (down on above-average volume near the high).
 19 days ago - ChartmillMarket Monitor Trends (SPY, QQQ, IWM) and Breadth June 05
Breadth readings remain firm for now, this appears to be a healthy pause, not a reversal.
