Market Monitor Trends (SPY, QQQ, IWM) and Breadth June 13
By Kristoff De Turck - reviewed by Aldwin Keppens
Last update: Jun 13, 2025

(All data & visualisations by ChartMill.com)
Daily Market Trend Analysis – June 12, 2025 (After Market Close)
A narrow three-day sideways range for SPY and QQQ, IWM gapped down after yesterday's bearish engulfing pattern
Short Term Trend

- Short-Term Trend: Bullish (no change)
- Next Support at $580
- Next Resistance at $610
- Volume: Below Average (50)
- Pattern: Up Day
- Short-Term Trend: Bullish (no change)
- Next Support at $520
- Next Resistance at $540
- Volume: Far Below Average (50)
- Pattern: Up Day
- Short-Term Trend: Bullish (no change)
- Next Support at $210 & $205
- Next Resistance at $215 & $230
- Volume: below Average (50)
- Pattern: Down Day, Gap Down
Long Term Trend
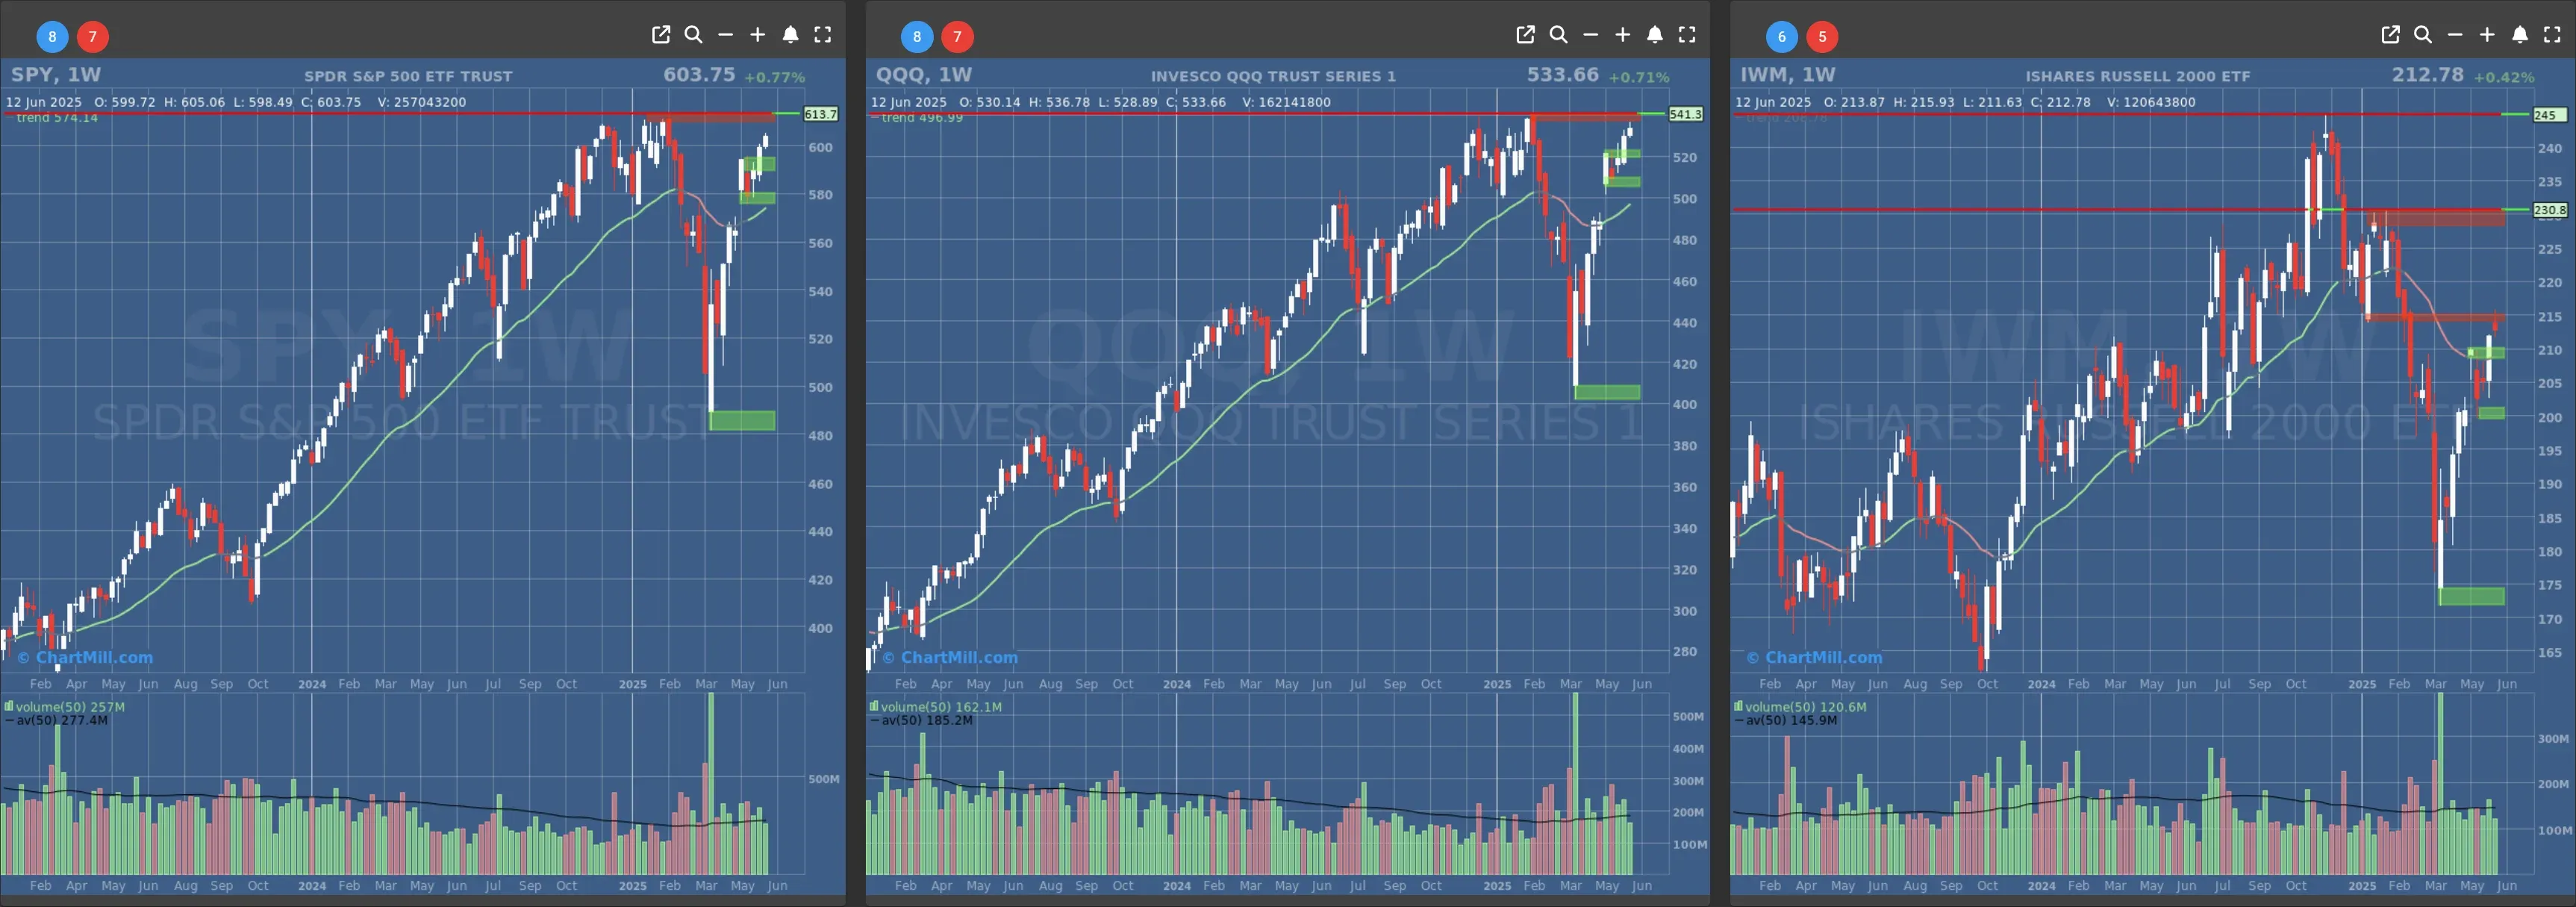
- Long-Term Trend: Positive (no change)
- Long-Term Trend: Positive (no change)
- Long-Term Trend: Neutral (no change)
Daily Market Breadth Analysis – June 12, 2025 (After Market Close)
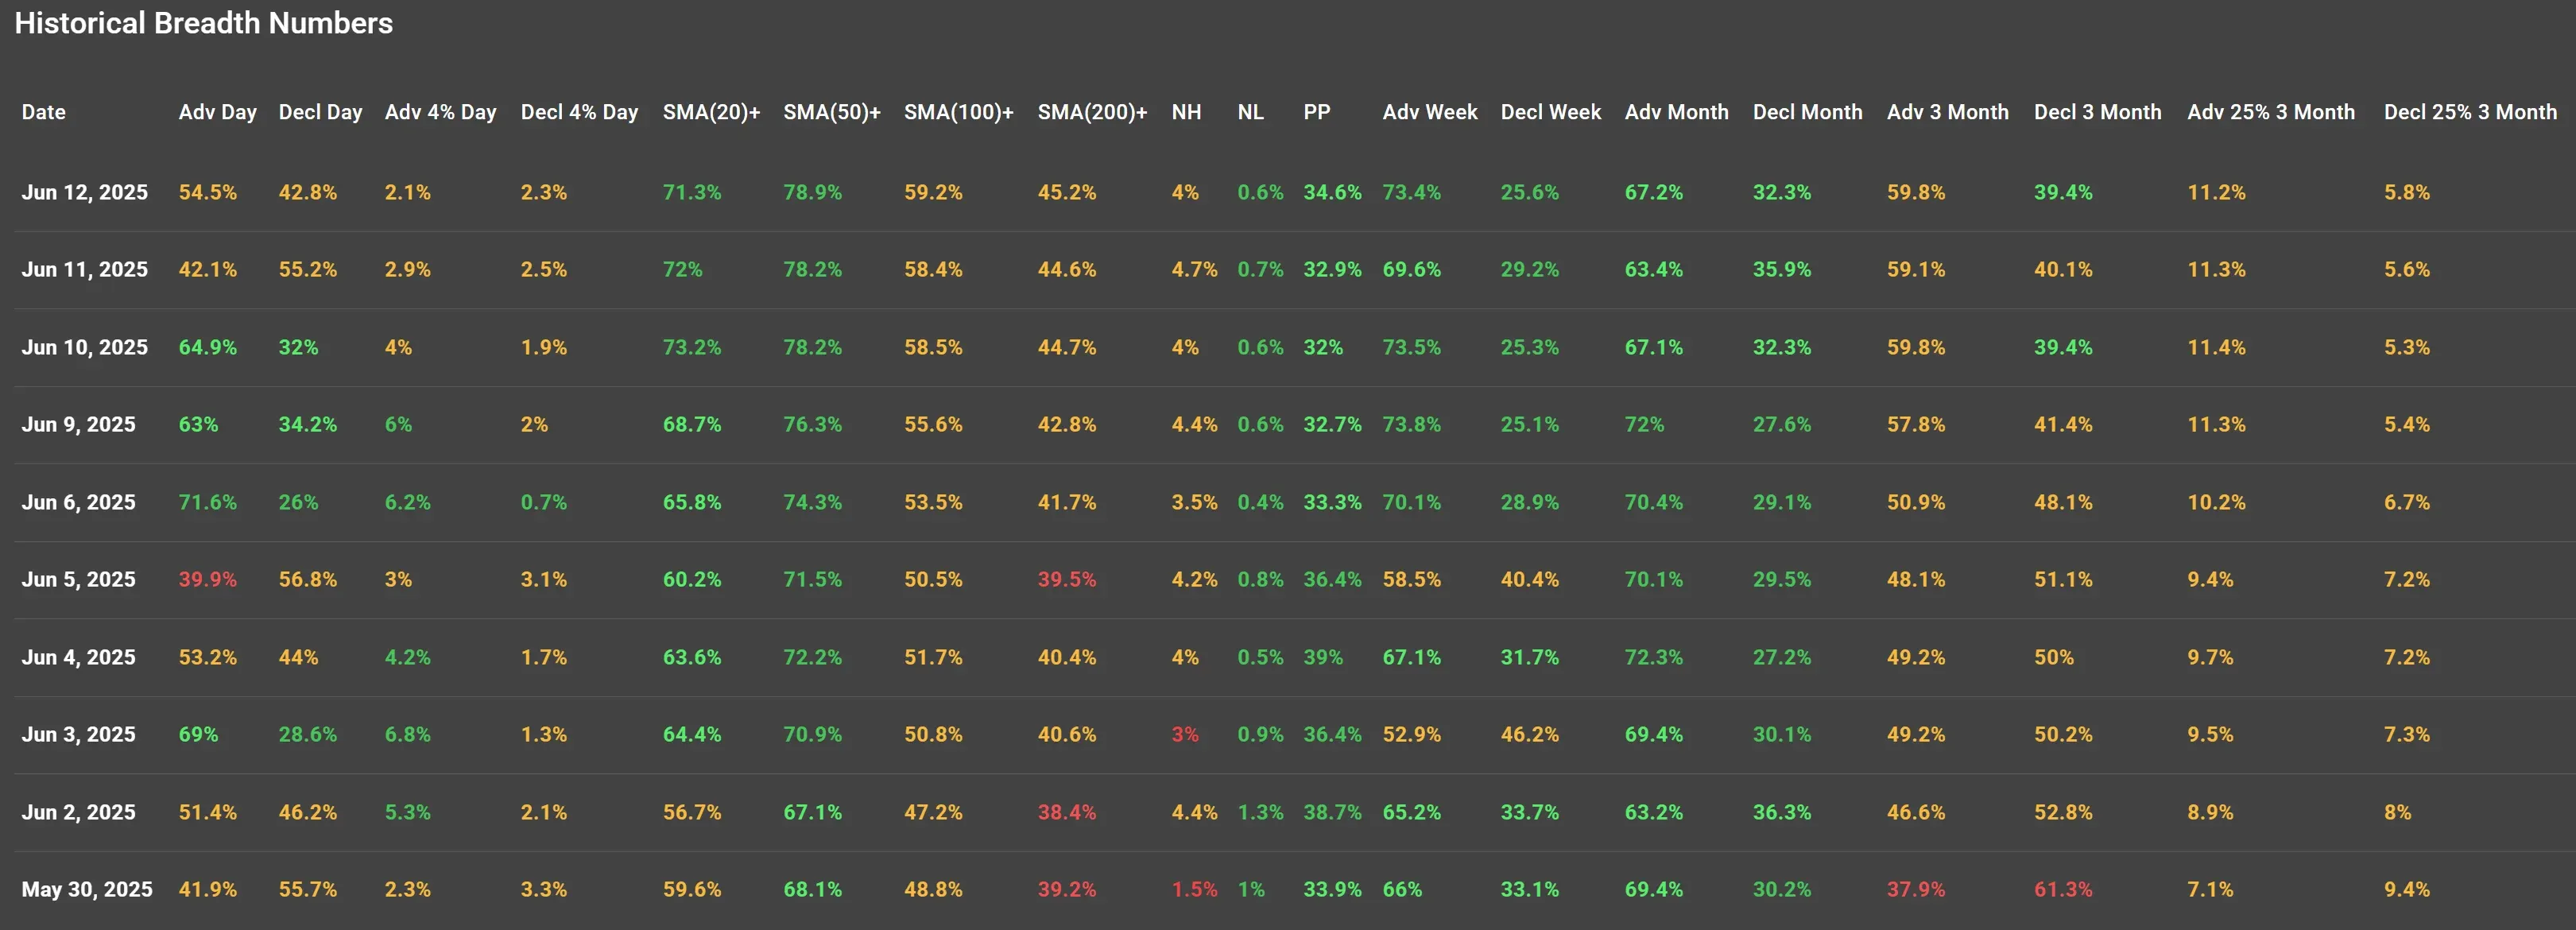
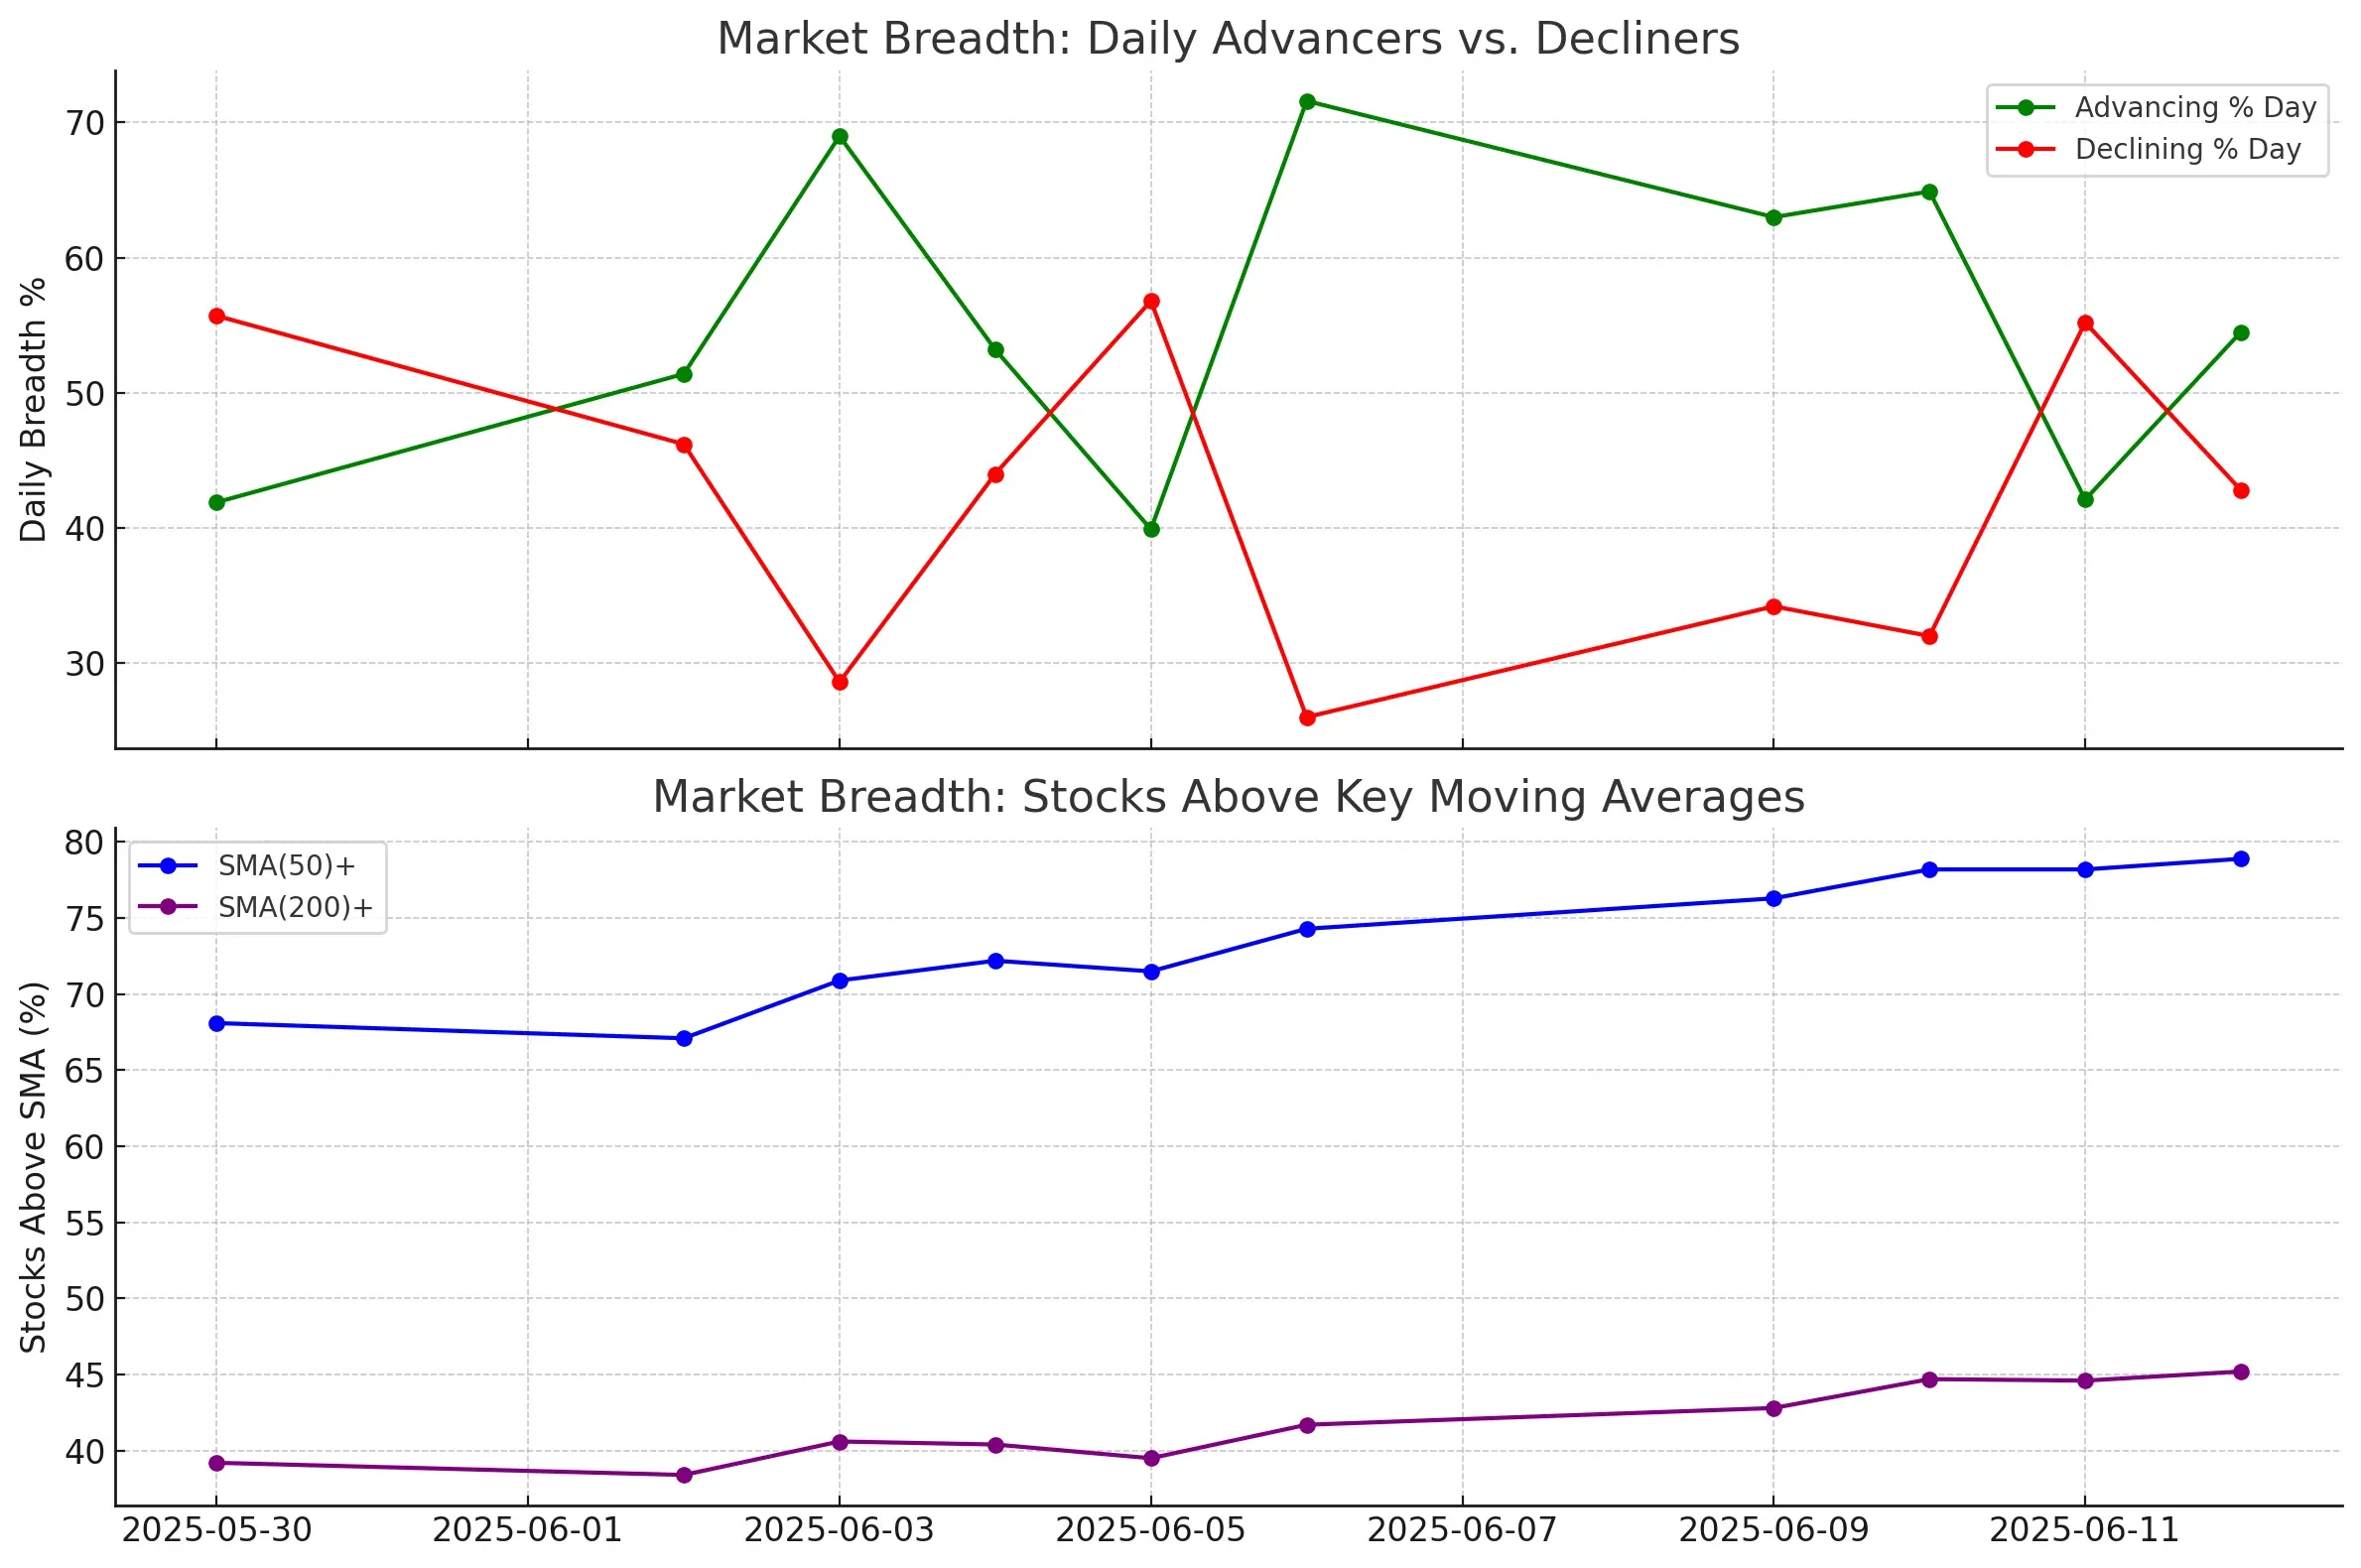
On June 12, we saw 54.5% of stocks advancing, versus 42.8% declining, a mild positive close, but certainly not the kind of breath-taking participation we saw earlier this week. Compare that to June 10, where 64.9% of stocks advanced, or the 71.6% spike from June 6.
We’re still in positive territory, but the upside momentum is clearly flattening out.
That cooling shows in the visual trend too: advancers are fading off highs, and decliners are creeping back up. This looks like hesitation, not reversal (yet), but a market that’s pausing.
Breadth Through Moving Averages: Holding Up, For Now
One thing that continues to stand out, and keeps me from flipping bearish prematurely, is how strong the SMA(50)+ and SMA(200)+ indicators remain.
-
78.9% of stocks are still trading above their 50-day moving average.
-
45.2% are above their 200-day, a significant uptick from 39.5% just a week ago (June 5).
That’s a structurally healthy market, breadth is holding even with a bit of daily chop.
Medium-Term Trend: Still Constructive
The monthly advancers number - tracking the % of stocks that are up over the past month - sits at 67.2%, slightly higher than the day before. While it’s not quite the 72% peak we saw on June 9, it confirms the ongoing strength of the broader move.
The same goes for decliners: 32.3% is perfectly manageable, and not rising significantly.
What’s Changed Since Yesterday?
In yesterday’s review (June 11), I flagged the drop in advancing stocks (42.1%) as a potential early warning sign. Today’s rebound back above the 50% line is encouraging, but the lack of real follow-through and the slight uptick in decliners mean we’re not out of the woods.
In short: bulls still have the ball, but they’re no longer sprinting. They’re looking over their shoulder.
Final Take
This market has legs, but it’s jogging now, not sprinting. The momentum breadth is cooling just enough to warrant caution. But unless we see a sharp drop in stocks above their 50- and 200-day moving averages, I’m not shifting bias yet.
I'll keep watching the advancers/decliners split, but more importantly, I want to see whether the longer-term breadth (SMA and monthly trend) starts to deteriorate. That will be my trigger to shift gears.
Stay sharp,
Kristoff - Co-founder, ChartMill
Next to read: Market Monitor News, June 13
NYSEARCA:IWM (6/23/2025, 11:16:10 AM)
209.89
+0.68 (+0.33%)
NASDAQ:QQQ (6/23/2025, 11:16:10 AM)
529.9
+3.07 (+0.58%)
NYSEARCA:SPY (6/23/2025, 11:16:10 AM)
597.53
+3.25 (+0.55%)
Find more stocks in the Stock Screener
IWM Latest News and Analysis
 7 hours ago - ChartmillMarket Monitor Trends BMO (SPY, QQQ, IWM) and Breadth June 23
Market internals weaken ahead of U.S. strike on Iran; advance-decline ratios and breadth metrics flash growing risk aversion.
 3 days ago - ChartmillMarket Monitor Trends (SPY, QQQ, IWM) and Breadth June 20
Steady But Fragile: Breadth Signals a Market in Flux
 5 days ago - ChartmillMarket Monitor Trends (SPY, QQQ, IWM) and Breadth June 18
The Market Breathes Out Again – But It’s a Nervous Exhale
 6 days ago - ChartmillMarket Monitor Trends (SPY, QQQ, IWM) and Breadth June 17
Friday’s breadth collapse raised some eyebrows, but Monday erased a lot of that doubt.
 7 days ago - ChartmillMarket Monitor Trends (SPY, QQQ, IWM) and Breadth June 16
Sharp Reversal as Breadth Collapses
 10 days ago - ChartmillMarket Monitor Trends (SPY, QQQ, IWM) and Breadth June 13
Bulls still have the ball, but they’re no longer sprinting. They’re looking over their shoulder.
 11 days ago - ChartmillMarket Monitor Trends (SPY, QQQ, IWM) and Breadth June 12
While fewer stocks participated in gains today, most remain above key moving averages, and longer-term momentum is holding.
 12 days ago - ChartmillMarket Monitor Trends (SPY, QQQ, IWM) and Breadth June 11
The market breadth on June 10, 2025, points to a strengthening bullish undercurrent, especially after the volatility of early June. Breadth metrics now show consistency across daily, weekly, and medium-term indicators.
 13 days ago - ChartmillMarket Monitor Trends (SPY, QQQ, IWM) and Breadth June 10
Breadth metrics for June 9 confirm that last week’s sharp selloff on June 5 was likely a short-lived pullback rather than the start of a new bearish phase.
 15 days ago - ChartmillMarket Monitor Trends (SPY, QQQ, IWM) and Breadth June 09
The June 6 session confirms that breadth is not only improving but now supporting the index-level gains we’ve seen in the major averages.
 17 days ago - ChartmillMarket Monitor Trends (SPY, QQQ, IWM) and Breadth June 06
SPY, QQQ both showing a distribution day after yesterday's session (down on above-average volume near the high).
 18 days ago - ChartmillMarket Monitor Trends (SPY, QQQ, IWM) and Breadth June 05
Breadth readings remain firm for now, this appears to be a healthy pause, not a reversal.
