
Our stock screener has detected a potential breakout setup on NEWMONT CORP (NYSE:NEM). This breakout pattern is observed when a stock consolidates following a strong upward movement. It's important to note that this pattern is based on technical analysis, and the actual breakout outcome is uncertain. However, it might be worth keeping an eye on NYSE:NEM.
In-Depth Technical Analysis of NEM
ChartMill assigns a Technical Rating to every stock. This score, ranging from 0 to 10, is updated daily and is determined by evaluating multiple technical indicators and properties.
Overall NEM gets a technical rating of 10 out of 10. This is due to a consistent performance in both the short and longer term time frames. Also compared to the overall market, NEM is showing a nice and steady performance.
- The long and short term trends are both positive. This is looking good!
- When comparing the yearly performance of all stocks, we notice that NEM is one of the better performing stocks in the market, outperforming 93% of all stocks.
- NEM is one of the better performing stocks in the Metals & Mining industry, it outperforms 72% of 153 stocks in the same industry.
- NEM is currently trading in the upper part of its 52 week range. The market is still in the middle of its 52 week range, so NEM slightly outperforms the market at the moment.
- In the last month NEM has a been trading in the 44.39 - 57.16 range, which is quite wide. It is currently trading near the high of this range.
Our latest full technical report of NEM contains the most current technical analsysis.
How do we evaluate the setup for NEM?
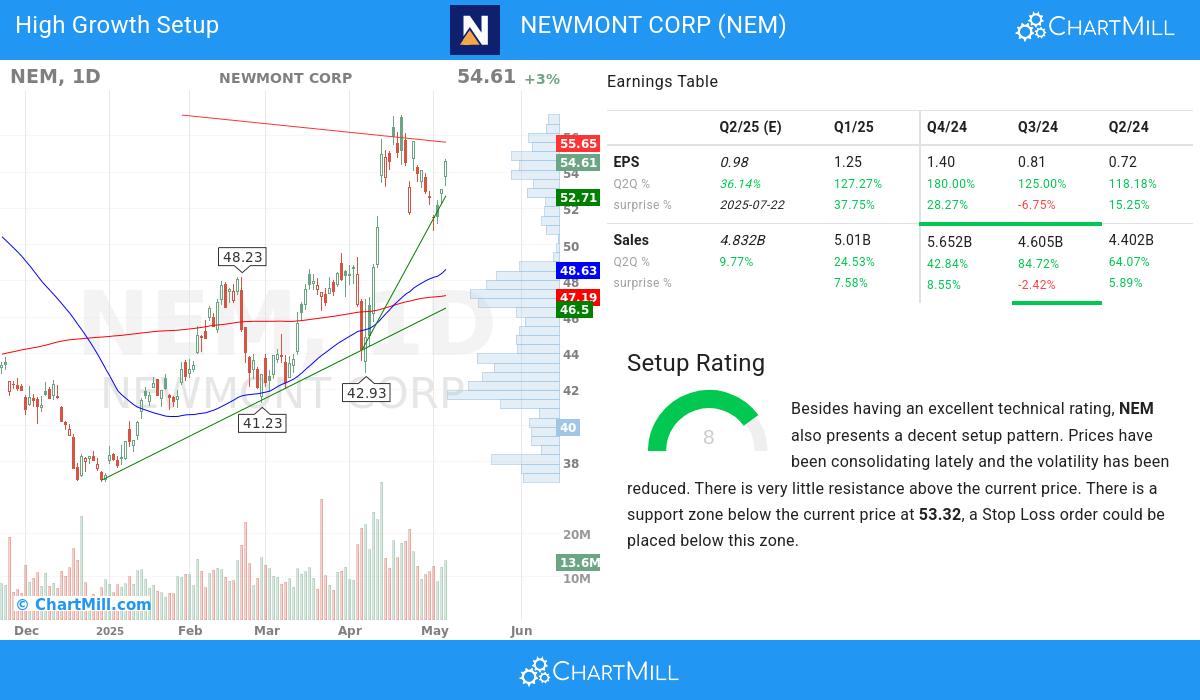
Besides the Technical Rating, ChartMill assigns a Setup Rating to every stock to determine the degree of consolidation. This rating, ranging from 0 to 10, is updated daily and evaluates various short-term technical indicators. NEM currently holds a 8 as its setup rating, suggesting a particular level of consolidation in the stock.
NEM has an excellent technical rating and also presents a decent setup pattern. We see reduced volatility while prices have been consolidating in the most recent period. There is very little resistance above the current price. There is a support zone below the current price at 53.32, a Stop Loss order could be placed below this zone.
Exploring NEM's Growth
Every stock receives a High Growth Momentum Rating (HGM) from ChartMill, ranging from 0 to 10. This rating assesses various growth and profitability aspects, including historical and projected EPS and revenue growth. NEM boasts a 6 out of 10:
Explosive Earnings Growth
- The earnings per share (EPS) of NEM have shown positive growth on a quarter-to-quarter (Q2Q) basis, with a 127.0% increase. This reflects the company's ability to improve its profitability over time.
- Over the past year, NEM has demonstrated 140.0% growth in EPS, signifying its positive financial trajectory and potential for future profitability.
- With consistent quarter-to-quarter (Q2Q) revenue growth of 24.53%, NEM exemplifies its ability to generate increased sales and revenue streams. This growth signifies the company's strong business performance and its potential for continued growth.
- The 1-year revenue growth of NEM (49.51%) has been strong, reflecting the company's ability to generate consistent sales growth. This growth suggests the company's ability to meet customer needs and expand its market share.
- NEM has a strong history of beating EPS estimates 3 times in the last 4 quarters, signaling its ability to consistently exceed market expectations. This indicates the company's strong financial performance and its potential for creating shareholder value.
Profitability & Financial Strength
- NEM has shown positive growth in its operating margin over the past year, indicating improved operational efficiency. This growth highlights the company's ability to effectively manage costs and maximize profitability.
- NEM has shown positive growth in its free cash flow (FCF) over the past year, indicating improved cash generation and financial strength. This growth highlights the company's ability to effectively manage its cash flows and generate surplus funds.
- NEM showcases a robust Return on Equity (ROE) of 16.22%, indicating its ability to generate favorable returns for shareholders. This metric underscores the company's efficiency in utilizing its equity capital to generate profits.
- With a Debt/Equity ratio of 0.25, NEM demonstrates prudent financial management.
Institutional Confidence & Market Strength
- With 73.84% of the total shares held by institutional investors, NEM showcases a healthy distribution of ownership. This suggests a mix of institutional and retail investors, fostering a dynamic market for the stock.
- NEM has maintained a healthy Relative Strength (RS) over the analyzed period, with a current 93.03 rating. This demonstrates the stock's ability to outperform its peers and indicates its competitive positioning.
More ideas for high growth momentum breakouts can be found on ChartMill in our High Growth Momentum Breakout screen.
Disclaimer
Important Note: The content of this article is not intended as trading advice. It is essential to perform your own analysis and exercise caution when making trading decisions. The article presents observations created by automated analysis but does not guarantee any trading or investment outcomes. Always trade responsibly and make independent judgments.