
NEWMONT CORP (NYSE:NEM) is probably undervalued for the fundamentals it is displaying.
By Mill Chart
Last update: Mar 24, 2025
Uncover the hidden value in NEWMONT CORP (NYSE:NEM) as our stock screening tool recommends it as an undervalued choice. NEM maintains a robust financial position and offers an attractive pricing perspective. Let's dig deeper into the analysis.
Deciphering NEM's Valuation Rating
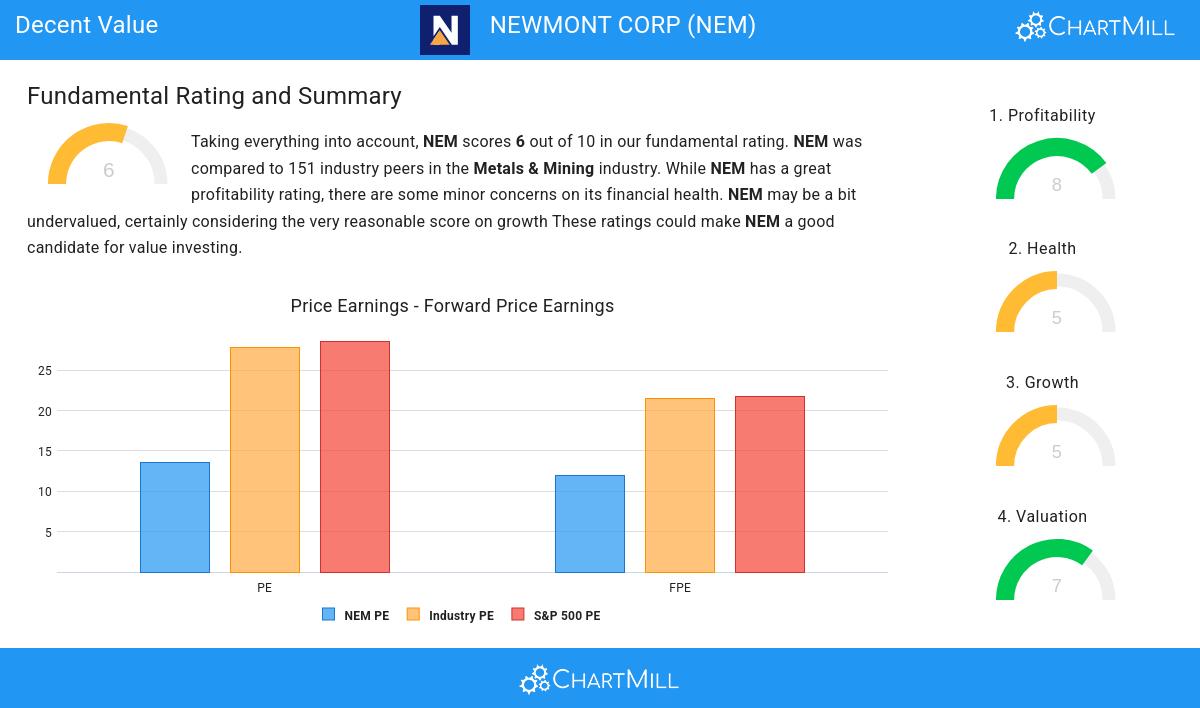
To assess a stock's valuation, ChartMill utilizes a Valuation Rating on a scale of 0 to 10. This comprehensive assessment considers various valuation aspects, comparing price to earnings and cash flows, while factoring in profitability and growth. NEM has achieved a 7 out of 10:
- Based on the Price/Earnings ratio, NEM is valued cheaper than 85.43% of the companies in the same industry.
- When comparing the Price/Earnings ratio of NEM to the average of the S&P500 Index (28.62), we can say NEM is valued rather cheaply.
- With a Price/Forward Earnings ratio of 11.98, the valuation of NEM can be described as very reasonable.
- Compared to the rest of the industry, the Price/Forward Earnings ratio of NEM indicates a somewhat cheap valuation: NEM is cheaper than 76.16% of the companies listed in the same industry.
- When comparing the Price/Forward Earnings ratio of NEM to the average of the S&P500 Index (21.72), we can say NEM is valued slightly cheaper.
- Based on the Enterprise Value to EBITDA ratio, NEM is valued a bit cheaper than 77.48% of the companies in the same industry.
- Compared to the rest of the industry, the Price/Free Cash Flow ratio of NEM indicates a rather cheap valuation: NEM is cheaper than 82.78% of the companies listed in the same industry.
- NEM has an outstanding profitability rating, which may justify a higher PE ratio.
- NEM's earnings are expected to grow with 14.49% in the coming years. This may justify a more expensive valuation.
Profitability Assessment of NEM
Discover ChartMill's exclusive Profitability Rating, a proprietary metric that assesses stocks on a scale of 0 to 10. It takes into consideration various profitability ratios and margins, both in absolute terms and relative to industry peers. Notably, NEM has achieved a 8:
- NEM's Return On Assets of 5.94% is fine compared to the rest of the industry. NEM outperforms 78.15% of its industry peers.
- Looking at the Return On Equity, with a value of 11.19%, NEM belongs to the top of the industry, outperforming 81.46% of the companies in the same industry.
- NEM's Return On Invested Capital of 8.38% is amongst the best of the industry. NEM outperforms 82.12% of its industry peers.
- The last Return On Invested Capital (8.38%) for NEM is above the 3 year average (4.19%), which is a sign of increasing profitability.
- NEM has a better Profit Margin (17.92%) than 87.42% of its industry peers.
- NEM has a Operating Margin of 31.52%. This is amongst the best in the industry. NEM outperforms 89.40% of its industry peers.
- In the last couple of years the Operating Margin of NEM has grown nicely.
- The Gross Margin of NEM (52.02%) is better than 89.40% of its industry peers.
- NEM's Gross Margin has improved in the last couple of years.
Health Examination for NEM
ChartMill assigns a proprietary Health Rating to each stock. The score is computed by evaluating various liquidity and solvency ratios and ranges from 0 to 10. NEM was assigned a score of 5 for health:
- The Debt to FCF ratio of NEM is 3.18, which is a good value as it means it would take NEM, 3.18 years of fcf income to pay off all of its debts.
- The Debt to FCF ratio of NEM (3.18) is better than 76.82% of its industry peers.
- A Debt/Equity ratio of 0.27 indicates that NEM is not too dependend on debt financing.
ChartMill's Evaluation of Growth
Every stock receives a Growth Rating from ChartMill, ranging from 0 to 10. This rating assesses various growth aspects, including historical and projected EPS and revenue growth. NEM boasts a 5 out of 10:
- The Earnings Per Share has grown by an impressive 118.87% over the past year.
- NEM shows a strong growth in Earnings Per Share. Measured over the last years, the EPS has been growing by 21.58% yearly.
- NEM shows a strong growth in Revenue. In the last year, the Revenue has grown by 58.16%.
- The Revenue has been growing by 13.91% on average over the past years. This is quite good.
Every day, new Decent Value stocks can be found on ChartMill in our Decent Value screener.
Our latest full fundamental report of NEM contains the most current fundamental analsysis.
Disclaimer
This article should in no way be interpreted as advice. The article is based on the observed metrics at the time of writing, but you should always make your own analysis and trade or invest at your own responsibility.
68.98
-0.09 (-0.13%)
Find more stocks in the Stock Screener
NEM Latest News and Analysis


