One swallow does not make a summer...
The major US indices enjoyed a strong week. Best performer in the class was the technology-heavy Nasdaq which ended the week with a gain of more than 7% (QQQ index ETF). The bear is licking its wounds....
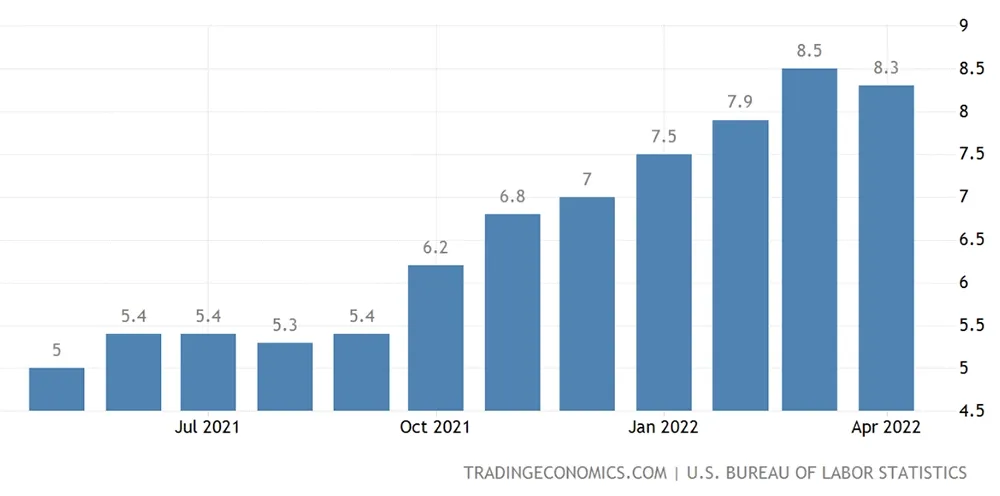
Investors apparently drew hope from the fact that annualized inflation fell slightly to 8.3% in April (from 8.5% in May). Nevertheless, the figure was still a bit higher than what the market was expecting (8.1%).
Inflation rate US & Core PCE Price Index
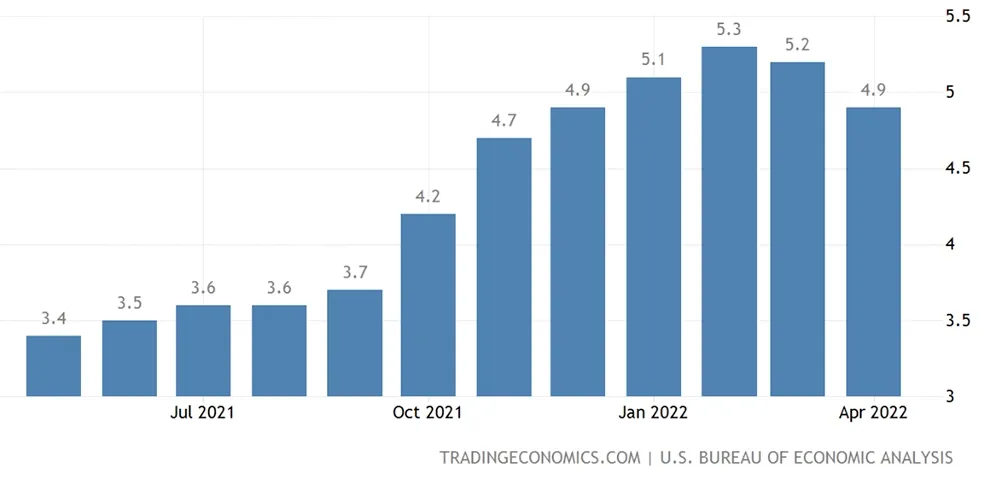
However, to measure the true underlying inflation, the Fed prefers to look at the PCE Price Index (Personal Consumption Expenditures Price Index). This is because this core index excludes two categories, food and energy. The reason for this has to do with the sometimes volatile price fluctuations that these categories can exhibit so that the inflation rate may not be a completely accurate representation of the true underlying inflation.
The PCE has also seen a slight decline compared to March 2022 but inflationary pressures remain high for the time being. Consumers remain rather unconcerned (for now?). The latest figures show that personal spending - adjusted for inflation - even rose slightly in April.
There is a caveat to this, however. Spending is apparently largely financed by savings. The US savings rate fell to 4.4% in April, its lowest level since 2008...
Better-than-expected quarterly results from Dollar Tree, Dollar General and Macy's, among others, also contributed to the week's rebound, giving investors some reason to hope that the margin pressures retailers are facing these days may not be all that bad after all.
Whether this strong weekly performance will guarantee a firm market bottom remains a matter of conjecture. After all, one swallow does not make a summer.
The long-term charts (SPY, QQQ, DIA and IWM on a weekly timeframe)
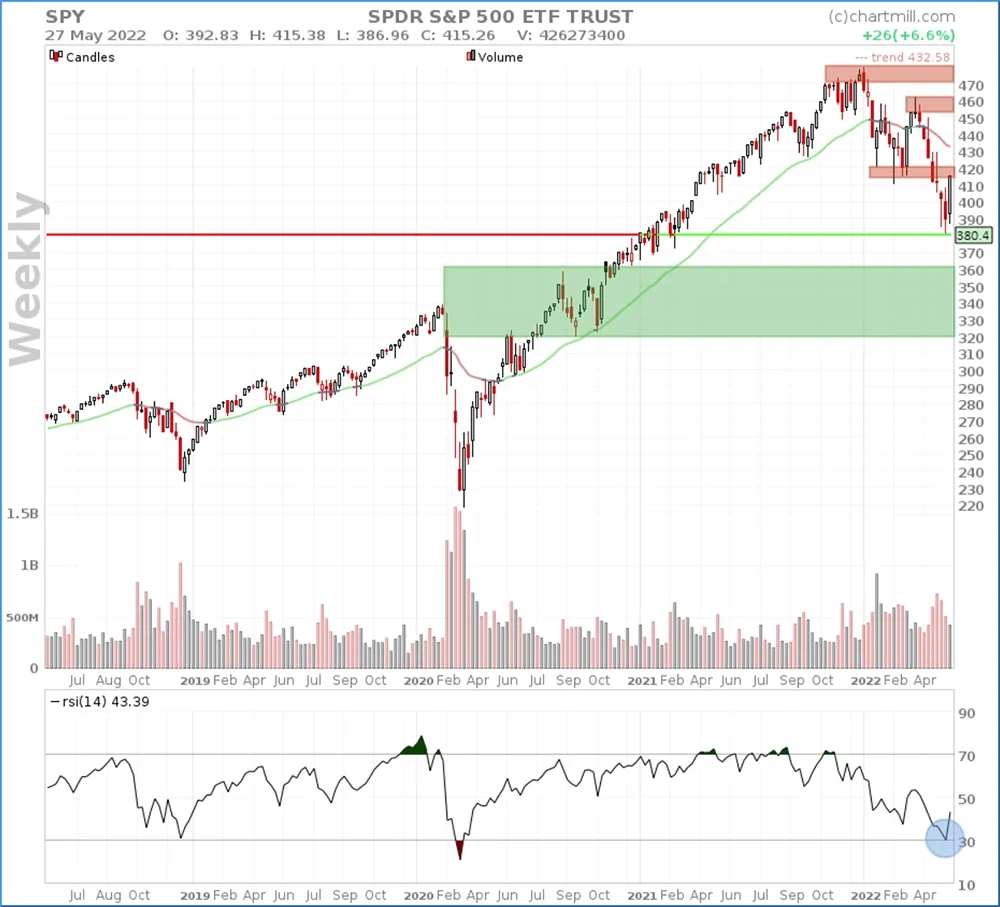
Despite the long impressive white candle, the long-term trend for the SPY is still negative. The price closed Friday against the previous support level around $420, which has now become a moderate resistance level. The RSI did just touch the 30 level delivering a first oversold signal. The previous RSI buy signal dates back to mid-February 2020 and it heralded the beginning of a v-shape reversal.
This strong performance may continue next week, at least to the level of the descending ChartMill Trend indicator.
- ChartMill Trend Indicator: RED (down)
- Stage Analysis phase: 4 (declining)
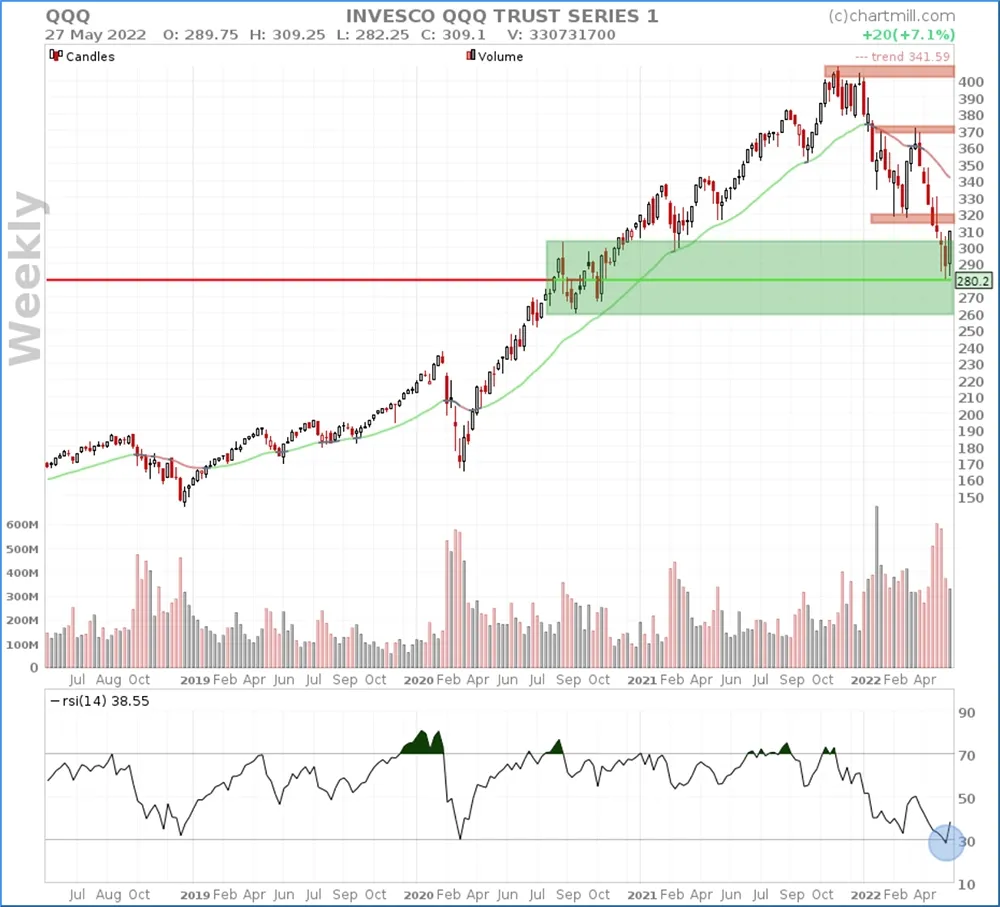
The $300 level cited in the previous market update was reached, we expected some resistance there and that is exactly what is currently going on in the QQQ. A solid recovery move with the RSI even quoting lower than in February 2020.
- ChartMill Trend Indicator: RED (down)
- Stage Analysis phase: 4 (declining)
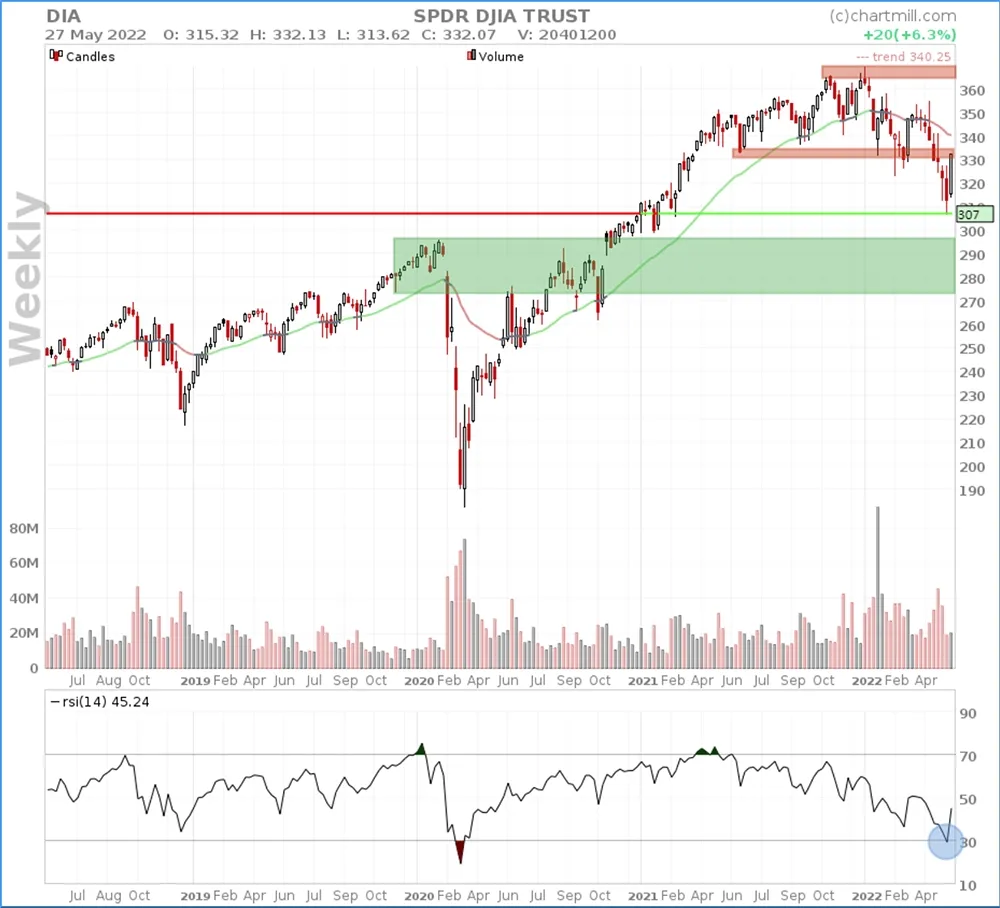
The DIA was still able to hold above the $300 level for the time being but the drop in the RSI indicator < 30 that we drew attention to in the previous update did happen. Nevertheless, even this strong recovery cannot hide the fact that the long-term trend remains negative for the time being.
- ChartMill Trend Indicator: RED (down)
- Stage Analysis Phase: 4 (declining)
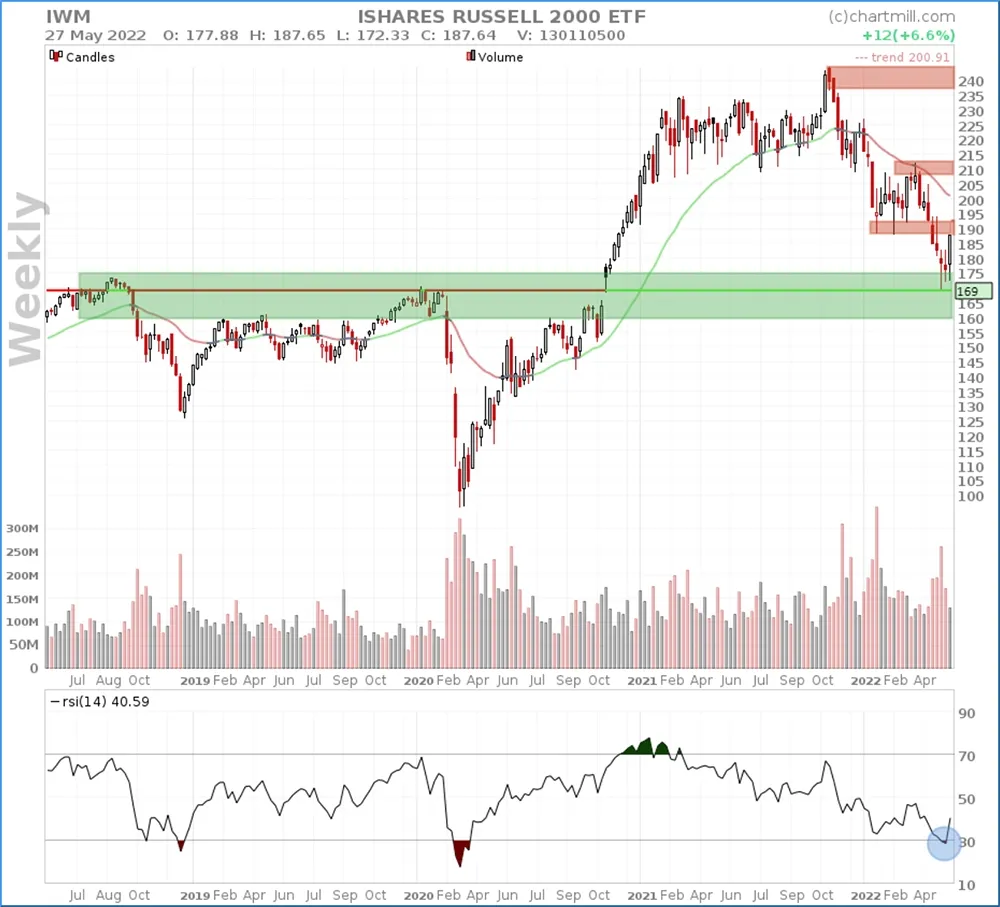
The IWM tested the support indicated in the previous update at $173. Again, this was accompanied by an RSI buy signal. However, the way up is still long and there are multiple pitfalls with resistance levels starting at $190, $210 and the existing top around $240.
- ChartMill Trend Indicator: RED (down)
- Stage Analysis Phase: 4 (declining)
Summary
The bear may have taken a few hits but it is still growling loudly... The current momentum may well allow us to see some more upside price potential next week. In doing so, keep a particular eye on the existing resistance levels, especially the falling ChartMill Trend Indicator level.
However, there is still a long way to go before we can speak of a structural price recovery, as the long-term trend is still negative until further notice. The most recent swinglow is now the reference point for the coming week or weeks, it is imperative that this level holds. We consider the probability of a V-shape reversal as with the corona crisis to be extremely low. The RSI buy signal is a first signal that there is bottom formation at these levels. On the other hand, we cannot ignore the fact that the volumes with which the recovery announced itself this week were of substandard level. So mixed signals for the medium term.
The ChartMill Team
![]()
![]()
![]()
![]()