Friday’s market breadth lost momentum after Thursday’s broad surge, but the bigger picture did not materially break down. Participation remains much healthier than it was two weeks ago, even as the market shifted into a more selective, pause-and-digest mode.
Based on the screenshots, the most recent breadth data is for Friday, April 10, 2026. So despite your prompt mentioning April 8, this analysis is based on the latest visible dataset.
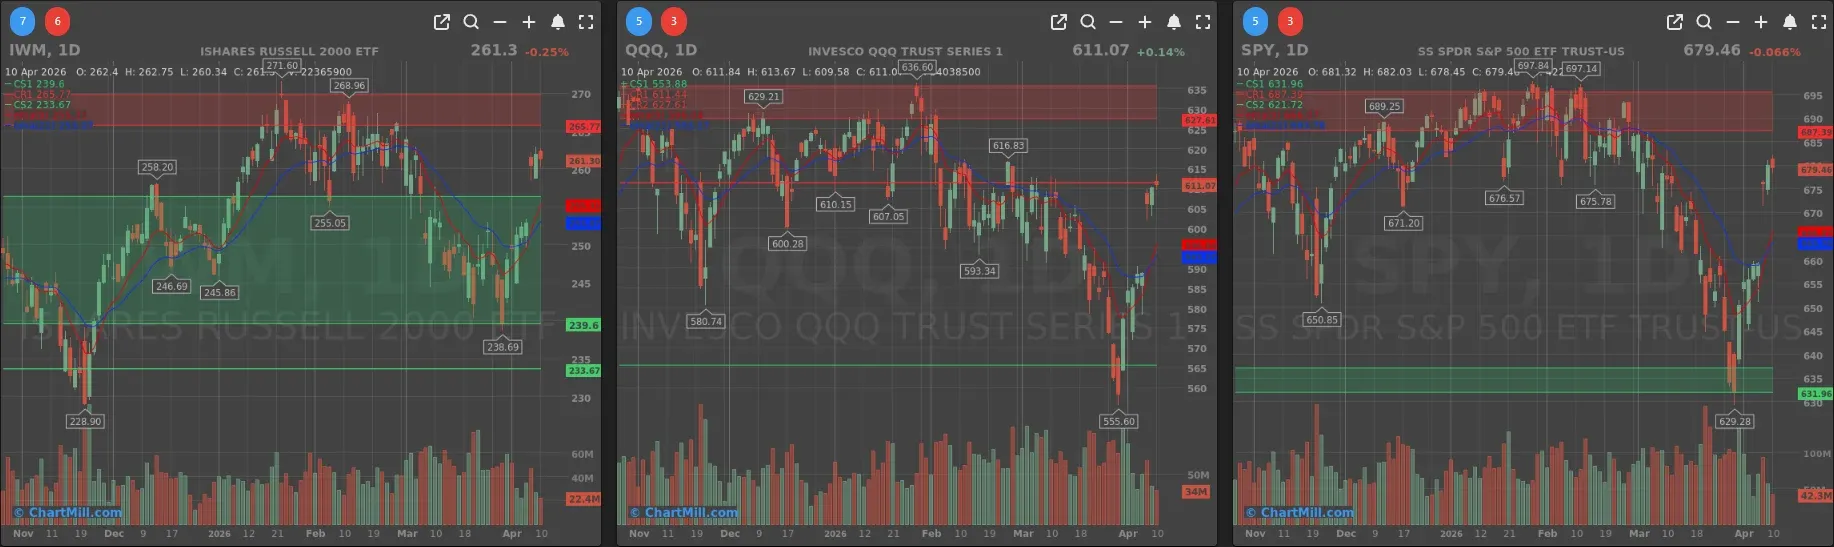
Index Overview (SPY, QQQ, IWM)
Short Term (Daily)
Long Term (Weekly)
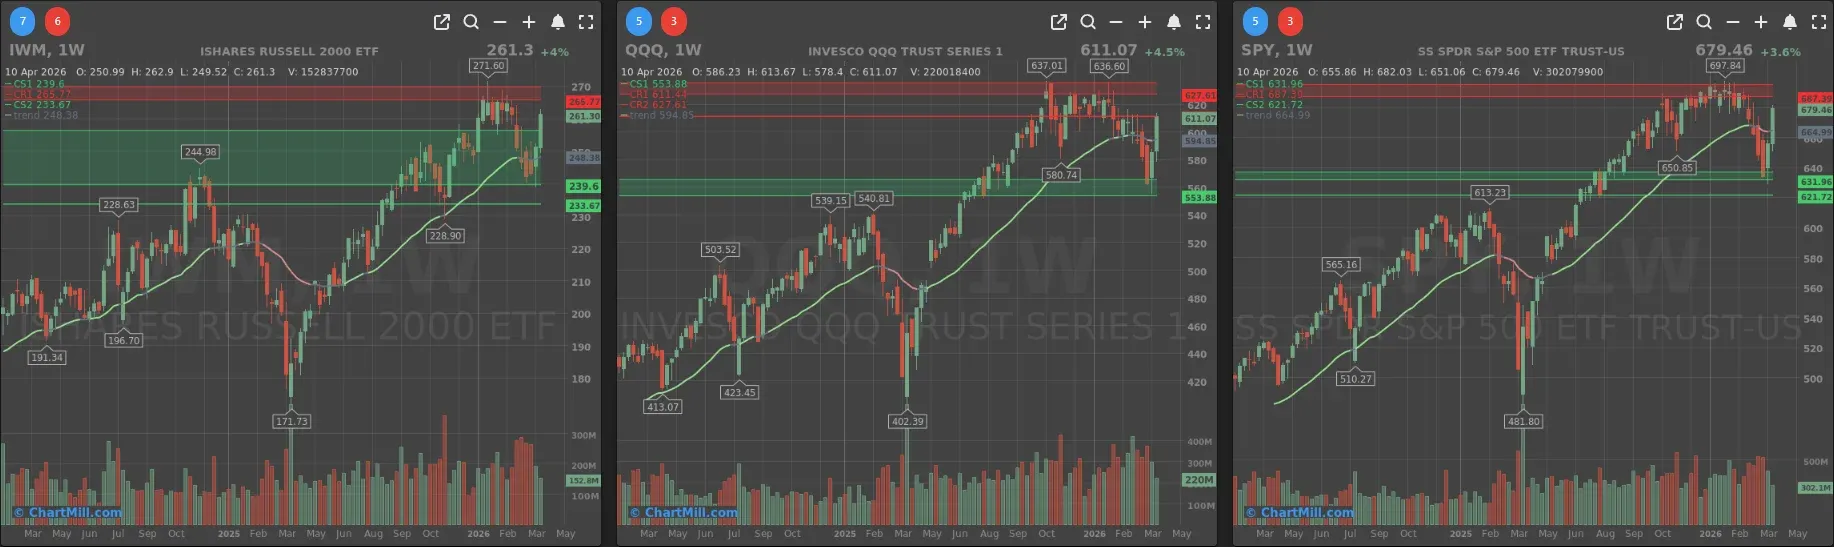
SPY finished almost flat at $679.46, after a sharp rebound off the recent low near 629. On the daily chart, price has recovered strongly and is now pressing back into the lower part of prior resistance, with the next overhead zone still sitting above. On the weekly chart, SPY has stabilized meaningfully and is back above the longer-term trend line, but it is not yet in a position where the broader uptrend looks fully reasserted.
QQQ closed at $611.07, also basically unchanged on the day. The rebound from the recent low near 555.6 remains impressive, but the daily chart now sits close to overhead supply in the 611-617 area, with heavier resistance above that. On the weekly chart, QQQ has improved from outright damage to something closer to stabilization.
IWM slipped modestly to $261.30, but relative to the other two, small caps continue to look constructive. The daily chart has rebounded well from the March washout, and the weekly chart remains above its long-term trend line.
The important point is that all three indices are still holding onto the recovery structure built earlier in the week. Friday was a cooling session.
Breadth summary: a pause after the thrust
That cooling is visible immediately in the breadth data.
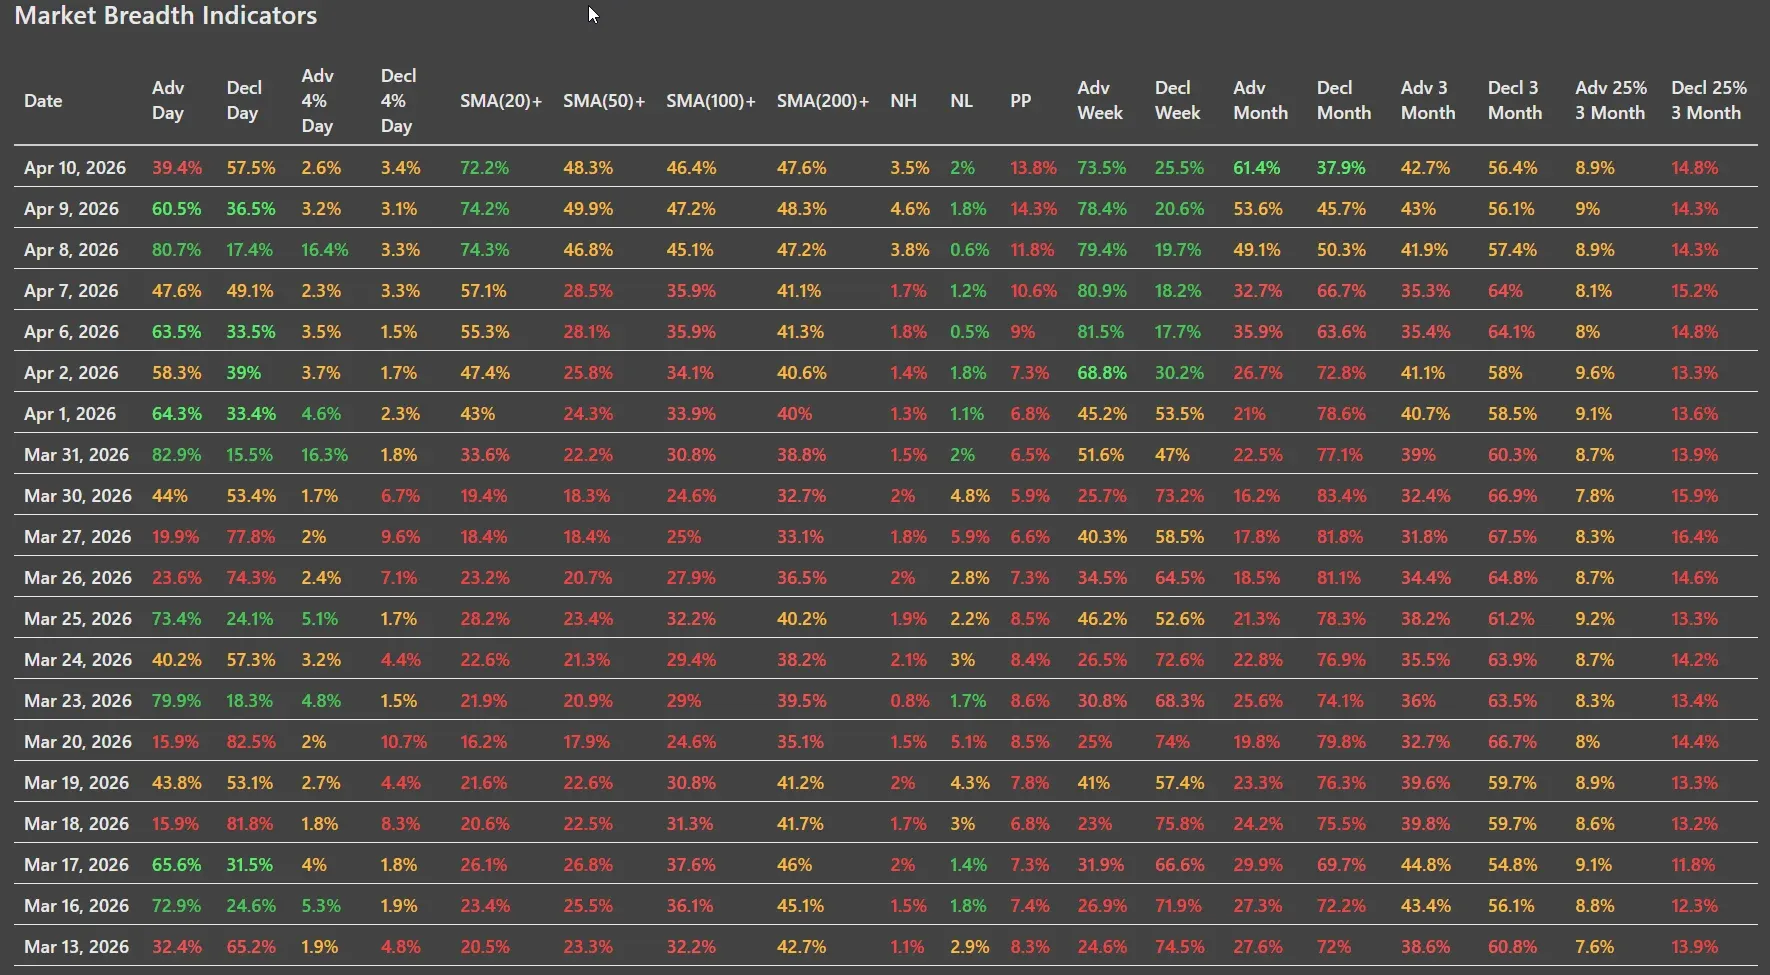
Daily breadth weakened notably from Thursday. Advancers dropped to 39.4% versus 60.5% the day before, while decliners rose to 57.5%. Stocks gaining more than 4% came in at just 2.6%, versus 3.4% losing more than 4%. That is not the profile of a broad expansion day. It is the profile of a market that has become more selective after a sharp upside burst.
And yet the more important data remains under the surface:
- 72.2% of stocks are above their 20-day SMA
- 48.3% are above the 50-day SMA
- 46.4% are above the 100-day SMA
- 47.6% are above the 200-day SMA
Compared with Thursday, these numbers softened only slightly. That matters. Thursday’s thrust was broad enough that even with Friday’s weaker tape, the market did not surrender much of the internal repair.
New highs versus new lows also stayed reasonably balanced at 3.5% versus 2.0%. That is not explosive, but it is far healthier than what we saw during the late-March washout, when new lows were consistently dominating the tape.
Short-term vs medium-term participation
This is where the message gets more nuanced.
The 1-week breadth numbers remain strong at 73.5% advancers versus 25.5% decliners. That confirms the recent rebound phase is still very much visible in the short-term data.
The 1-month breadth profile is now also constructive, with 61.4% advancers versus 37.9% decliners. That is another meaningful improvement and shows that the rebound is no longer just a one- or two-day event.
But the 3-month data still tells a more cautious story. Over that period, decliners still lead advancers by 56.4% to 42.7%, and far more stocks remain down 25% over three months (14.8%) than up 25% (8.9%). In other words, the short-term tape has improved much faster than the intermediate-term damage has healed.
That is why this market can feel a lot better tactically than it still looks structurally.
Compared with the previous session
Relative to Thursday’s breadth breakout, Friday mostly looks like a normal follow-through pause.
Thursday had the kind of numbers that are often difficult to immediately build on. With more than 80% advancers and a big expansion in strong movers, the bar was high. Friday did not confirm that surge with another broad upside day, but it also did not negate it. The most encouraging part is that the percentage of stocks above key moving averages stayed largely intact.
So the pattern from the last few sessions remains intact:
panic low, violent rebound, improving participation, then selective consolidation.
How the market news fits in
The news backdrop helps explain the tone, but it has to be handled carefully.
The biggest geopolitical escalation in the news report - the collapse of the Iran talks and the U.S. blockade order in the Strait of Hormuz - belongs to the weekend and Monday setup, not to Friday’s breadth data. That development was disclosed after the Friday close, so it should not be used as an explanation for Friday’s internals.
What does fit Friday’s tape is the more cautious tone described in the news report heading into the weekend, along with a market still digesting hotter inflation data and sector rotation inside tech. The report notes that Friday already felt more restrained after the earlier ceasefire rally, while March CPI rose to 3.3%, consumer inflation expectations climbed to 4.8%, and leadership within tech remained concentrated in AI infrastructure and hardware rather than software.
That context matches the breadth data well.
Bottom line
The market’s internal condition is still improving, just not in a straight line.
Friday’s breadth was weaker than Thursday’s and clearly less convincing on a one-day basis. Short-term and monthly participation have improved sharply, new lows are no longer dominating, and the rebound in stocks above their 20-day average remains strong. At the same time, the fact that fewer than half of stocks are back above their 50-, 100-, and 200-day averages tells you this is still a recovery phase.
The tone has shifted from outright internal damage to tentative repair. That is not yet the same thing as durable internal strength.
Breadth trend rating: 5 — neutral to positive bias
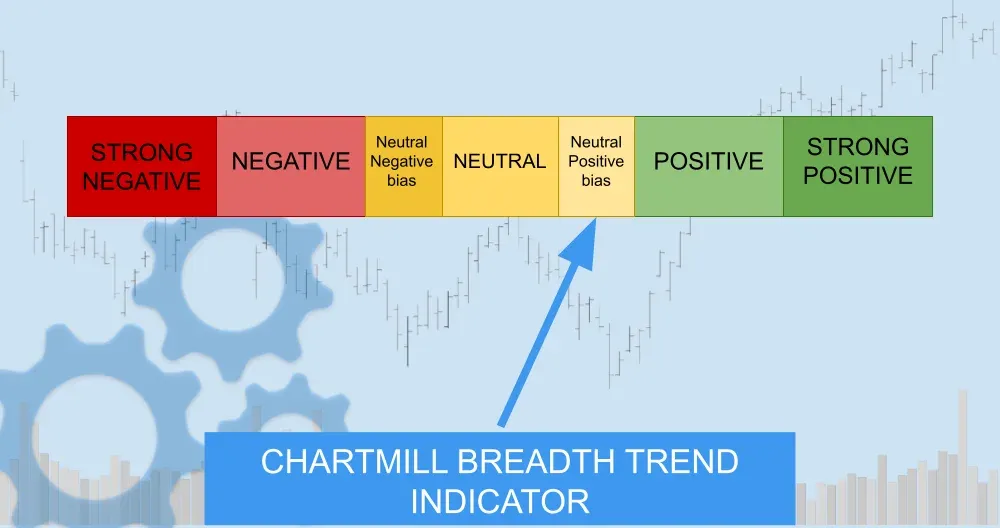
That rating fits best here. The market is no longer behaving like a very weak breadth environment, and the recent recovery has real internal substance behind it.
The bulls still have the momentum edge. They just do not yet have full control.
ChartMill Market Desk
This daily Market Breadth Report is prepared by ChartMill for informational purposes only and does not constitute investment advice. Always do your own due diligence before making investment decisions.
Next to read: Trump Orders Hormuz Blockade After Iran Talks Collapse, Markets Face a Rocky Open