The market is no longer in the very weak condition seen late last week, but the evidence is still not strong enough to call this a fully healthy breadth environment. Short-term participation improved further, while intermediate- and long-term breadth remain mixed to weak.
Index Overview (SPY, QQQ, IWM)
Short Term (Daily)
Long Term (Weekly)

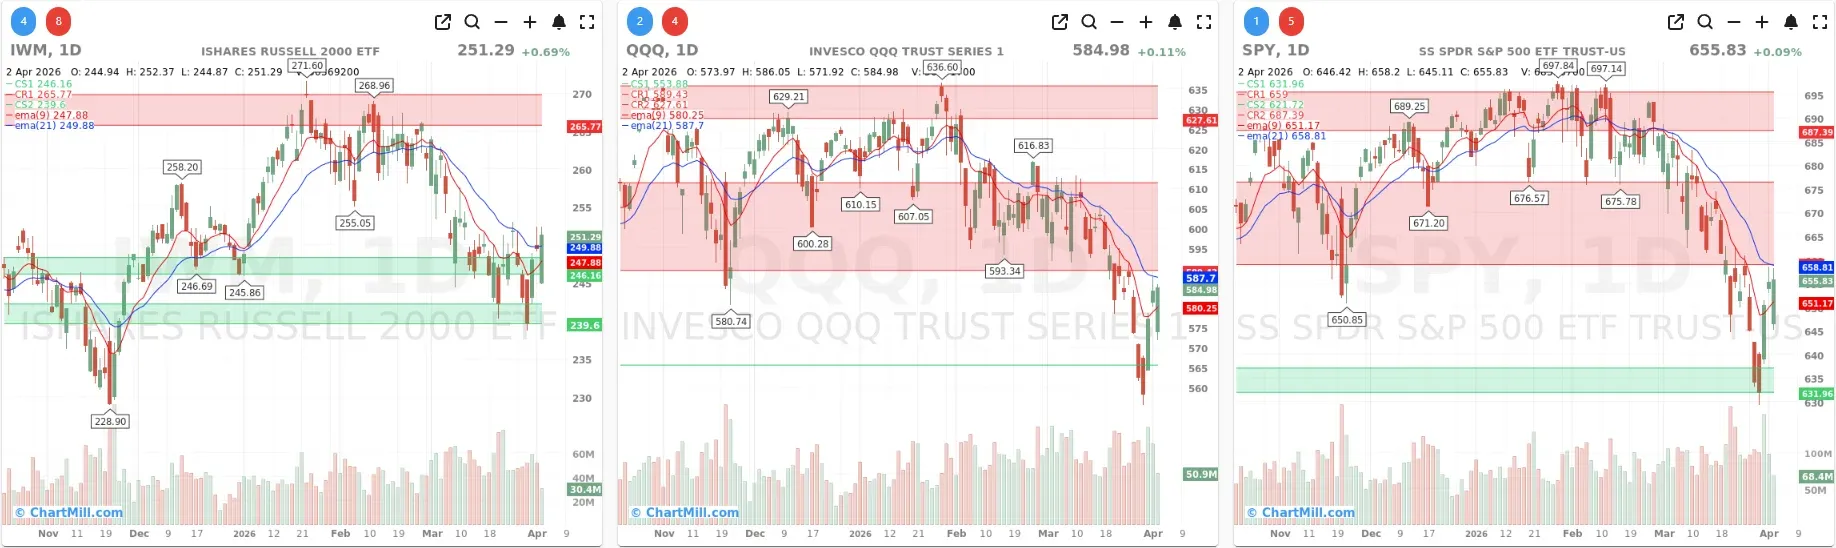
SPY added only marginally on Thursday, but the more important point is that it held Wednesday’s rebound and closed at $655.83, remaining above its EMA9 (651.17) while still below the EMA21 (658.81). That keeps the short-term picture in recovery mode, but not yet fully repaired.
This is broadly in line with what Wednesday’s analysis suggested. The sharp rebound had improved the tone, but the next question was whether the market could stabilize rather than immediately give back the move.
The weekly chart still calls for restraint. SPY remains below the ChartMill Trend Indicator at 663.99, so the long-term trend signal remains negative.
QQQ closed at $584.98, also preserving the rebound structure. Like SPY, it is back above its EMA9 (580.25), but still below the EMA21 (587.70). This leaves the Nasdaq 100 in a similar technical position: improving, but not yet convincingly strong.
Compared with Wednesday, this is another sign of continuation rather than reversal. The rebound is holding, but the market is not yet showing the kind of thrust that would suggest a decisive trend change. Buyers are present, but they are not yet in full control.
On the weekly timeframe, QQQ remains the weakest of the large-cap benchmarks structurally. It is still below the ChartMill Trend Indicator at 593.73, so the long-term trend reading stays negative.
IWM continues to stand out. It gained 0.69%, outperforming both SPY and QQQ, and closed at $251.29. Unlike the other two indexes, it is now above both the EMA9 (247.88) and the EMA21 (249.88). That gives small caps the strongest daily chart of the three.
This is an important continuation from Wednesday’s improvement. IWM had already shown relative resilience by reclaiming its short-term moving averages, and Thursday strengthened that signal. Small caps are not yet in breakout mode, but they are clearly acting better than the broad large-cap benchmarks.
The weekly chart is also relatively better. IWM closed above its ChartMill Trend Indicator (247.49), giving small caps the strongest long-term posture of the three benchmarks right now (neutral). Whether that turns into sustained leadership still needs to be proven, but for now IWM is the index showing the healthiest technical balance.
Market Breadth Data

Thursday’s breadth data confirms that the rebound did not immediately run out of steam.
The most notable daily figures are these:
- Advancing stocks: 58.3%
- Declining stocks: 39.0%
- Stocks up more than 4%: 3.7%
- Stocks down more than 4%: 1.7%
Those are not explosive numbers, but they are solid. After Wednesday’s recovery-oriented session, Thursday added another constructive breadth day. That matters because strong one-day reversals are much more meaningful when they are followed by stability rather than instant failure.
The short-term participation figures also improved again:
- Above SMA(20): 47.4% vs 43.0% on Wednesday
- Above SMA(50): 25.8% vs 24.3%
- Above SMA(100): 34.1% vs 33.9%
- Above SMA(200): 40.6% vs 40.0%
The rise in the SMA(20)+ reading is especially relevant. It shows that the recovery is spreading further through the market on a short-term basis. Still, context matters: even after two better sessions, less than half of stocks are back above their 20-day average, and only about a quarter are above the 50-day average. So the bounce is improving breadth, but it has not yet restored broad technical strength.
The new highs/new lows data remains mixed:
- New Highs: 1.4%
- New Lows: 1.8%
That is a clear improvement from the more stressed readings seen earlier in the decline, but it is still not the profile of a healthy bullish market. In strong uptrends, new highs should begin to dominate clearly. That is not happening yet.
The Pocket Pivot reading came in at 7.3%, up from 6.8%. That is another small positive step, but again not enough by itself to signal a fully repaired market.
Multi-Day Breadth Context
The broader trend is where the caution still comes in.
Weekly breadth improved sharply:
- Advancing week: 68.8%
- Declining week: 30.2%
That is a major improvement from Wednesday’s weekly split of 45.2% advancers versus 53.5% decliners. It tells us that the late-March weakness is being countered by a meaningful short-term rebound.
But the monthly and 3-month figures remain poor:
- Advancing month: 26.7%
- Declining month: 72.8%
- Advancing 3 months: 41.1%
- Declining 3 months: 58.0%
This is the key reason the overall breadth rating stays only neutral. The short-term tone has improved, but the intermediate backdrop is still burdened by the damage done in recent weeks.
The same message appears in the more extreme participation measures:
- Advancing 25% over 3 months: 9.6%
- Declining 25% over 3 months: 13.3%
That remains a weak long-term participation profile. It shows that leadership is still limited and that the market has not yet rebuilt a broad base of strong trends.
What Changed Versus Wednesday?
Thursday did not invalidate Wednesday’s positive interpretation. It reinforced it, but in a measured way.
Yesterday’s takeaway was that breadth had improved materially, but that one strong rebound day alone was not enough to declare victory. Today’s data supports that caution. The market continued to heal, yet it did so without a major upside expansion in the headline indexes. That is actually useful information: the recovery is broadening beneath the surface, but it is still in an early and incomplete stage.
In short:
- the rebound is real,
- the participation is better,
- small caps are acting best,
- but the weekly charts for SPY and QQQ and the longer-horizon breadth data still say: do not overstate the improvement.
Final Takeaway
Thursday’s market breadth data keeps the recovery case alive. The market is no longer in the same fragile state it was in late last week, and the improvement in daily and weekly breadth shows that sellers have lost some control in the near term.
Still, this remains more of a repair phase than a confirmed new uptrend.
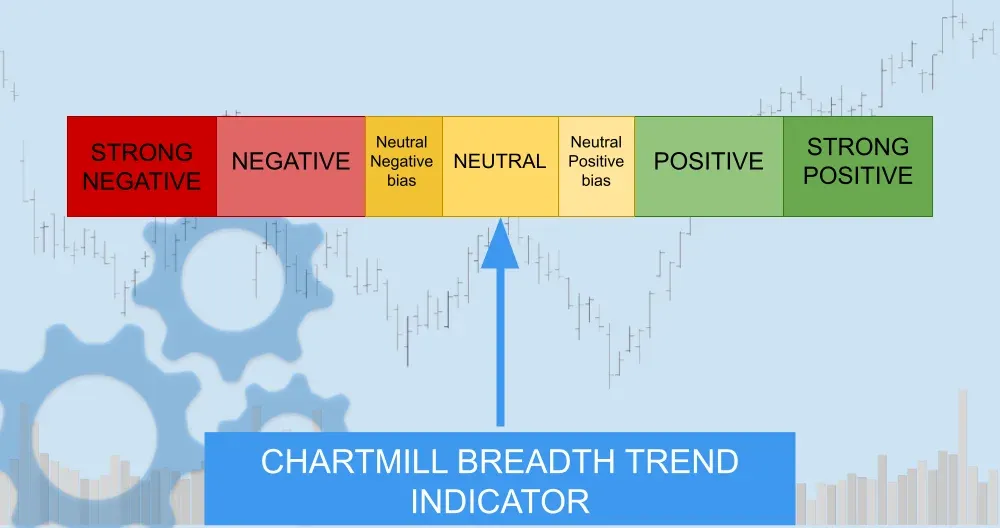
Rating: 4/7 — Neutral Bias
SPY and QQQ are stabilizing but still below their EMA21 on the daily chart and still negative on the weekly trend reading. IWM is in better shape and is currently the relative leader. Under the surface, breadth is improving, but the longer-term participation metrics remain too weak to support an outright bullish conclusion.
That leaves the current breadth trend at neutral: clearly better than a few sessions ago, but not yet strong enough to call broadly positive.
ChartMill Market Desk
This daily Market Breadth Report is prepared by ChartMill for informational purposes only and does not constitute investment advice. Always do your own due diligence before making investment decisions.
Next to read: Oil at $111, Tesla Stumbles, and Trump's Pharma Bombshell