The overall breadth picture remains decisively weak. Short-term participation collapsed again on Friday, and the broader 1-month and 3-month readings continue to show a market where selling pressure is dominant across a wide range of stocks.
This is no longer just a short-term wobble in the index charts; the weakness is now also reflected in the confirmed weekly trend structure of the major averages.
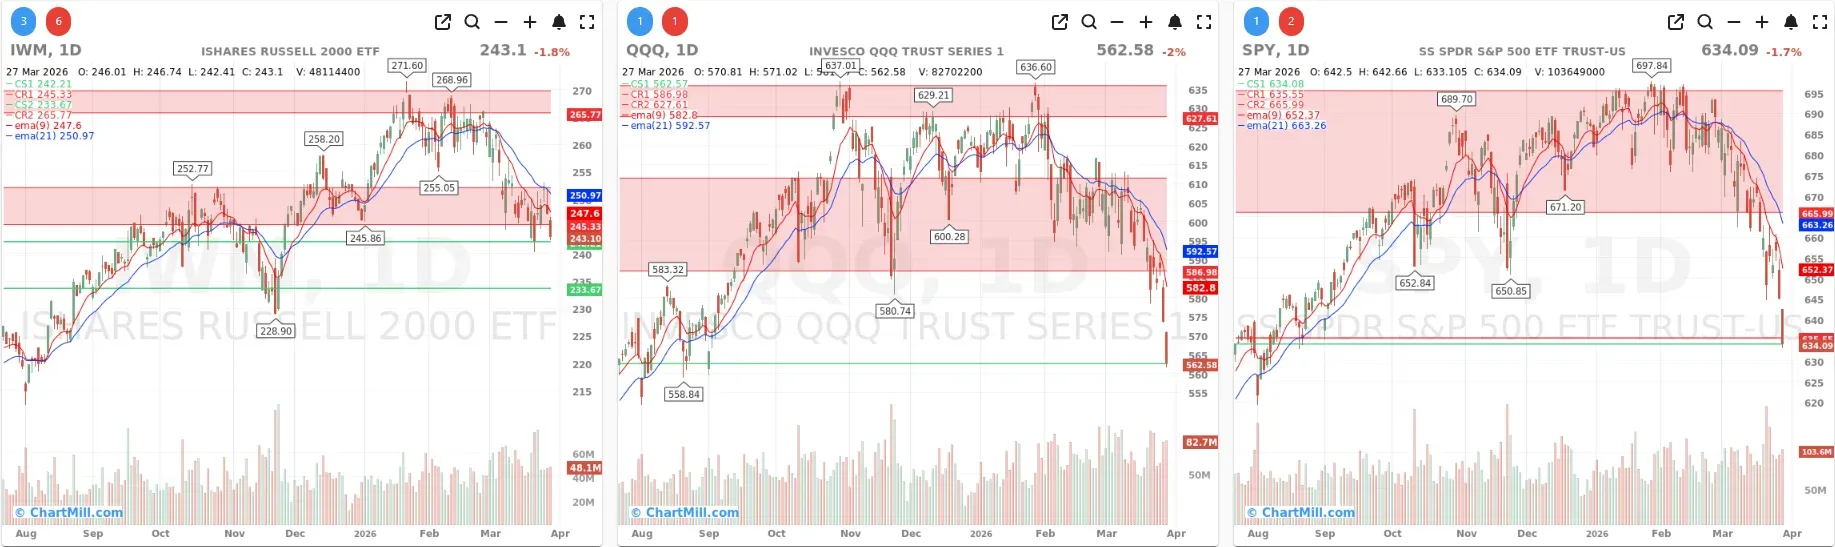
Index Overview (SPY, QQQ, IWM)
Short Term (Daily)
Long Term (Weekly)
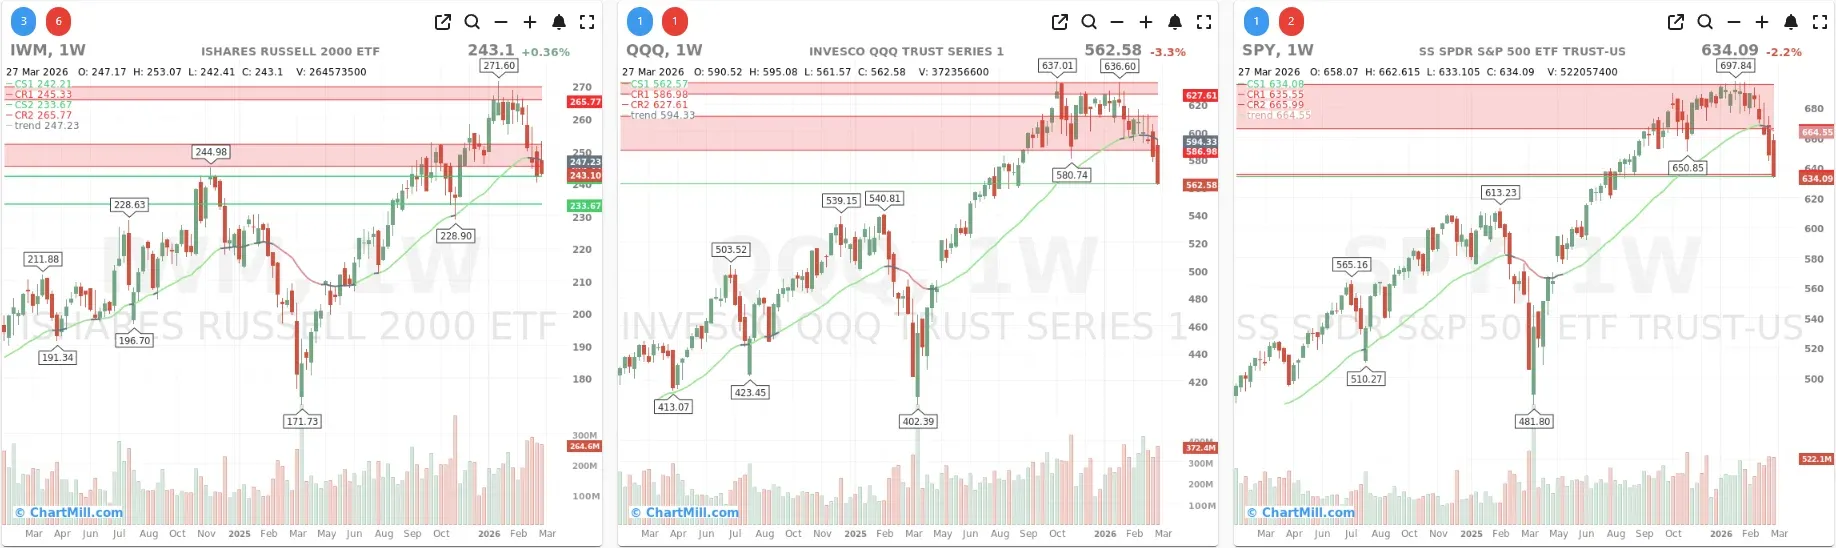
SPY ended the week at $634.09, down sharply and right on an important support zone. The bigger message is on the weekly chart: the ChartMill Trend Indicator has now closed the week in red, confirming the long-term deterioration that had already started to emerge earlier this week.
That matters because Thursday’s weakness already suggested that Wednesday’s rebound attempt was failing. Friday’s action removed most of the remaining doubt. SPY is not just below its daily EMA9 and EMA21, it has also lost the stronger look it had maintained for most of the prior uptrend. What had looked like a pullback is increasingly behaving like a broader trend reset.
The index is now stretched on the downside in the short term, but from a breadth perspective that alone is not enough to call for a durable low. A market can stay oversold when internal participation remains this poor.
QQQ closed at $562.58, a fresh leg lower and another sign that growth and large-cap leadership remain under pressure.
QQQ had already been acting weaker than many traders wanted to admit. Thursday’s data hinted that Wednesday’s strong advance day was little more than a temporary interruption in a bearish sequence. Friday confirmed that interpretation. Price is now well below the daily EMA9 and EMA21, and the selloff pushed QQQ into a key support area near the current close.
When the Nasdaq leadership cannot regain short-term moving averages and breadth keeps worsening underneath, rallies tend to be sold rather than accumulated. That remains the dominant pattern for now.
IWM closed at $243.10, down for the day and back under pressure after failing to build on earlier rebound attempts. Small caps had shown relative resilience at times during this choppy period, but Friday’s action shows that they are not escaping the broader risk-off tone.
On the daily chart, IWM is also below both the EMA9 and EMA21. On the weekly chart it is testing an important longer-term area around the trend zone near 247. In other words, small caps are now also being forced to prove themselves. They have not broken down as decisively as QQQ from a long-term structural standpoint, but they are no longer providing meaningful offsetting strength either.
Breadth data: Friday was another clear distribution day
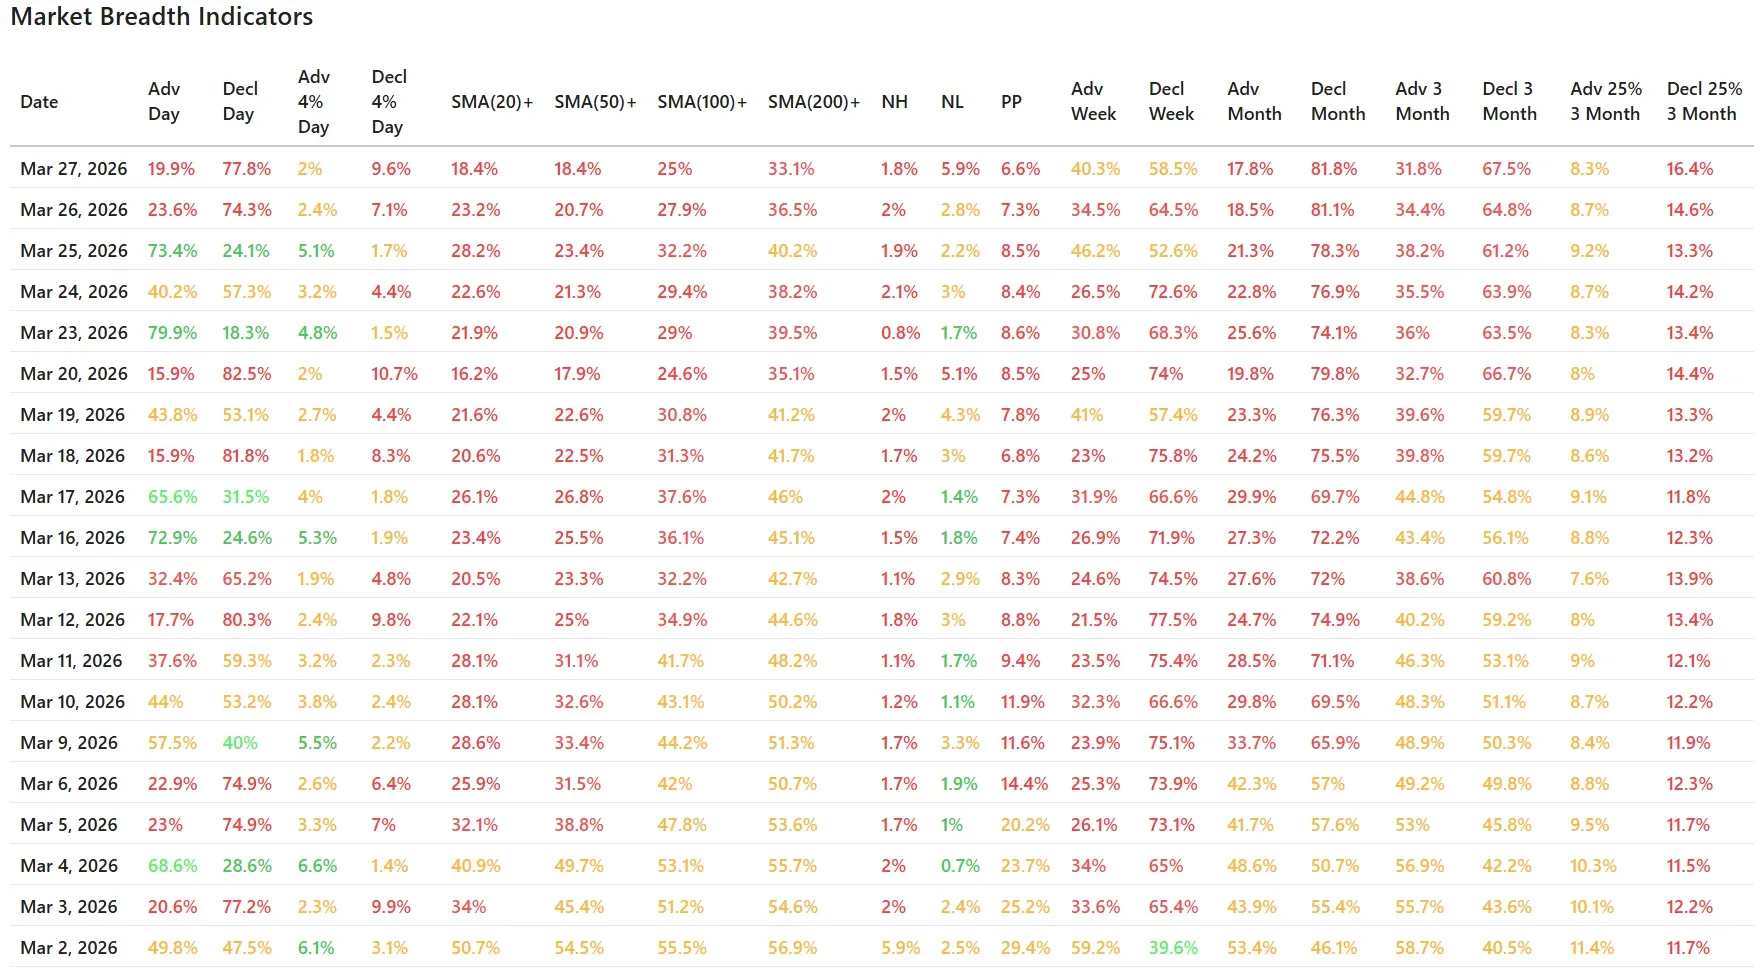
The headline numbers were poor:
- Advancing stocks: 19.9%
- Declining stocks: 77.8%
- Advancing 4%+: 2.0%
- Declining 4%+: 9.6%
This is a decisive negative breadth session, and worse, it comes immediately after Thursday’s already weak reading. So rather than seeing stabilization after Wednesday’s rebound day, the market delivered a second straight rejection. That strongly suggests the rally attempt lacked real sponsorship.
The very low 2.0% of stocks up 4% or more also tells you upside momentum is scarce. By contrast, nearly one in ten stocks fell more than 4%, which is a clear sign of expanding downside pressure.
Wednesday’s rebound has now clearly failed
This is one of the main continuity points from the previous update.
On March 25, breadth looked much better on the surface, with 73.4% advancers versus 24.1% decliners. But even then, the broader participation data never fully repaired. The percentage of stocks above key moving averages remained weak, and the weekly and monthly breadth figures did not confirm a meaningful shift in trend.
Thursday already raised doubts about that rebound. Friday confirms those doubts. What we are seeing is not a healthy market absorbing selling and rotating higher again. It is a market where brief rebound days are being overwhelmed by renewed distribution almost immediately.
Trend participation remains extremely poor
The moving-average breadth data stayed weak and deteriorated again:
- Above SMA(20): 18.4%
- Above SMA(50): 18.4%
- Above SMA(100): 25.0%
- Above SMA(200): 33.1%
These are depressed readings across the board. The fact that fewer than one in five stocks are above the 20-day and 50-day moving averages tells you the short- to intermediate-term trend structure is badly damaged. Even the SMA(200)+ reading at 33.1% shows that longer-term participation has continued to erode.
Compared with Thursday:
- SMA(20)+ fell from 23.2% to 18.4%
- SMA(50)+ fell from 20.7% to 18.4%
- SMA(100)+ fell from 27.9% to 25.0%
- SMA(200)+ fell from 36.5% to 33.1%
That is broad-based deterioration, not isolated weakness.
New lows expanded sharply again
Friday’s leadership metrics also worsened:
- New Highs: 1.8%
- New Lows: 5.9%
- Pocket Pivots: 6.6%
Thursday’s new lows were only 2.8%, so Friday’s jump to 5.9% is meaningful. New highs remain muted, and pocket-pivot participation slipped again. That combination tells the same story as the rest of the breadth table: the market is not finding new leadership, and the list of technically damaged stocks is growing again.
Weekly, monthly, and 3-month breadth still point lower
The broader lookback windows remain decisively negative:
- Adv Week: 40.3% vs Decl Week: 58.5%
- Adv Month: 17.8% vs Decl Month: 81.8%
- Adv 3 Month: 31.8% vs Decl 3 Month: 67.5%
- Adv 25% in 3 Months: 8.3%
- Decl 25% in 3 Months: 16.4%
These are not the statistics of a market in healthy rotation. They describe a market where weakness is persistent across timeframes.
The monthly data is especially telling. With only 17.8% of stocks advancing over the past month and 81.8% declining, this remains a broad correction rather than a narrow pullback in a few headline names. The 3-month numbers tell a similar story: damage has accumulated over time, and there is still no broad evidence of a durable internal turnaround.
What Changed Versus the Previous Day?
The main takeaway is that Thursday’s warning signs were validated, not reversed.
Yesterday’s update already pointed to the risk that Wednesday’s strong breadth day would turn into a failed rebound rather than the start of a real recovery. Friday’s data supports that bearish interpretation on several fronts:
- another heavily negative day for advancers vs. decliners
- further deterioration in moving-average breadth
- a sharp increase in new lows
- continued weakness in monthly and 3-month participation
- confirmed weekly technical damage in SPY and QQQ
So this is not a new story, but it is a more decisive one. The market has moved from “attempting to stabilize” to “failing to stabilize.”
Final Takeaway
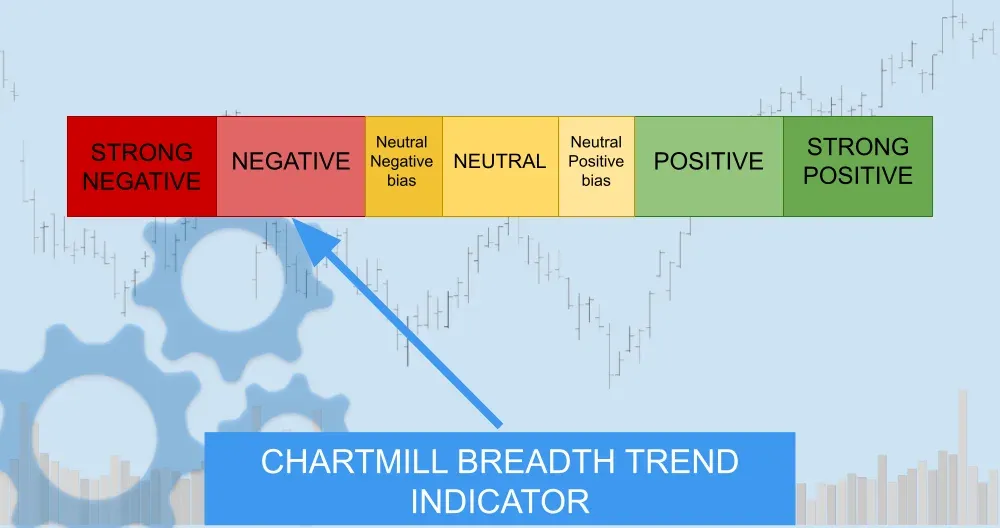
Breadth Trend Rating: 2/7 – Negative
Friday’s breadth data paints a clear picture: the market remains under broad internal pressure, and the rebound attempt from midweek has now convincingly failed. The daily charts already looked weak; the completed weekly close now adds more weight to that message, especially with SPY and QQQ confirming red long-term trend readings.
Could the market bounce from here? Yes, especially with major indexes sitting near important support and short-term conditions becoming stretched. But based on breadth alone, any bounce still has to be treated as suspect until participation improves materially.
Right now, the dominant message is unchanged: this remains a sellers’ market, not a healthy accumulation phase.
ChartMill Market Desk
This daily Market Breadth Report is prepared by ChartMill for informational purposes only and does not constitute investment advice. Always do your own due diligence before making investment decisions.
Next to read: Oil, War, and a Leaked AI Model: Wall Street Can't Catch a Break