
The market followed up Tuesday’s sharp rebound with another constructive session on Wednesday. Short-term breadth improved further and all three major index ETFs closed above their EMA9, but the broader backdrop remains fragile, with weak monthly breadth readings and still-unfavorable weekly trend signals for SPY and QQQ.
Index Overview (SPY, QQQ, IWM)
Short Term (Daily)

Long Term (Weekly)

SPY added 0.75% and closed at $655.24. On the daily chart, price remained above the EMA9 after reclaiming that level on Tuesday, but it still finished below the EMA21. That keeps the short-term picture in recovery mode rather than in a fully repaired uptrend.
On the weekly chart, SPY bounced from the lower support zone near 632, but the ChartMill Trend Indicator remains red, so the longer-term trend backdrop is still negative. Compared with Tuesday, this is a continuation of the rebound, not a structural change yet. Bulls have stabilized the immediate damage, but they have not yet regained control of the larger trend.
QQQ was the strongest of the three, rising 1.2% to $584.31. Like SPY, it held above the EMA9 on the daily chart, but it remains below the EMA21. That confirms a second day of short-term improvement after Tuesday’s washout reversal, but the Nasdaq still has overhead repair work to do.
On the weekly chart, QQQ rebounded from the lower support band around 558, yet the ChartMill Trend Indicator stays red. So while the daily action improved materially over the last two sessions, the longer-term picture still argues for caution. This remains a bounce inside a damaged trend structure.
IWM gained 0.63% and closed at $249.56. It also held above the EMA9 and nearly reached the EMA21, ending just under that level. That keeps small caps in a slightly better short-term technical position than they were late last week.
On the weekly chart, IWM continues to look relatively better than SPY and QQQ. The ChartMill Trend Indicator remains grey, not red, which reflects a neutral long-term trend rather than an outright bearish one. That relative resilience was already visible on Tuesday, and Wednesday’s action did nothing to change that. Small caps are not strong, but they are currently less weak than large-cap growth.
Breadth Data, a real upside thrust
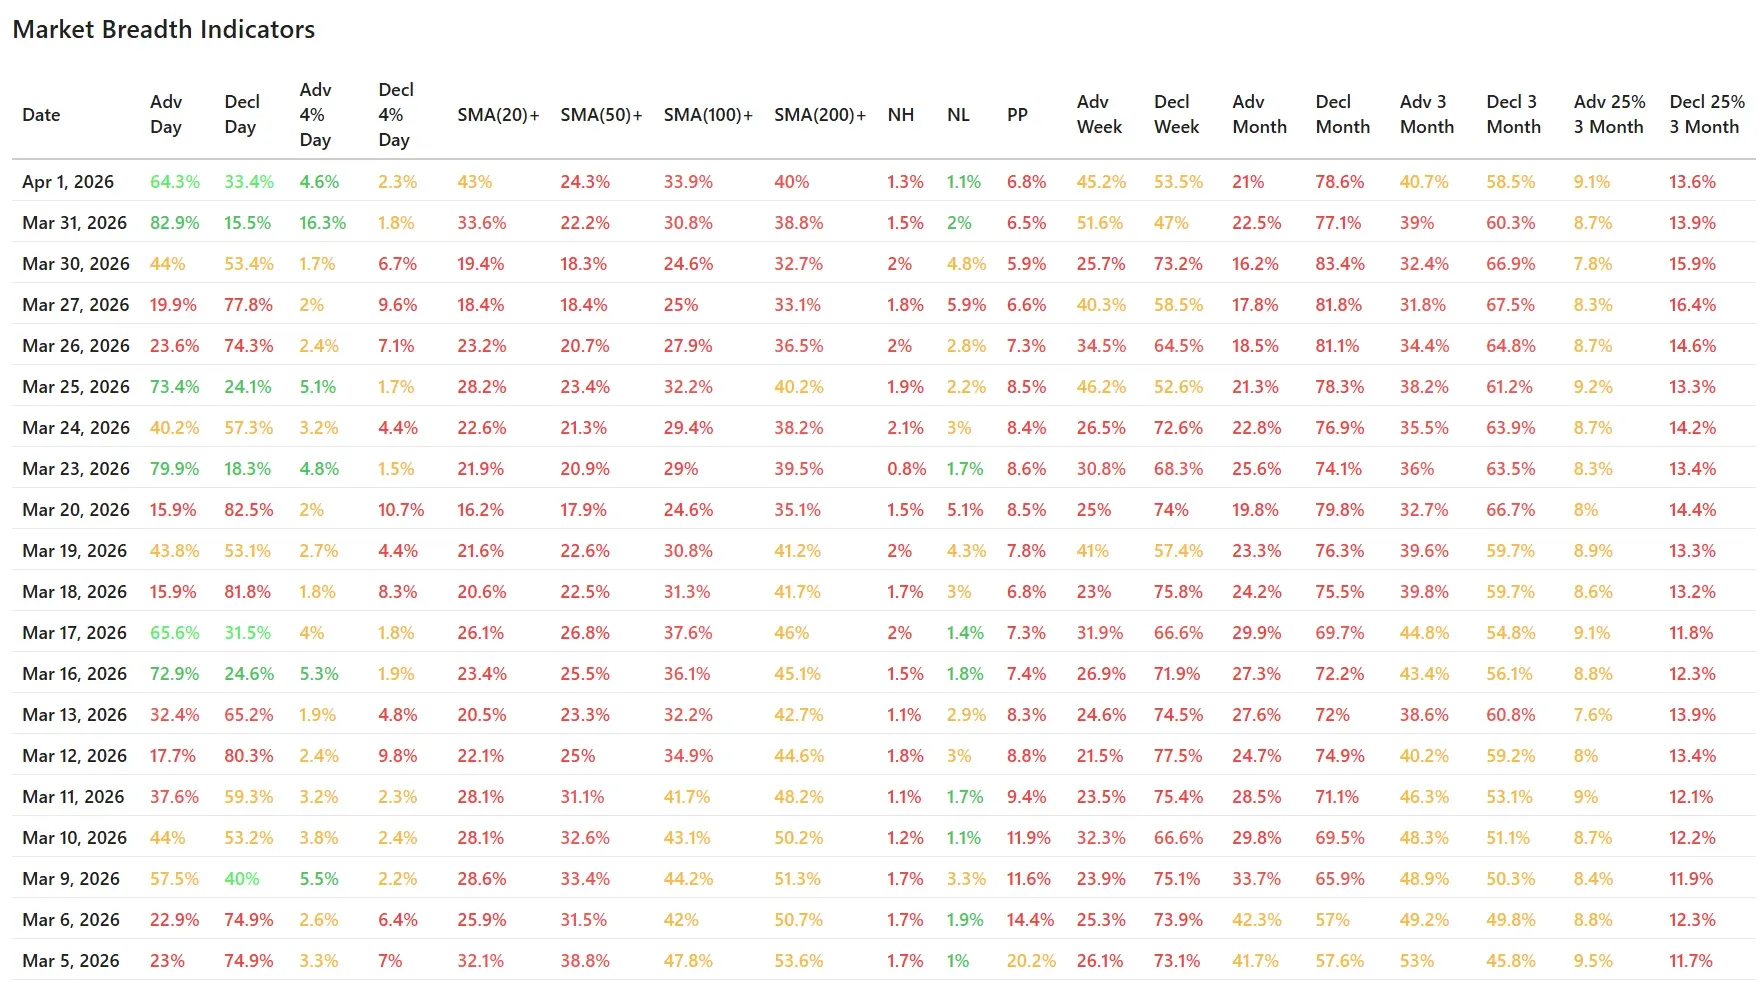
Wednesday’s breadth data confirmed that Tuesday’s surge was not a one-day fluke. Advancers beat decliners by 64.3% to 33.4%, a solid follow-through reading after Tuesday’s very strong 82.9% advancers. That is an important improvement, because after deeply washed-out conditions, one strong day is encouraging, but a second constructive day is what starts to build credibility.
At the same time, the quality of Wednesday’s session was more moderate than Tuesday’s. Stocks gaining more than 4% came in at 4.6%, down from 16.3% the previous day, while stocks falling more than 4% edged up to 2.3% from 1.8%. So the market still broadened out positively, but the thrust was less explosive. That is not necessarily a negative; it simply suggests the rebound is transitioning from panic reversal to more normal recovery behavior.
One of the more constructive developments was the continued rise in participation above key moving averages:
- 43.0% of stocks are now above their 20-day SMA, up from 33.6%
- 24.3% are above their 50-day SMA, up from 22.2%
- 33.9% are above their 100-day SMA, up from 30.8%
- 40.0% are above their 200-day SMA, up from 38.8%
These numbers show that Wednesday’s advance was not limited to a narrow group of large caps. Participation improved across multiple timeframes. Even so, the absolute levels remain weak, especially the 24.3% above the 50-day average. That is still a market where most stocks remain technically damaged.
New highs and new lows were nearly balanced at 1.3% NH versus 1.1% NL. That is another sign that the intense downside pressure has cooled, but it is not yet evidence of broad leadership. A healthy market usually shows a much stronger expansion in new highs. For now, this metric says the market is stabilizing, not thriving.
Short-Term vs. Intermediate-Term Picture
This remains the key message of the current tape.
In the short term, breadth clearly improved over the last two sessions. Tuesday brought the powerful reversal, and Wednesday added confirmation. All three major ETFs closed above their EMA9, and breadth participation broadened further. That is a meaningful improvement from the very negative setup we saw late last week and again on Monday.
But in the intermediate-term, the market still has a lot to prove:
- Weekly breadth is still negative at 45.2% advancers vs. 53.5% decliners
- Monthly breadth remains deeply weak at 21.0% advancers vs. 78.6% decliners
- Only 24.3% of stocks are above their 50-day SMA
- SPY and QQQ still carry red weekly ChartMill Trend Indicators
So yes, the rebound is real. But the broader evidence still points to a market trying to recover from damage, not a market that has already fully healed.
What Changed Versus Tuesday?
Tuesday’s main takeaway was that the market had produced a sharp breadth rebound from very weak conditions. The open question was whether that move would receive follow-through or quickly fade.
Wednesday answered that question reasonably well. The market did produce follow-through. Breadth stayed positive, participation above key moving averages improved, and the major ETFs held their reclaimed EMA9 levels. That is the constructive part.
What did not change is the larger context. The rebound has not yet been strong enough to flip the weekly trend picture for SPY and QQQ, and the broad monthly numbers still show that the recent decline did real damage under the surface.
Breadth Trend Rating
Rating: 3/7 — Neutral to Negative Bias
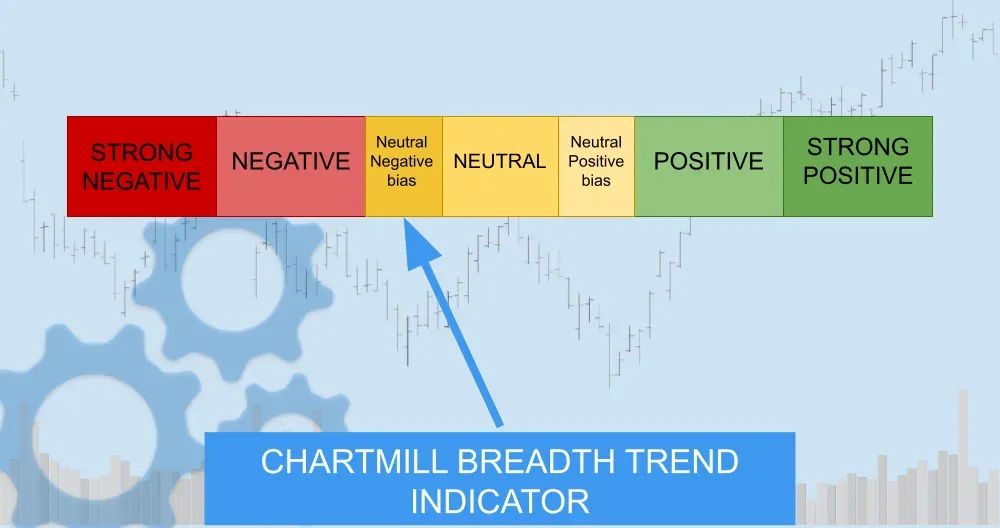
The short-term tone improved clearly over the last two sessions, so the market is no longer in the same highly deteriorated position seen late last week. Still, the bigger trend backdrop remains weak enough that a fully neutral reading would be too generous. This is a rebound inside a still-fragile market structure.
Bottom Line
Wednesday strengthened the case that the market is trying to build a short-term low. Breadth remained constructive, more stocks recovered key short-term levels, and the rebound broadened beyond a single-session snapback.
Still, the bigger picture has not flipped yet. The weak monthly breadth data, limited improvement above the 50-day average, and bearish weekly trend signals for SPY and QQQ all argue that this remains a recovery attempt rather than a confirmed return to broad market health.
ChartMill Market Desk
This daily Market Breadth Report is prepared by ChartMill for informational purposes only and does not constitute investment advice. Always do your own due diligence before making investment decisions.
Next to read: Nike's Brutal Reckoning and Trump's Murky Iran Script, Wall Street Refuses to Blink