Thursday’s breadth data confirms that the rebound remains intact, but it also shows a market that is advancing with less urgency than Wednesday’s surge suggested.
Participation continues to improve across key moving-average metrics, while the major indexes are now pushing into important resistance zones with investors balancing better internals against a still-cautious macro backdrop.
Context from the latest news flow helps explain that more careful tone, especially the fragile geopolitical relief, software weakness, Amazon’s AI revenue disclosure, and positioning ahead of Friday’s CPI report.
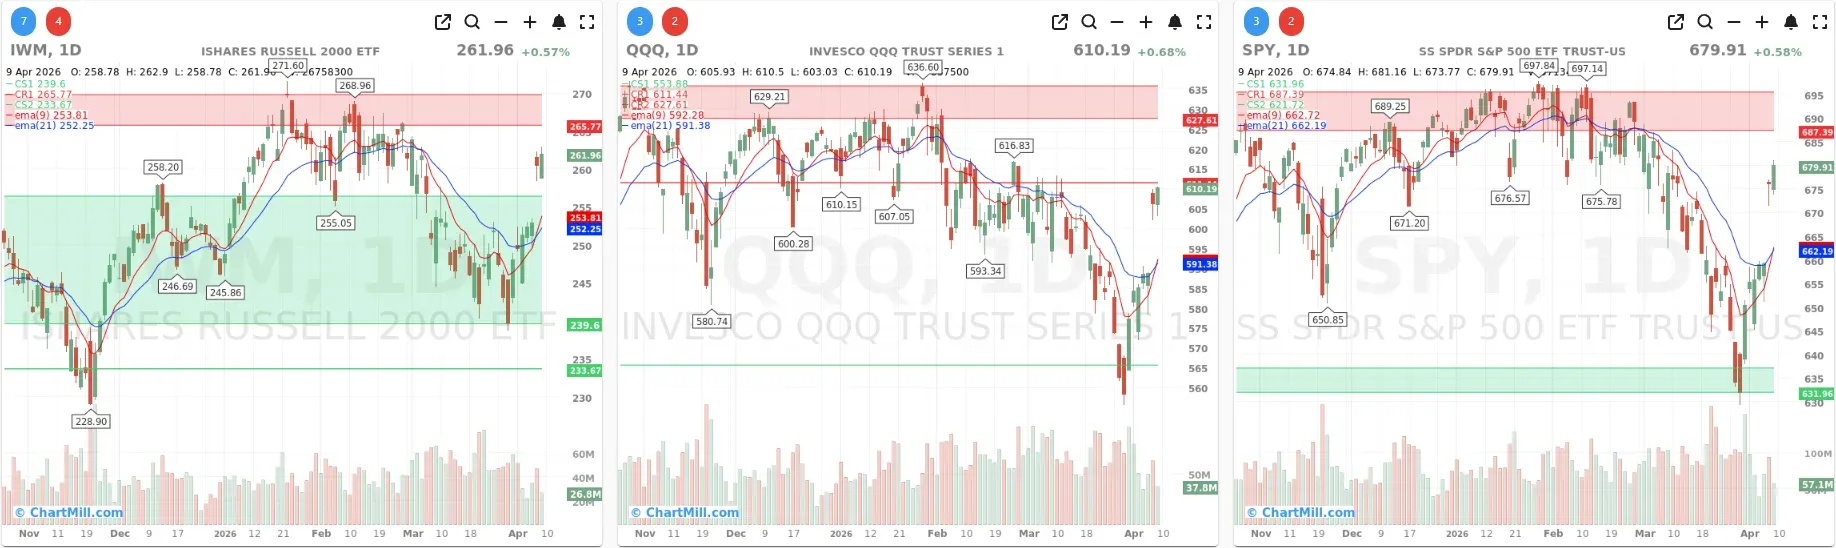
Index Overview (SPY, QQQ, IWM)
Short Term (Daily)
Long Term (Weekly)

SPY added another solid gain and closed at $679.91, holding above both the EMA9 (662.72) and EMA21 (662.19) on the daily chart. The ETF has now clearly bounced off the lower support zone near 631.96, but it is also approaching the next important resistance area around 687-690.
On the weekly chart, SPY has recovered well from the recent low and is back above the 30-week trend line area, but it still has not fully cleared the overhead resistance band.
Compared with the previous trading day, this fits the same general idea: the rebound is continuing, but now the market has reached a level where upside progress is naturally becoming harder.
QQQ closed at $610.19, also above both the EMA9 (592.28) and EMA21 (591.38). That keeps the short-term rebound intact. Still, QQQ remains the most visibly constrained by overhead resistance in the near term. On the daily chart, the first key level sits around 616.83, with heavier resistance higher near 627.61.
On the weekly chart, QQQ has rebounded sharply from the recent low, but it is still working through resistance rather than trading freely above it.
IWM closed at $261.96, comfortably above the EMA9 (253.81) and EMA21 (252.25). Unlike QQQ, it is already trading back deeper into its former range and is closer to testing the resistance band around 265.77 to 268.96.
On the weekly chart, IWM is still below its upper resistance zone, but it has repaired a lot of technical damage in a short period of time.
Yesterday I noted that the rebound was broadening. Today’s IWM action supports that view.
What the Breadth Data Says

The most important takeaway from Thursday is this: breadth stayed constructive, even though the upside thrust cooled noticeably from Wednesday’s very strong session.
1) Daily breadth stayed positive, but with less force
- Advancing stocks: 60.5%
- Declining stocks: 36.5%
Still clearly positive, but it is a step down from Wednesday’s very strong 80.7% advancing reading.
The same is visible in the 4% movers:
- Adv 4% day: 3.2%
- Decl 4% day: 3.1%
Yesterday’s data showed a strong upside expansion. Today’s figures are much more balanced. That tells me momentum definitely lost intensity.
2) Trend participation continued to improve
This is where Thursday’s report becomes more encouraging than the top-line daily breadth numbers alone would suggest.
- Above SMA(20): 74.2%
- Above SMA(50): 49.9%
- Above SMA(100): 47.2%
- Above SMA(200): 48.3%
These are important improvements from recent readings, especially when you compare them with the late-March lows. The market is no longer being carried by only a narrow group of stocks. Participation is gradually broadening across intermediate and longer trend measures.
The SMA(20) reading above 74% shows that the short-term rebound is real and well distributed. The bigger message, though, is in the 50-, 100-, and 200-day metrics. Those are still not strong enough to call the market fully healthy, but they are moving toward the 50% area, which is an important line between weak and improving participation.
3) New highs are improving
- New highs: 4.6%
- New lows: 1.8%
This is constructive, but it is not the kind of expansion you see in a fully mature, high-conviction uptrend. A healthier bull phase would typically show stronger new-high leadership.
So the market is recovering, but it is not yet showing a powerful expansion in leadership.
4) Weekly breadth remains strong
- Adv week: 78.4%
- Decl week: 20.6%
That is one of the strongest parts of the report. Weekly breadth remains excellent. The market has genuinely improved over the course of the week.
5) Monthly breadth is turning less negative
- Adv month: 53.6%
- Decl month: 45.7%
Another quiet improvement. The one-month picture is no longer leaning clearly bearish. It shows the recent recovery has started to repair some of the broader internal weakness.
6) The 3-month picture is still not healed
- Adv 3 month: 43.0%
- Decl 3 month: 56.1%
- Adv 25% 3 month: 9.0%
- Decl 25% 3 month: 14.3%
This is the key reason I am not ready to rate breadth as outright positive. The longer-horizon data still shows more underlying damage than strength.
That is why I would describe the current market as improving, but not fully restored.
How this compares with the previous session
Thursday did deliver another positive close. So the data confirmed the earlier interpretation.
But the character of the move changed a bit.
While yesterday looked like a classic breadth thrust day, today looked more like a pause-with-progress session:
- fewer advancers than Wednesday,
- much less upside expansion in the 4% movers,
- but continued improvement in moving-average participation,
- while indexes moved closer to resistance rather than decisively through it.
After a powerful internal reversal, it is normal for the next session to become more selective. The important thing is that the market did not give back the breadth improvement.
Final assessment
Thursday’s breadth data tells me the rebound is still alive and internally healthier than it was just a week ago. The more cautious part of the story is that this rebound is now running into the first real technical tests:
- SPY is nearing resistance,
- QQQ still has clear overhead supply,
- IWM is strong, but also approaching a key upper zone,
- and longer-term breadth is still playing catch-up.
So my conclusion is fairly straightforward: the market continues to improve, but it has not yet earned the benefit of full bullish conviction.
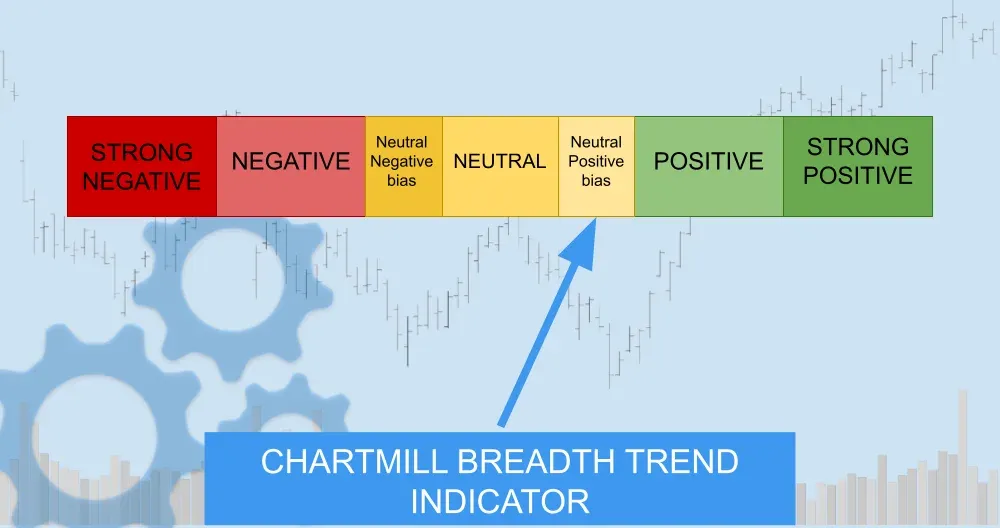
Market Breadth Trend Rating: 5/7 — neutral, with a positive bias
The market is no longer in the kind of internally weak state we saw in late March.
The next step now matters a lot. If the indexes can push through overhead resistance while breadth remains firm, this could evolve into something stronger.
ChartMill Market Desk
This daily Market Breadth Report is prepared by ChartMill for informational purposes only and does not constitute investment advice. Always do your own due diligence before making investment decisions.