Wednesday delivered exactly what breadth bulls wanted to see after Tuesday’s stabilization: follow-through.
Index Overview (SPY, QQQ, IWM)
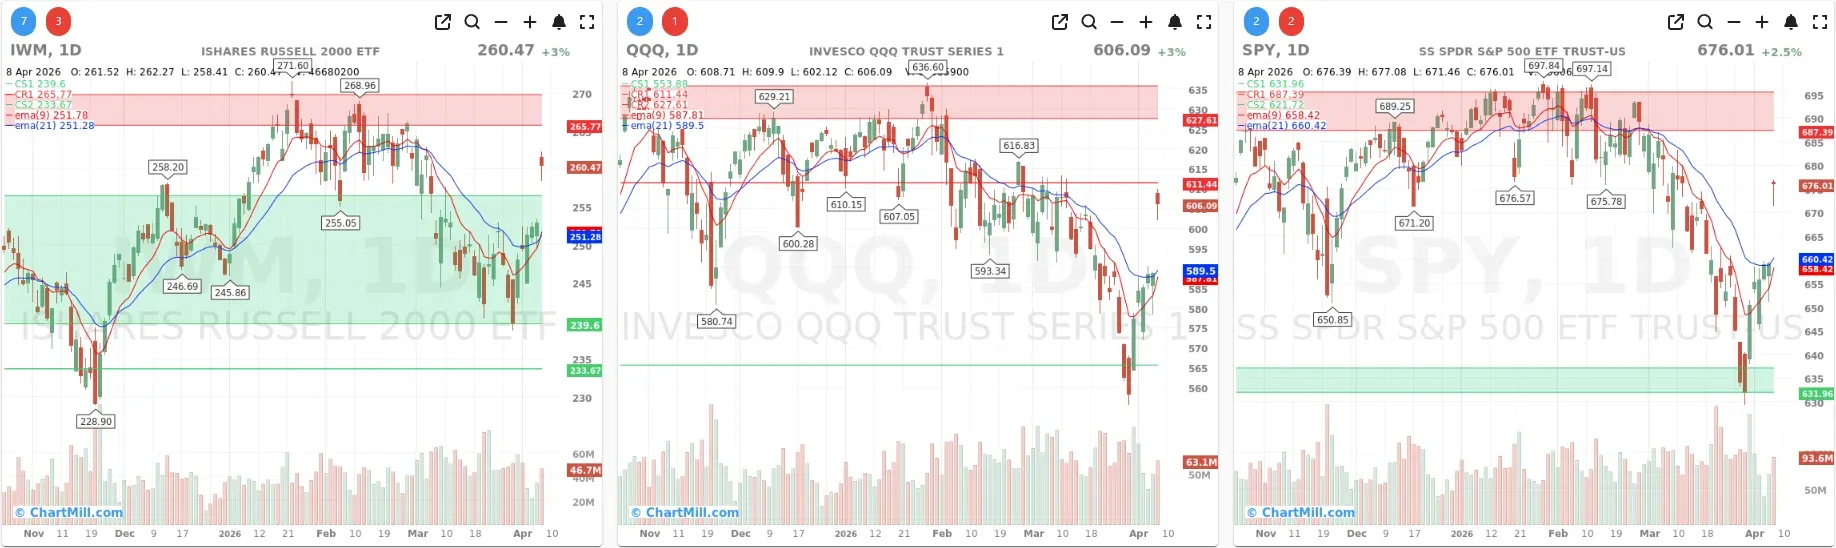
Short Term (Daily)
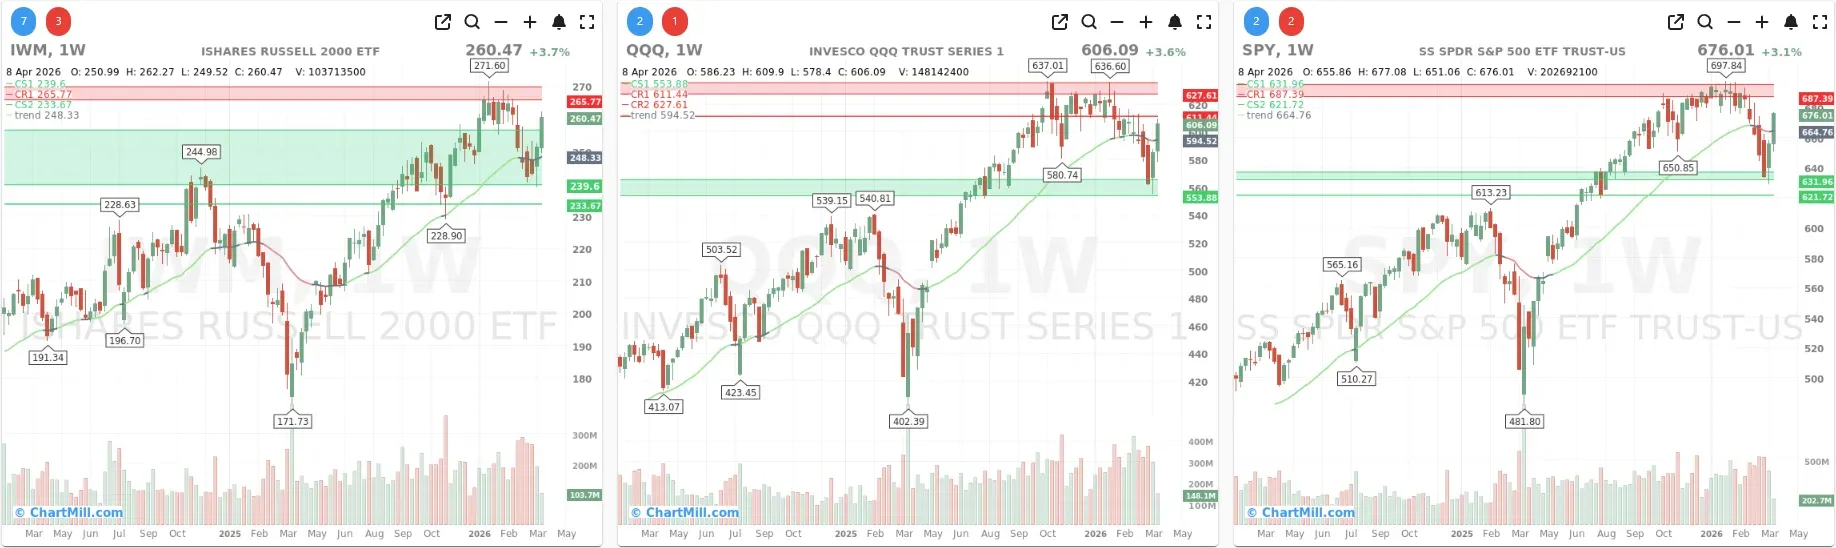
Long Term (Weekly)
SPY closed at $676.01 (+2.5%) and pushed back above both the EMA9 and EMA21 on the daily chart. At the same time, price remains below the first important overhead resistance near 687.39, which means this is a strong rebound, but not yet a full technical reset.
On the weekly chart, SPY recovered back above the long-term trend area around 664.76, which improves the bigger picture, though it still needs more distance from that level before the weekly structure starts to look comfortable again.
QQQ closed at $606.09 (+3.0%) and also reclaimed both short-term moving averages on the daily chart. However, QQQ is now running directly into nearby resistance around 611.44, with the larger resistance band still waiting near 627.61.
On the weekly chart, QQQ recovered back above the trend area around 594.52, which is constructive, but like SPY, it still looks more like recovery than renewed leadership.
IWM was the clear relative strength leader, closing at $260.47 (+3.0%) on the daily chart and +3.7% on the week. It is back above both daily moving averages and is now pressing toward the 265.77 resistance zone. Of the three major ETFs, IWM looks the strongest tactically.
On the weekly chart it remains well above its long-term trend line near 248.33, which makes the small-cap picture cleaner than what we currently see in SPY and QQQ.
The main takeaway from the index charts is simple: all three major ETFs participated, all three reclaimed important short-term levels, and IWM showed the strongest rebound character. That is better than a narrow bounce led only by mega caps.
What the Breadth Data Says

Wednesday’s numbers were strong enough to qualify as a genuine breadth expansion day.
Daily advancers came in at 80.7%, versus just 17.4% decliners. That is a powerful upside skew. Even more impressive, 16.4% of stocks gained more than 4% on the day, while only 3.3% fell more than 4%. This was a forceful upside participation day.
The moving-average data improved sharply as well:
- SMA(20)+: 74.3% versus 57.1% on April 7
- SMA(50)+: 46.8% versus 28.5%
- SMA(100)+: 45.1% versus 35.9%
- SMA(200)+: 47.2% versus 41.1%
This is the most important part of the report.
Short-term breadth is now clearly strong again, and medium-term breadth improved dramatically in one session. The jump in the 50-day figure from 28.5% to 46.8% is especially notable. That tells you the rebound is reaching deeper into the stock list, not just lifting a few index-heavy names.
At the same time, the same data also tells us what has not yet been fixed. The 50-day, 100-day, and 200-day readings are still all below 50%. So while the rebound is real, the market is still climbing out of internal damage created during the prior selloff.
New highs and new lows also improved in the right direction. New highs rose to 3.8% from 1.7%, while new lows fell to 0.6% from 1.2%. That is a healthy directional shift. The market is moving away from internal stress and back toward expansion.
The same pattern shows up in the multi-week and multi-month data:
- Adv Week: 79.4%
- Adv Month: 49.1%
- Decl Month: 50.3%
- Adv 3 Month: 41.9%
- Decl 3 Month: 57.4%
The weekly data is strong. The monthly data is basically back to balance. The three-month data still reflects prior weakness.
News context behind the move
The breadth surge fits well with the session’s broader market backdrop. Wednesday’s rally was driven by a clear risk-on shift after reports of a US-Iran ceasefire helped trigger a collapse in oil prices, a powerful move into cyclicals, and a major improvement in sentiment.
The Dow had its best day in a year, WTI fell 16.4% to $94.41, Brent dropped 13.3% to $94.75, and year-end Fed cut probability jumped from 14.1% to 44%.
It explains why the rebound was so broad. Lower oil, lower yields, and a strong rotation into risk typically create exactly the sort of breadth thrust we saw in the numbers. At the same time, the same news report also stressed that the ceasefire already looked fragile, which means some of Wednesday’s strength likely reflected relief and positioning unwind rather than durable conviction.
So the data says the rally was real. The news context says it may still be fragile.
Breadth trend rating
Rating: 5/7 — neutral to positive bias
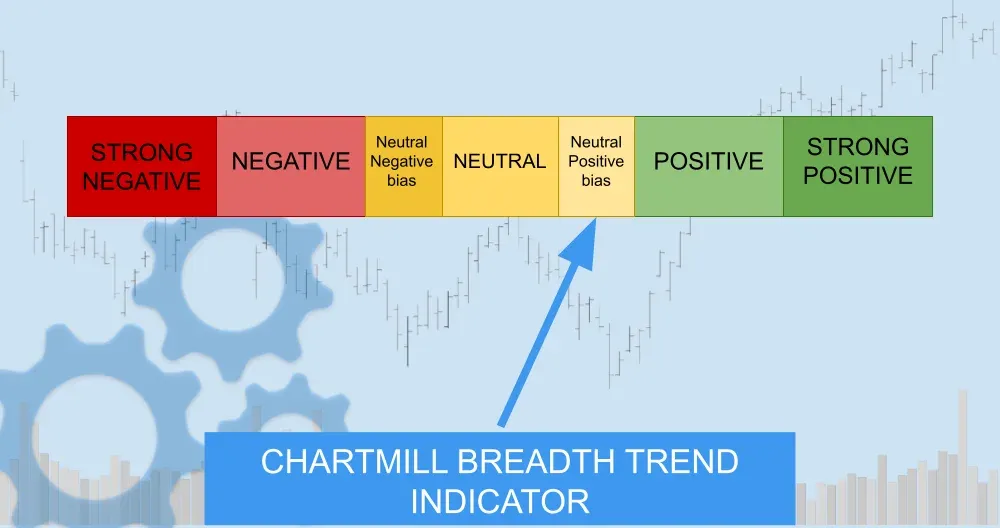
That is an upgrade from the prior tone.
The reason it is not a 6 is that longer-term breadth remains mixed. Less than half the market is above the 50-day, 100-day, and 200-day moving averages, and the three-month breadth data still reflects more damage than strength.
The reason it is no longer a 4 is that Wednesday’s internal thrust was simply too strong to ignore. The market now has real participation behind the rebound.
Conclusion
SPY, QQQ, and IWM all strengthened, all reclaimed key short-term levels, and all participated in the rebound. IWM remains the strongest of the three on a tactical basis. Under the surface, the breadth numbers improved sharply enough to confirm that this move is broader and healthier than a simple mega-cap bounce.
That leaves the current setup constructive, but still slightly fragile. The bulls clearly won the day. The next question is whether they can now convert a strong breadth thrust into a durable trend.
ChartMill Market Desk
This daily Market Breadth Report is prepared by ChartMill for informational purposes only and does not constitute investment advice. Always do your own due diligence before making investment decisions.
Next to read: Ceasefire Ignites Wall Street's Best Day in a Year: Oil Craters, Cyclicals Surge, and the Iran Clock Is Still Ticking