Monday’s powerful rebound was not undone on April 7, but it was not meaningfully expanded either. Short-term breadth continued to improve under the surface, while the major indexes mostly paused near key resistance and longer-term participation remained too weak to call this a fully healthy market.
Index Overview (SPY, QQQ, IWM)
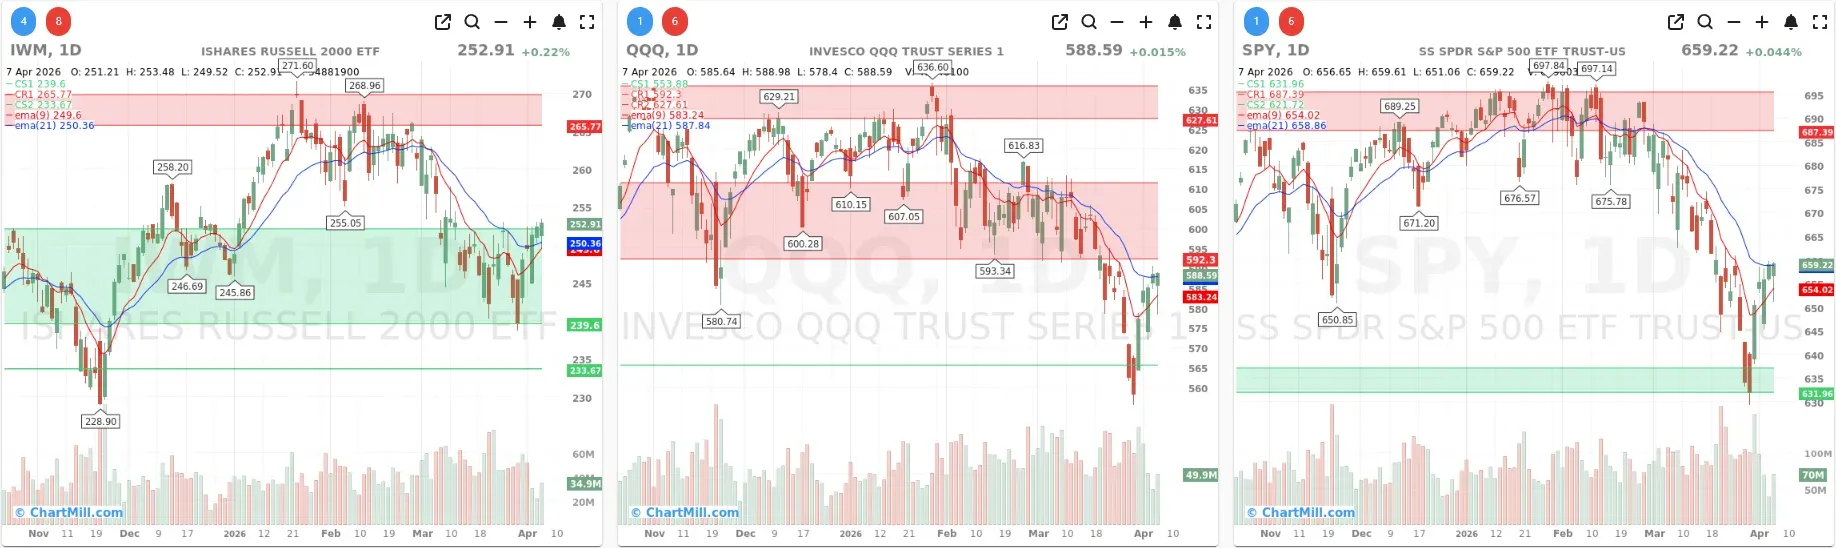
Short Term (Daily)
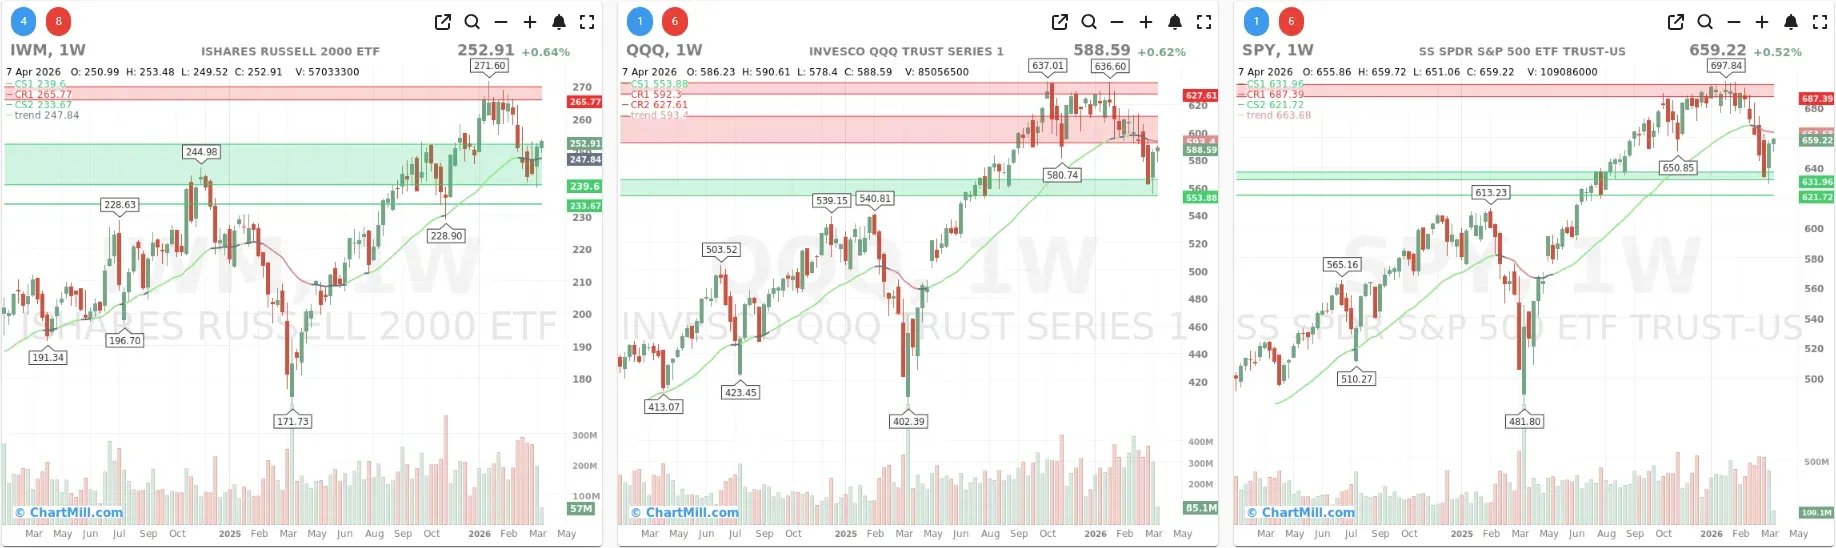
Long Term (Weekly)
SPY closed at $659.22, essentially flat on the day, but the daily chart still managed to hold onto the short-term recovery. Price remains back above both the EMA9 (654.02) and EMA21 (658.86), which keeps the rebound alive for now. That said, the ETF is still trading well below the heavy overhead resistance zone near 687.39.
On the weekly chart, SPY is trying to stabilize after the sharp breakdown, but the bigger picture remains cautious. Price recovered from the green support zone around 631.96, yet it is still below the ChartMill Trend Indicator (663.68), which remains red.
QQQ finished at $588.59, also basically flat, and the daily chart shows a similar setup to SPY. Price reclaimed both the EMA9 (583.24) and EMA21 (587.84) and held that recovery. That is constructive. But just like SPY, QQQ is now pushing into an area where supply can show up quickly, with nearby resistance around 592.3-595 and much heavier overhead resistance still sitting near 627.61.
The weekly chart remains the weak point. QQQ bounced from the support area around 553.88, but price is still below the ChartMill Trend Indicator (593.4) and that indicator remains red. So the Nasdaq has stopped the immediate bleeding, but the longer-term trend has not yet turned.
IWM continues to be the most constructive of the three. It closed at $252.91 and remains above both the EMA9 (249.6) and EMA21 (250.36) on the daily chart. More importantly, unlike SPY and QQQ, IWM already looks more stable on the weekly timeframe as well.
On the weekly chart, IWM is above the ChartMill Trend Indicator (247.84), which is grey (neutral), and it is holding above the key support band around 239.6-233.67. There is still overhead resistance near 265.77, so small caps are not out of the woods, but relative to SPY and QQQ, IWM is clearly the strongest structure right now.
What the Breadth Data Says

After Monday’s broad upside surge, Tuesday’s breadth data reads like a market catching its breath rather than immediately rolling over.
Daily breadth softened:
- Advancers: 47.6%
- Decliners: 49.1%
- Advancing 4%+: 2.3%
- Declining 4%+: 3.3%
That is a step down from April 6, when advancers clearly led decliners. So the strong thrust from Monday did not receive a second major expansion day. Still, the deterioration was modest, not dramatic.
The more encouraging part is visible in the short-term participation metrics:
- Stocks above SMA(20): 57.1%, up from 55.3%
- Stocks above SMA(50): 28.5%, up from 28.1%
- Stocks above SMA(100): 35.9%, unchanged
- Stocks above SMA(200): 41.1%, slightly down from 41.3%
The rebound is continuing to pull more stocks back above their short-term trend lines, but it has not yet materially repaired the intermediate- and long-term damage. A market can bounce hard with weak 50-day and 200-day participation, but it usually cannot sustain a durable new uptrend unless those broader participation numbers start to improve much more meaningfully.
The new high/new low data also reflects a market that is stabilizing rather than fully healthy:
- New highs: 1.7%
- New lows: 1.2%
That is not bad, and it is certainly better than the more stressed readings seen during the March deterioration, but it is still far from the kind of leadership expansion you normally see in a strong bull leg. A healthy market tends to produce a much more convincing new-high list.
One of the more notable positives remains the weekly breadth thrust:
- Advancing week: 80.9%
- Declining week: 18.2%
That is still a strong reading, even if it slipped slightly from Monday. It supports the idea that last week’s selling climax likely triggered a meaningful short-term reversal. But when you place that next to the weaker longer-horizon numbers, the message stays balanced rather than outright bullish:
- Advancing month: 32.7%
- Declining month: 66.7%
- Advancing 3 months: 35.3%
- Declining 3 months: 64.0%
Those figures remain poor. They remind us that the market is coming from a position of weakness. The rebound may be real, but it is still taking place inside a backdrop where most stocks have been under pressure over the last one to three months.
The Pocket Pivot reading rose to 10.6% from 9.0%, which also fits with the idea that short-term momentum is improving beneath the surface. But again, this is early-stage repair, not full confirmation.
What Changed Versus the Previous Trading Day?
Compared with April 6, the key difference is this: Monday was a thrust day, Tuesday was a holding day.
Monday’s article already suggested that the rebound needed confirmation through follow-through and better participation. Tuesday did not deliver another explosive breadth expansion, but it also did not erase Monday’s progress. In fact, SMA(20)+ improved again, and SMA(50)+ edged higher, which means the market is still quietly pulling more stocks back into short- and medium-term upswings.
So the pattern is not one of immediate failure. It is more a case of a market pausing after a sharp snapback while trying to build a base.
The most important limitation is unchanged from the previous analysis: the longer-term participation data is still too weak, and SPY and QQQ remain in red long-term weekly trends. That keeps the burden of proof on the bulls.
News and Market Context
The news backdrop helps explain why Tuesday’s breadth was mixed rather than outright strong.
According to the Market News Update, markets spent much of the session under pressure as investors focused on the US-Iran deadline and the risk of further disruption around the Strait of Hormuz, with oil spiking intraday and sentiment staying tense. Only later in the session did buyers recover much of the ground, and the actual two-week ceasefire agreement came after the close.
The breadth figures for April 7 reflect a market that was still trading in a climate of geopolitical stress, even if some late-session recovery already appeared. The much stronger relief reaction tied to the ceasefire and collapsing oil belongs to the next session, not to this breadth snapshot. The same is true for the idea that Wednesday could open very differently, with futures sharply higher and oil falling hard; that was post-close information and should not be retrofitted onto Tuesday’s internals.
There were also stock-specific pockets of support during Tuesday’s session. Broadcom’s AI announcements and a sharp rally in healthcare insurers helped parts of the market hold up better than the index-level closing numbers might suggest. That may have helped prevent a worse breadth close, but it still did not produce the kind of broad participation surge that would have turned Tuesday into a second outright confirmation day.
Final Take
April 7 did not invalidate the rebound. That is the main message.
The major indexes mostly held their daily recoveries above the short-term moving averages. IWM remains the clear relative-strength leader and is the only one of the three major ETFs with a constructive weekly trend backdrop. Beneath the surface, short-term breadth kept improving, especially in the SMA(20)+ and SMA(50)+ data.
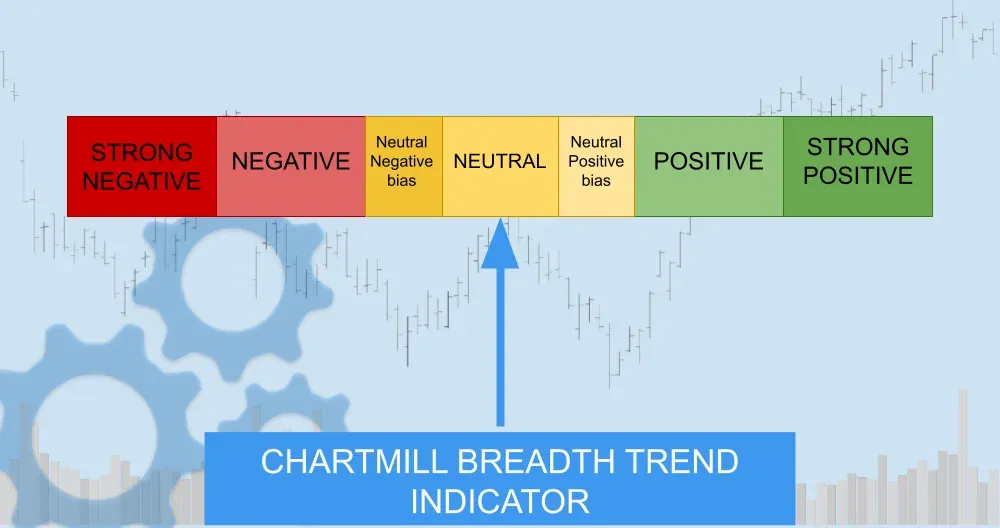
Rating: 4/7 — Neutral
So the tone is better than it was a week ago, and better than it was before Monday’s thrust. But this is still a market in repair mode.
ChartMill Market Desk
This daily Market Breadth Report is prepared by ChartMill for informational purposes only and does not constitute investment advice. Always do your own due diligence before making investment decisions.
Next to read: Ceasefire, Collapsing Oil, and a Chipmaker on Fire, Wall Street Wednesday Opens on a Different Planet