
Participation remains historically weak, trend participation keeps slipping, and all three key index ETFs are still trading below their short-term moving averages while their weekly long-term trend backdrop remains under pressure.
Index Overview (SPY, QQQ, IWM)
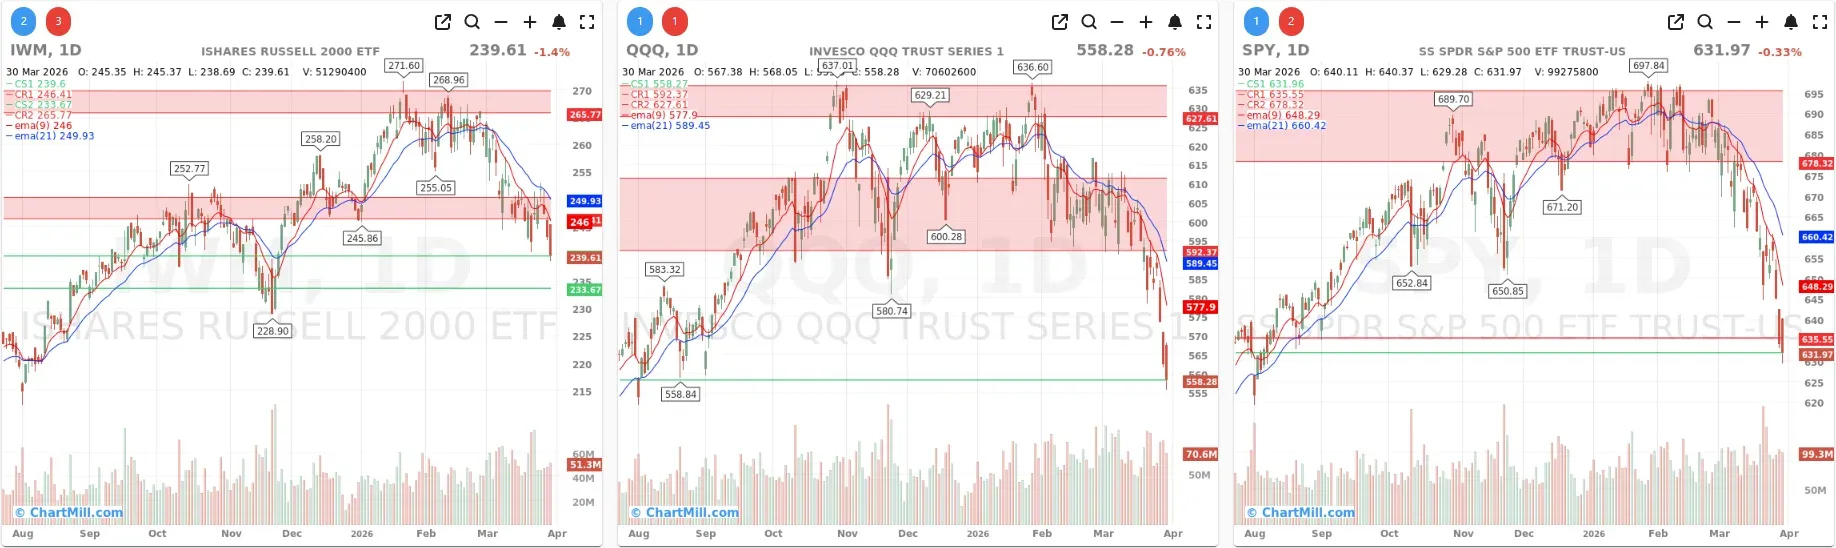
Short Term (Daily)
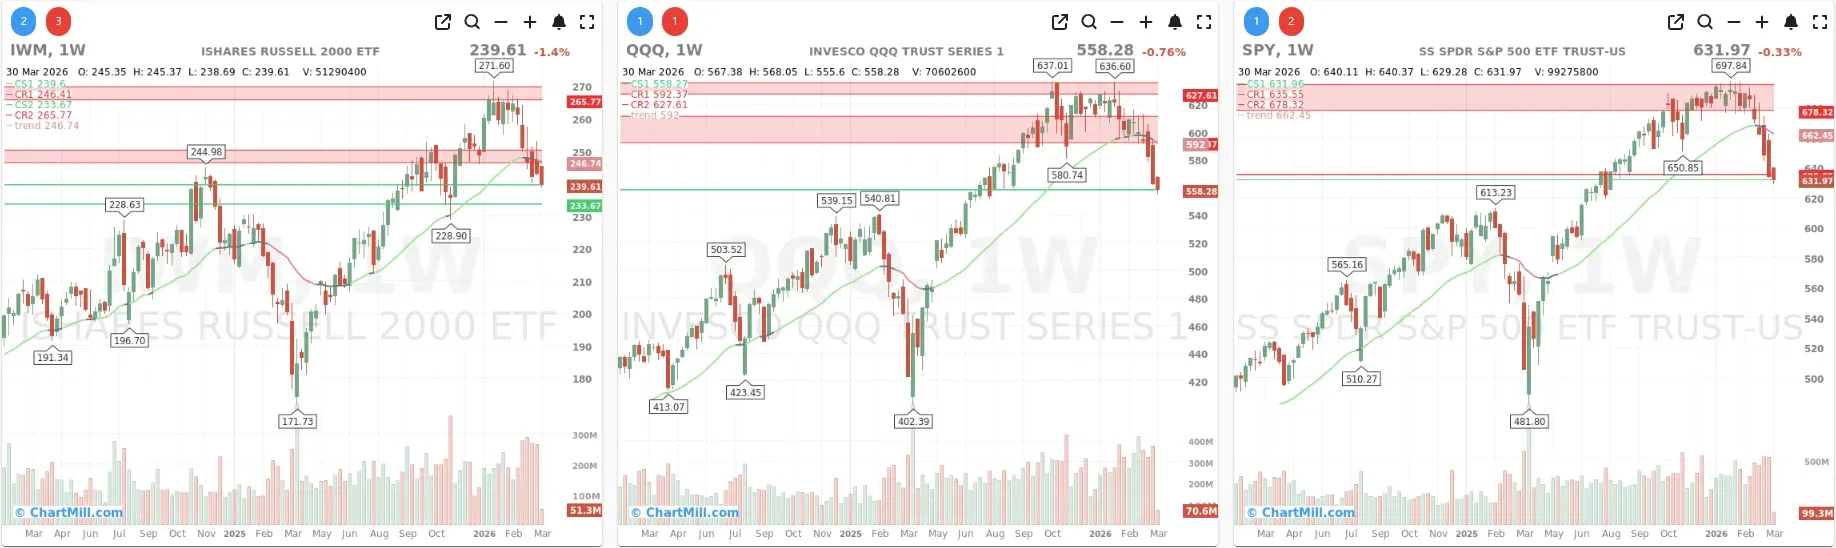
Long Term (Weekly)
SPY closed at $631.97, ▼0.33%, and although the decline was modest compared with Friday’s selloff, the bigger picture did not improve. On the daily chart, price remains well below both the EMA9 (648.29) and EMA21 (660.42). That keeps the short-term trend clearly negative.
More importantly, SPY is now trading decisively beneath the lower support zone around 635-640, while the next major resistance area remains far above, starting near 678.32. That gap between price and resistance shows how much technical damage still needs to be repaired before a more constructive view becomes justified.
On the weekly chart, the ChartMill Trend Indicator remains red, just as already noted in the previous update. Monday therefore did not introduce a new warning, but it did reinforce the existing one. Price is trading below the long-term trend line, which means the market is not just weak short term, but is also losing structural support on a higher timeframe.
QQQ closed at $558.28, ▼0.76%, and remains the weakest of the large-cap benchmarks from a technical perspective. The ETF is trading well below both the EMA9 (577.9) and EMA21 (589.45), confirming that short-term momentum is still firmly to the downside.
Friday’s breakdown was severe, and Monday did little to reverse that message. QQQ is sitting near an important support zone in the 558-559 area, but there was no convincing rebound from that level. Resistance starts near 592.37, then rises toward the heavier overhead zone near 627.61. That leaves the Nasdaq with a lot of overhead supply.
On the weekly chart, the ChartMill Trend Indicator turned red again as well. Last week ended up closing flat after all, because the high of the weekly candle was higher than the Chartmill trend indicator. But for that to happen again this week, there would have to be a phenomenal rally. Either way, the Nasdaq remains in a damaged technical state with no clear evidence yet of internal recovery.
IWM closed at $239.61, ▼1.4%, making it the weakest of the three major ETFs on the day. That underperformance is important because small caps often act as a useful gauge of underlying risk appetite. Right now, they are not showing much.
Like SPY and QQQ, IWM remains below both the EMA9 (246) and EMA21 (249.93). Price is hovering just above a nearby support zone, but the chart still looks heavy. If that support fails, the next area to watch comes in closer to 233.67. Overhead resistance begins near 246.11, followed by the stronger band around 265.77.
The weekly chart also shows a red ChartMill Trend Indicator, meaning all three of the main benchmark ETFs are now aligned in a technically weak higher-timeframe condition. That is a meaningful deterioration versus the more mixed backdrop seen earlier this month.
Breadth Analysis
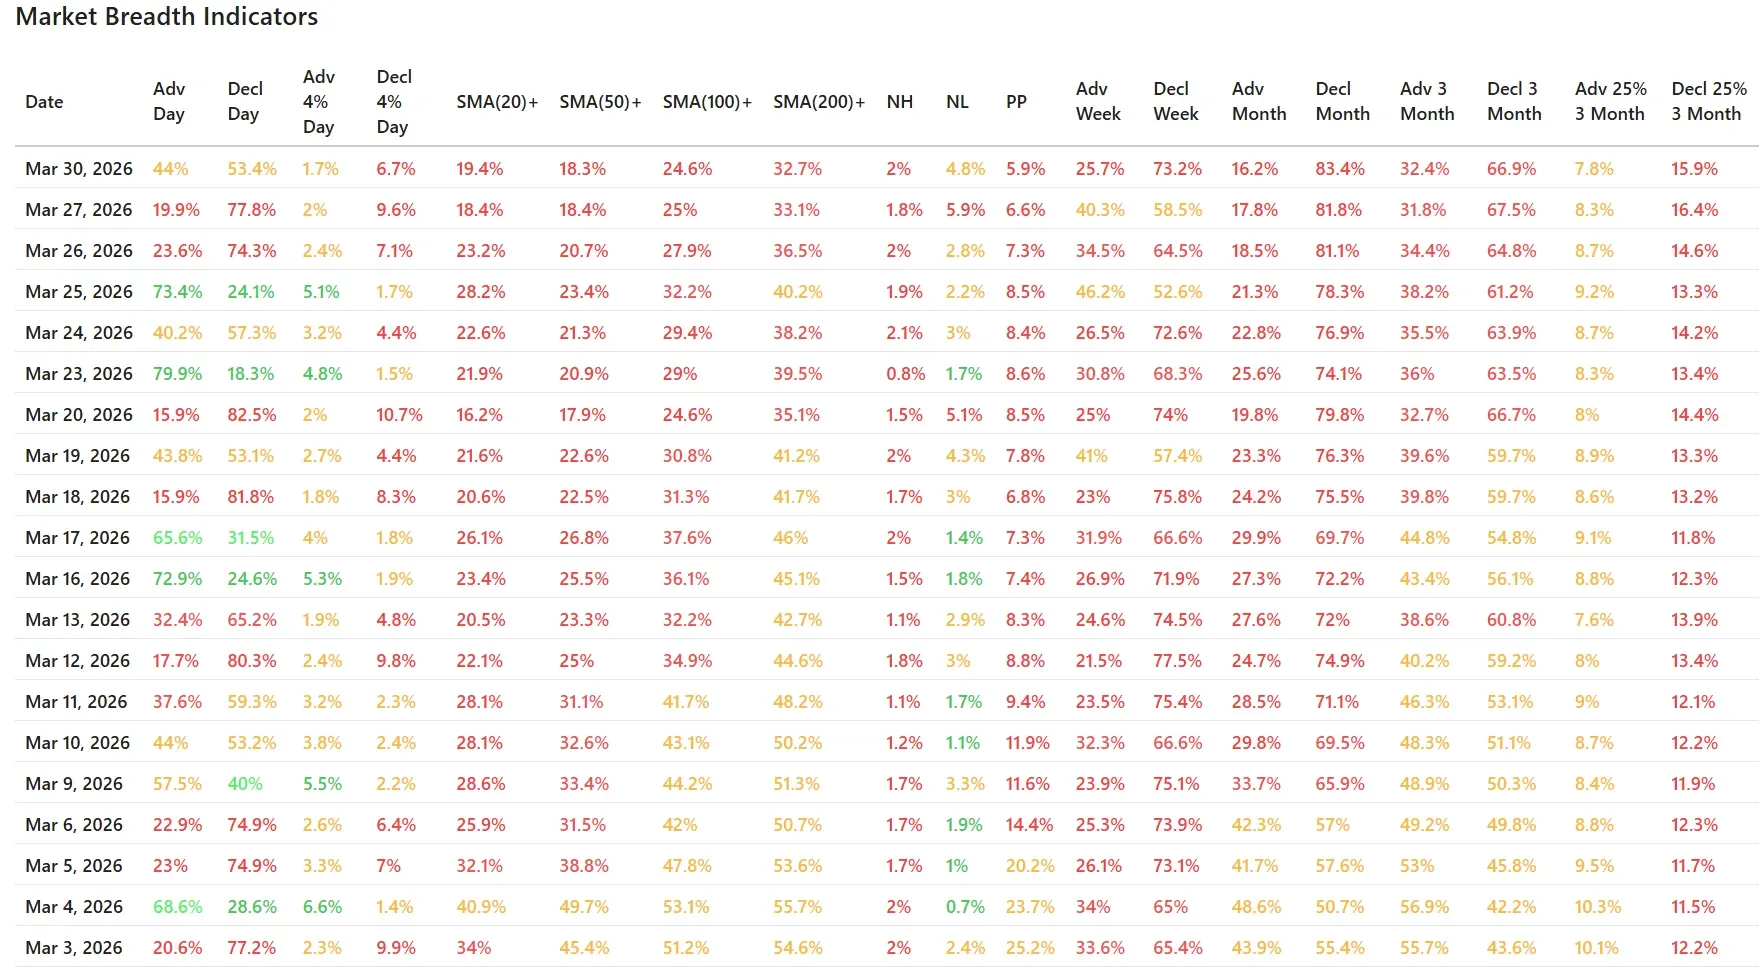
At first glance, Monday’s breadth numbers looked less dramatic than Friday’s near-collapse. Advancers came in at 44% versus 53.4% decliners, which is still negative, but clearly less one-sided than Friday’s 19.9% advancers versus 77.8% decliners.
However, that improvement needs to be interpreted carefully.
This was not a true recovery day. It was more a case of selling pressure becoming less extreme, while the underlying participation data remained very weak. That distinction matters.
The most telling numbers continue to be the trend participation metrics:
- SMA(20)+: 19.4%
- SMA(50)+: 18.3%
- SMA(100)+: 24.6%
- SMA(200)+: 32.7%
These are still deeply depressed levels. Compared with Friday, the very short-term SMA(20)+ improved only slightly from 18.4% to 19.4%, but SMA(50)+ slipped, SMA(100)+ declined, and SMA(200)+ also edged lower. So even though the daily advance-decline line looked less terrible, the broader trend participation picture continued to weaken.
The same message appears in the longer-horizon breadth data:
- Advancing stocks for the week: 25.7%
- Declining stocks for the week: 73.2%
- Advancing stocks for the month: 16.2%
- Declining stocks for the month: 83.4%
Those weekly and monthly figures are exceptionally poor. In fact, they worsened further from Friday’s already weak readings. That tells us the market is still broadening to the downside, not stabilizing.
The new highs/new lows data also remains unsupportive:
- New Highs: 2%
- New Lows: 4.8%
That was a slight improvement from Friday’s very weak 1.8% new highs and 5.9% new lows, but the relationship is still unhealthy. New lows continue to outnumber new highs by a wide margin, which is not what you want to see in a market trying to build a durable low.
Reading Monday in Context
Compared with the previous breadth article, Monday largely confirmed the same conclusion rather than changing it.
Friday suggested the market was under severe internal stress. Monday did not invalidate that view. Instead, it showed that after a washout session, the market can post a less extreme breadth day without actually becoming healthier.
That is the main takeaway.
Last week already featured a brief rebound attempt, especially on March 25, when breadth surged to 73.4% advancers. But that bounce failed almost immediately, and the following sessions reversed the improvement. Monday now fits into that same pattern: less panic, yes, but still no evidence of real accumulation.
This is what weak markets often do. They produce short-lived pauses in the selling, but the broader participation data keeps deteriorating underneath the surface.
What the Data Suggests Now
The market is currently showing the characteristics of a negative breadth regime:
- short-term trends are down,
- intermediate participation is weak,
- long-term participation is slipping,
- new lows still dominate new highs,
and all three major benchmark ETFs are under pressure on both the daily and weekly timeframes.
That does not mean a tradable bounce cannot occur. In fact, after several deeply negative sessions, a short-term rebound would not be surprising. But based on the current data, any bounce would still need to prove itself. Right now, the internals do not support the idea that a durable bottom has already formed.
For that view to change, we would need to see more than just a less-bad day.
- clear upside breadth expansion,
- a meaningful rise in stocks reclaiming key moving averages,
- new highs improving materially,
- and the major indices starting to recover their short-term trend levels.
None of that is visible yet.
Final Takeaway
Monday’s session was not as ugly as Friday on the surface, but the internal message remained largely the same: the market is still weak, and the damage is still spreading across multiple timeframes.
The panic slowed, but the repair did not start.
Breadth Trend Rating: 2/7 – Negative
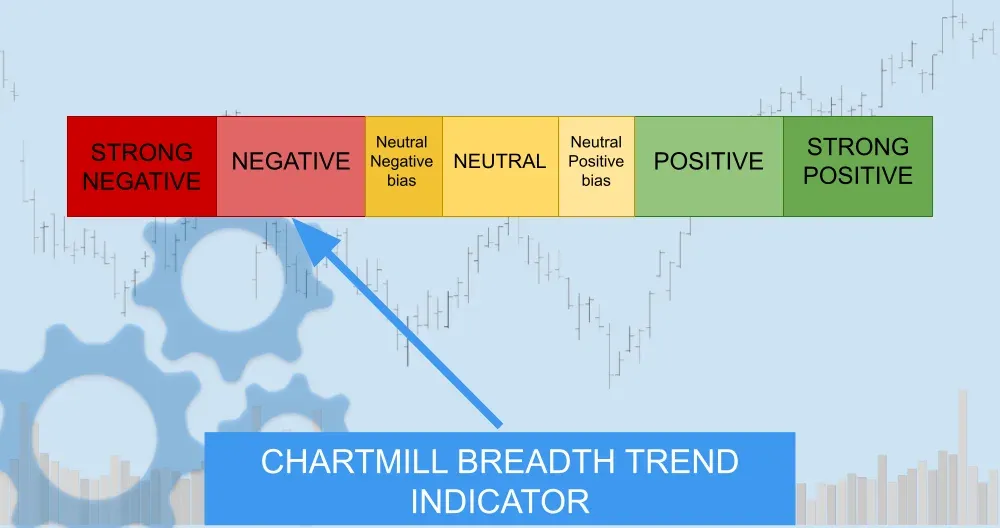
That keeps the current breadth trend firmly in negative territory.
ChartMill Market Desk
This daily Market Breadth Report is prepared by ChartMill for informational purposes only and does not constitute investment advice. Always do your own due diligence before making investment decisions.
Next to read: Chips Down, Ackman Up: How Iran, the Fed, and a Viral Post Defined Monday's Market