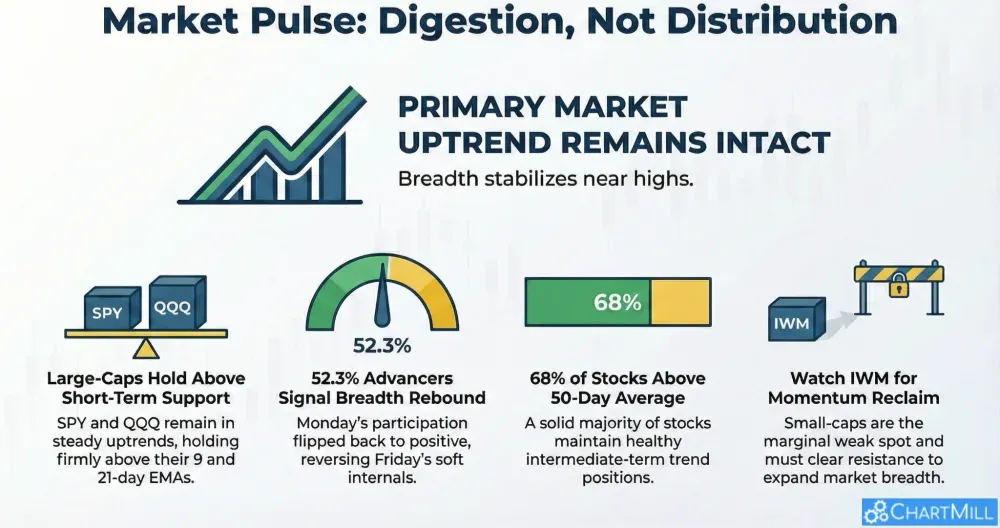
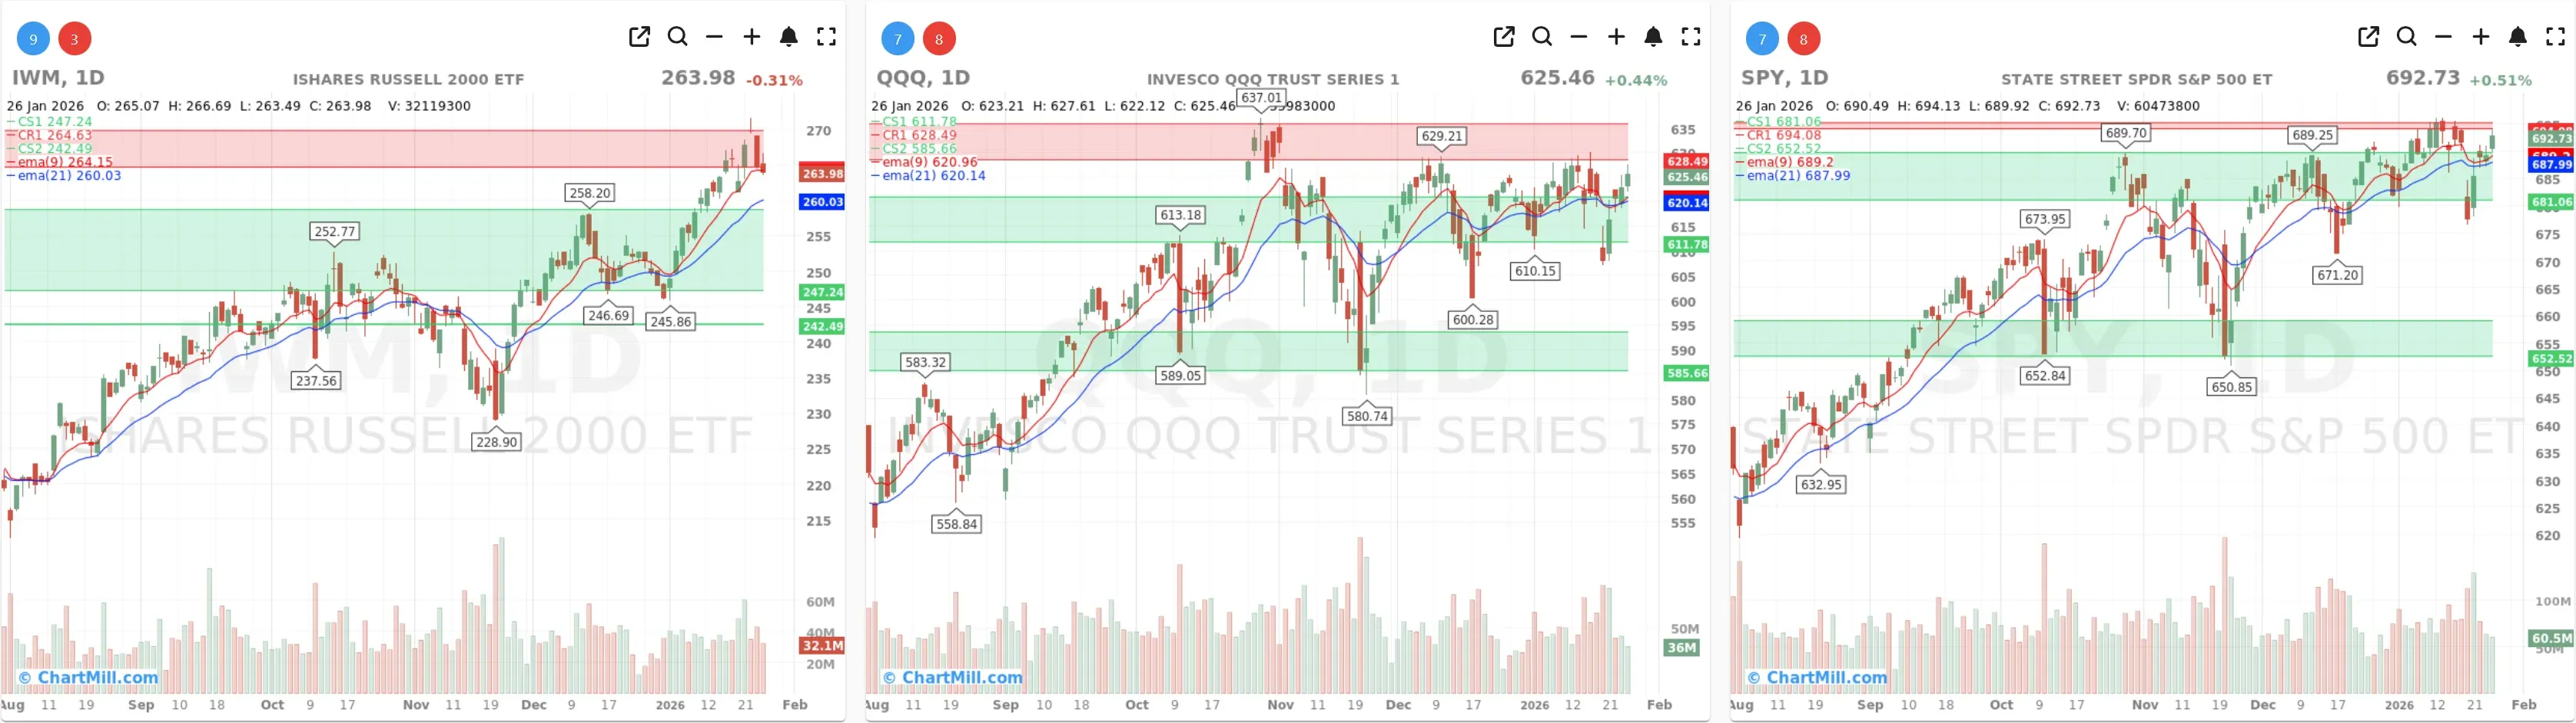
Monday delivered a constructive breadth bounce after Friday’s softer internals, with advancers regaining the upper hand and weekly breadth flipping back into a slight positive. Large-caps (SPY) and tech (QQQ) held firm near highs, but small-caps (IWM) slipped below the short-term average right under resistance, keeping the “risk-on” message a bit mixed.
Index overview (SPY, QQQ, IWM)
Short Term (Daily)
Long Term (Weekly)
SPY - steady uptrend, holding above short-term support
Daily: SPY finished higher and remains above EMA9 and EMA21, which is typically what you want to see in a healthy uptrend. Price is still acting well despite some recent choppiness, buyers continue to defend pullbacks before they turn into real damage.
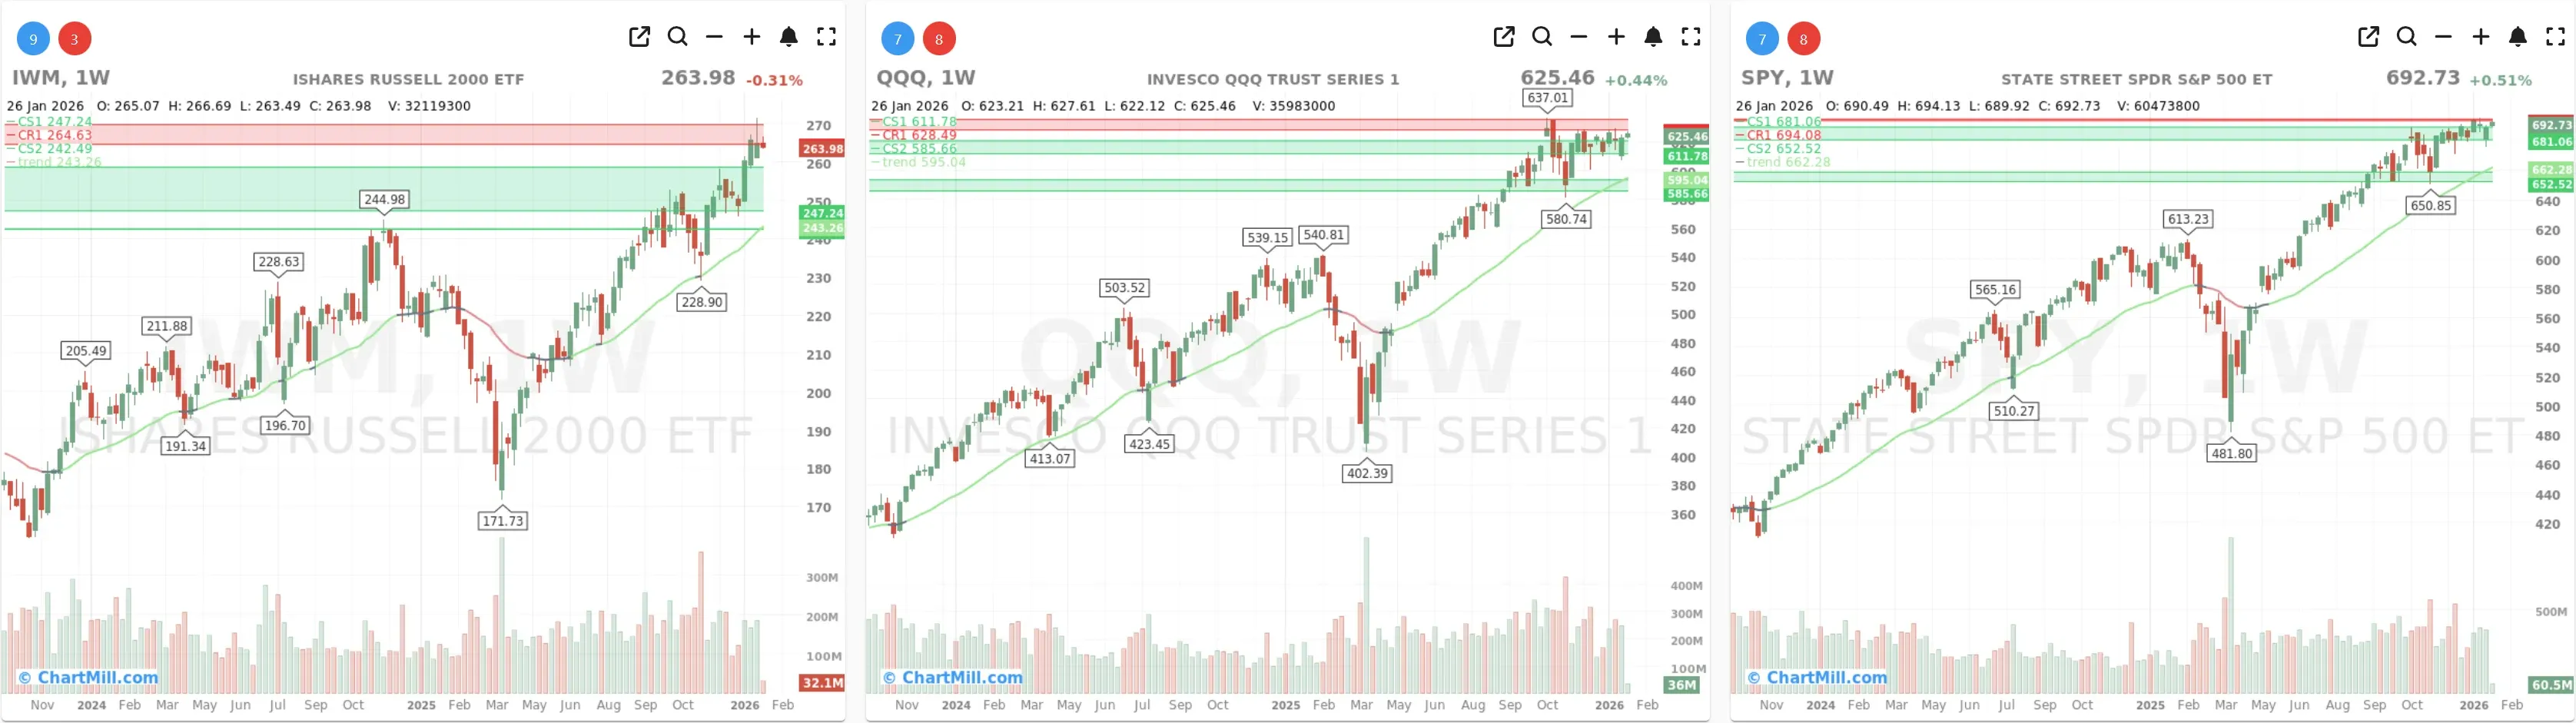
Weekly: The longer-term picture stays clearly constructive: the 30-week trend is green, and SPY continues to trade comfortably above its rising long-term average. In other words: the primary trend remains intact.
Takeaway: SPY is behaving like a market that’s consolidating near highs rather than distributing.
QQQ - strong structure, but overhead supply nearby
Daily: QQQ also closed up and is above EMA9/EMA21, keeping the short-term trend pointed higher. That said, price is still operating just beneath a nearby resistance band (recent prior peaks), which often brings more two-way trade.
Weekly: The weekly trend remains green and price is well above the long-term trend line, consistent with leadership from growth/tech.
Takeaway: QQQ remains a key leader, but it’s pushing into an area where breakouts can stall unless breadth expands.
IWM - short-term momentum cools under resistance
Daily: IWM slipped modestly and closed just below EMA9, while still above EMA21. That’s a classic “cooling off” look after a strong run, especially happening right under a clear resistance zone (recent highs).
Weekly: The weekly trend is still supportive (green) and price remains above the 30-week average, so the bigger picture hasn’t broken, this is more “pause” than “problem,” for now.
Takeaway: Small-caps are the marginal weak spot. If they can’t reclaim the short-term average quickly, breadth improvements may stay capped.
Market breadth dashboard (10-day view)
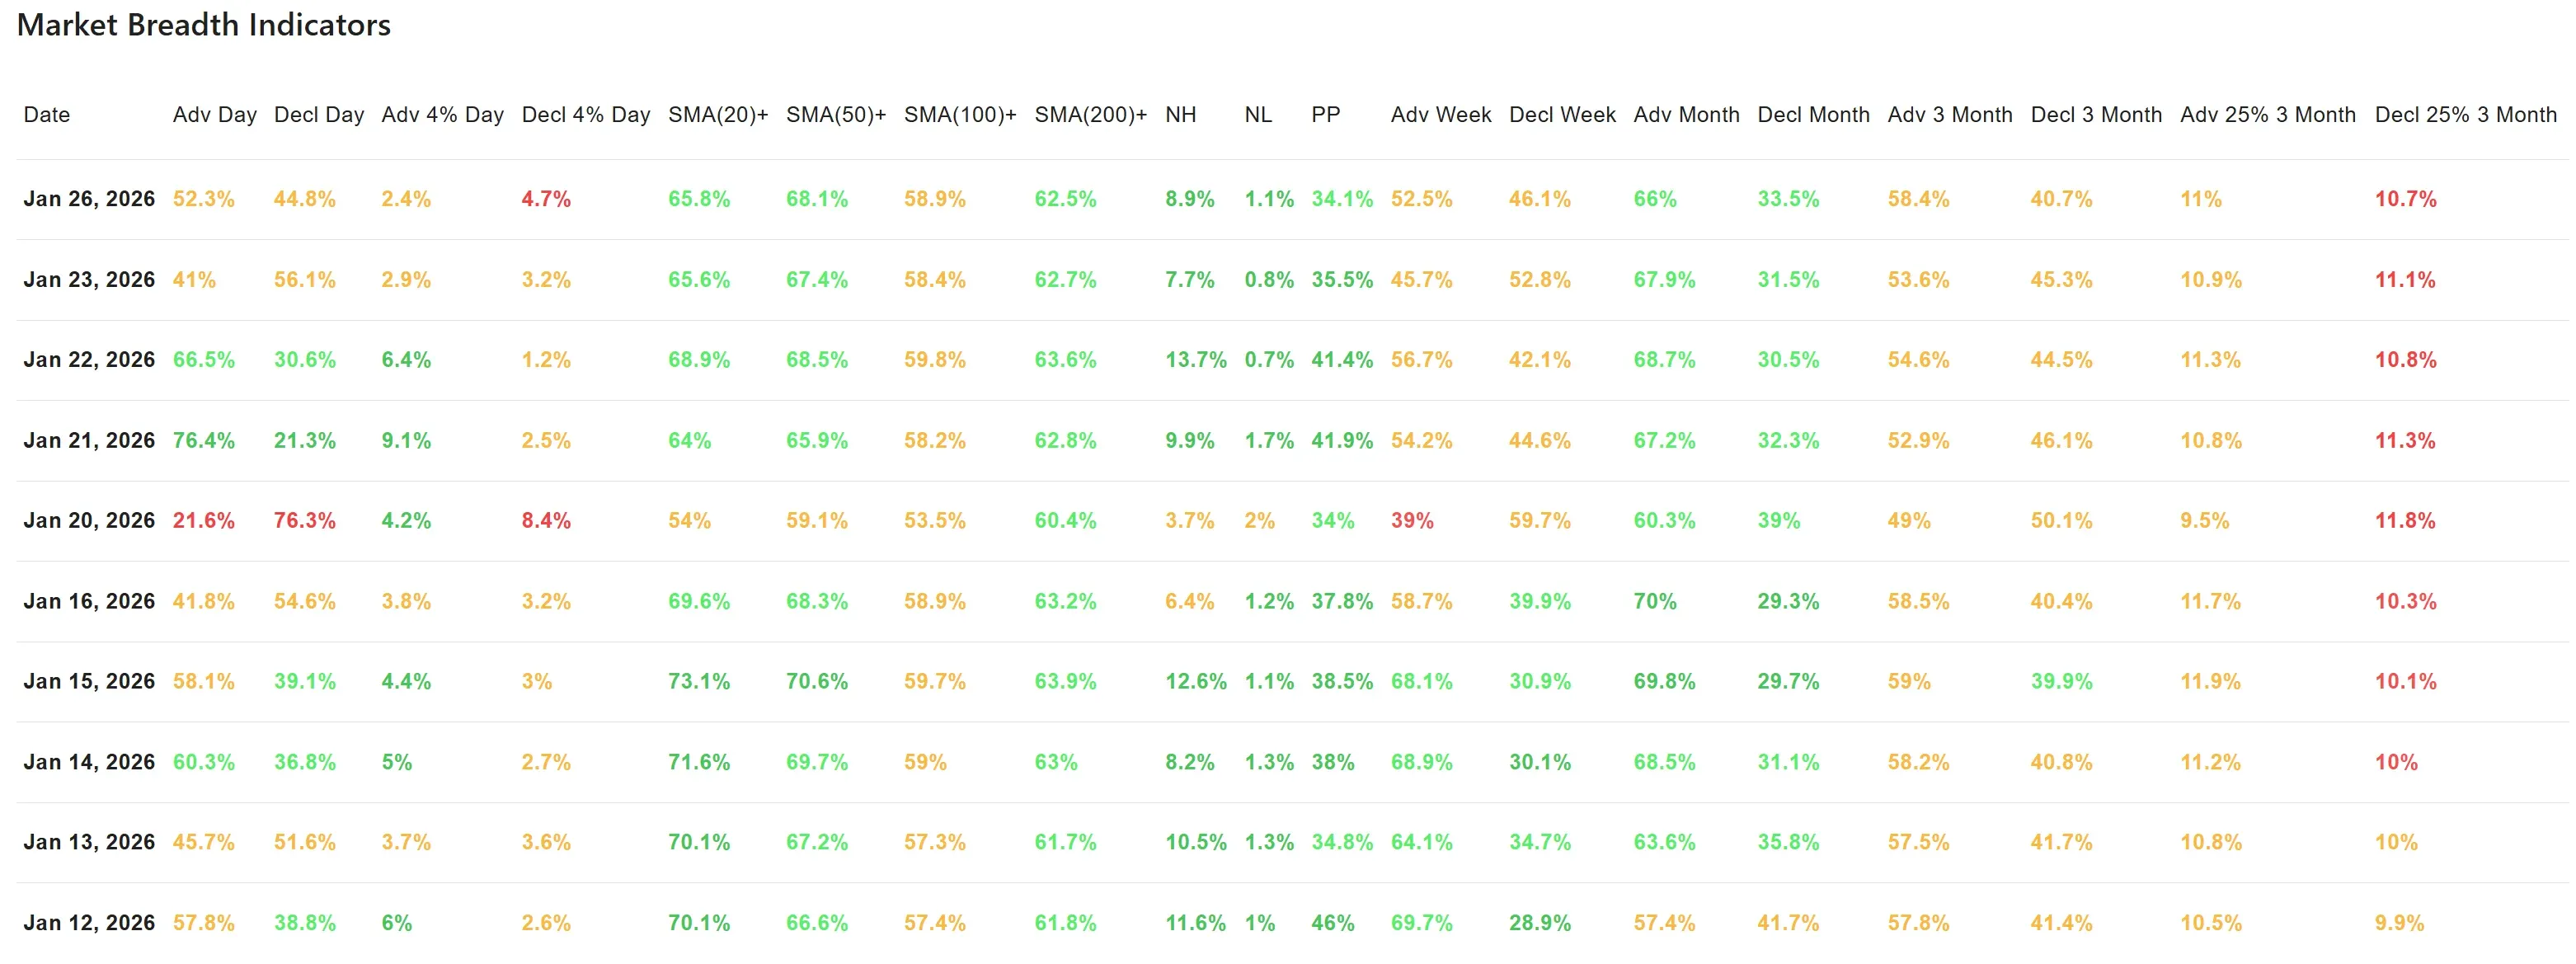
Daily participation improved vs Friday
Monday’s internals strengthened notably compared with the prior trading day:
-
Advancers: 52.3% (up from 41.0% Friday)
-
Decliners: 44.8% (down from 56.1% Friday)
That’s a meaningful shift back toward balance/positive participation, consistent with SPY/QQQ finishing green.
But: the downside intensity still outweighs upside intensity:
-
Advancing >4%: 2.4%
-
Declining >4%: 4.7%
So while “more stocks rose than fell,” the tail risk is still present, losses are clustering in a smaller subset of names.
Trend health remains solid (especially short/intermediate term)
The “stocks above key moving averages” readings remain supportive:
-
Above SMA(20): 65.8%
-
Above SMA(50): 68.1%
-
Above SMA(100): 58.9%
-
Above SMA(200): 62.5%
This is an important context point: even with some day-to-day chop, the market still has a majority of stocks in acceptable trend positions, especially on the 20/50-day measures. That usually aligns with “pullbacks are buyable” rather than “sell everything.”
New highs cooled, but new lows stayed contained
-
New Highs (NH): 8.9% (higher than Friday’s 7.7%, but well below Thursday’s 13.7%)
-
New Lows (NL): 1.1% (still low)
This is a “good-not-great” combo:
-
Low NL argues against broad-based breakdown.
- Moderate NH suggests we’re not in a strong expansion phase right now, more like digesting gains near highs.
Weekly breadth flipped back positive (a key reversal from Friday)
-
Adv Week: 52.5% (up from 45.7% Friday)
-
Decl Week: 46.1% (down from 52.8% Friday)
That’s a clean improvement and lines up with the index picture: the market absorbed Friday’s softer breadth and stabilized.
The bigger “drift” still leans positive
-
Adv Month: 66.0% vs Decl Month: 33.5%
-
Adv 3 Month: 58.4% vs Decl 3 Month: 40.7%
-
Big-move balance over 3 months is near even: Adv 25%: 11.0% vs Decl 25%: 10.7%
So the intermediate backdrop remains constructive, but not euphoric, more “trend is up” than “everything is breaking out.”
What changed vs the previous breadth update (Friday, Jan 23)?
Friday’s data hinted at softening participation (decliners led; weekly breadth negative). Monday didn’t confirm that weakness:
-
Participation rebounded back above 50% advancers
-
Weekly breadth snapped back to slightly positive
-
New lows stayed contained, which matters when markets are near highs
The main “difference that matters” is where the weakness sits: not in the large-cap indexes (still strong), but more in pockets of the market, reflected by the still-elevated >4% decliners and IWM stalling at resistance.
Bottom line
The market continues to look like an uptrend that’s digesting rather than breaking down. SPY and QQQ are doing their job by holding above short-term support, while breadth improved enough to push back against Friday’s warning signs.
The two things to watch next:
-
Can IWM reclaim short-term momentum (back above EMA9 and pushing through resistance)?
-
Do the downside “tail events” fade (Declining >4% dropping back below Advancing >4%)?
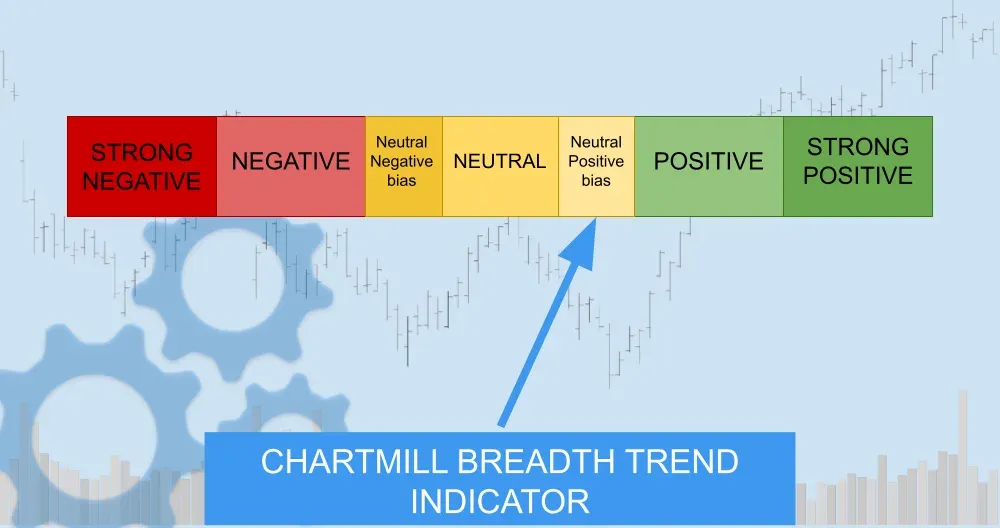
5 — Neutral, positive bias.
As long as new lows remain muted and the SMA(20/50) participation stays in the mid-to-high 60s, the tape deserves a neutral-to-bullish read, but with a clear note of caution that leadership is still concentrated.
Kristoff
Next to read: The Doctor Is In: Burry Bets on the Meme King While Trump Eyes a Maple Leaf Tariff