
Tuesday’s session was a mild “pause” day: SPY and QQQ slipped a fraction and breadth turned slightly negative on a day-to-day basis. But participation under the surface remains clearly constructive, with a strong majority of stocks still trading above key moving averages and new highs continuing to outnumber new lows by a wide margin.
Index overview (SPY, QQQ, IWM)
Short Term (Daily)

Long Term (Weekly)
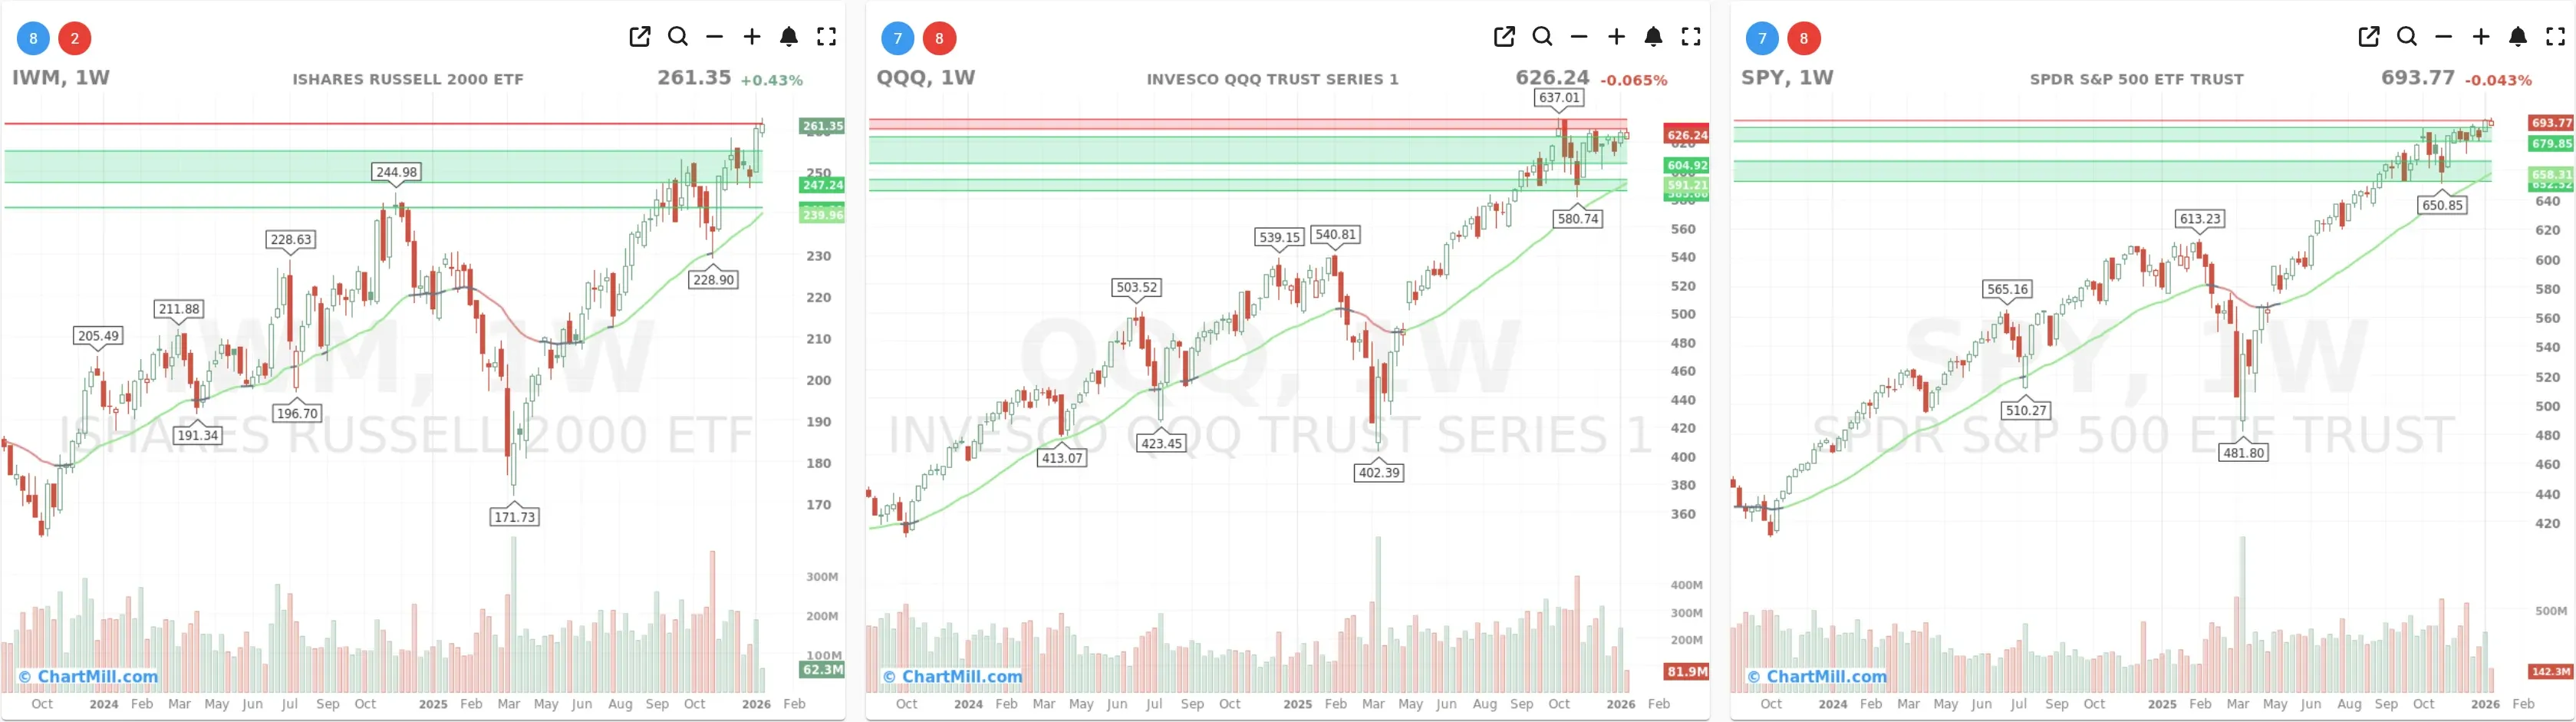
SPY - Constructive pullback inside an uptrend
SPY ended slightly lower near the upper end of its recent range. On the daily chart, price is still holding above both EMA9 and EMA21, which keeps the short-term trend structure bullish despite the small red day. The key takeaway for me: the market is pausing near highs, not breaking down. As long as SPY holds above the nearest support zone (the recent breakout area just below), the path of least resistance remains higher—even if we get more digestion first.
On the weekly chart, the 30-week trend indicator remains green, confirming that the larger trend is still supportive. This looks like consolidation at elevated levels rather than distribution.
QQQ - Strength, but still wrestling with overhead supply
QQQ also finished modestly lower and continues to chop near a clear resistance band overhead. Daily price remains above EMA9/EMA21, but the repeated back-and-forth around the upper zone tells me leadership is stable but not accelerating.
The weekly view stays firmly constructive (green long-term trend), yet the message is similar to SPY: uptrend intact, momentum cooling at resistance. If QQQ can push cleanly through that ceiling, it would likely pull broader breadth higher again. If it fails, the first meaningful “test” becomes the mid-range support zone below.
IWM - Small-caps still leading
IWM was essentially flat on the day, but it continues to act like the relative-strength pocket of the market. On the daily chart, it’s holding above its short-term averages and is pressing up near the top of its recent structure. Importantly, this isn’t a one-day story: the weekly chart shows IWM in a green long-term trend and pushing into (or through) prior resistance.
This matches what I’ve been tracking in recent updates: rotation into smaller names is still alive, even when the broad tape pauses.
What the breadth data says (Jan 13, 2026)
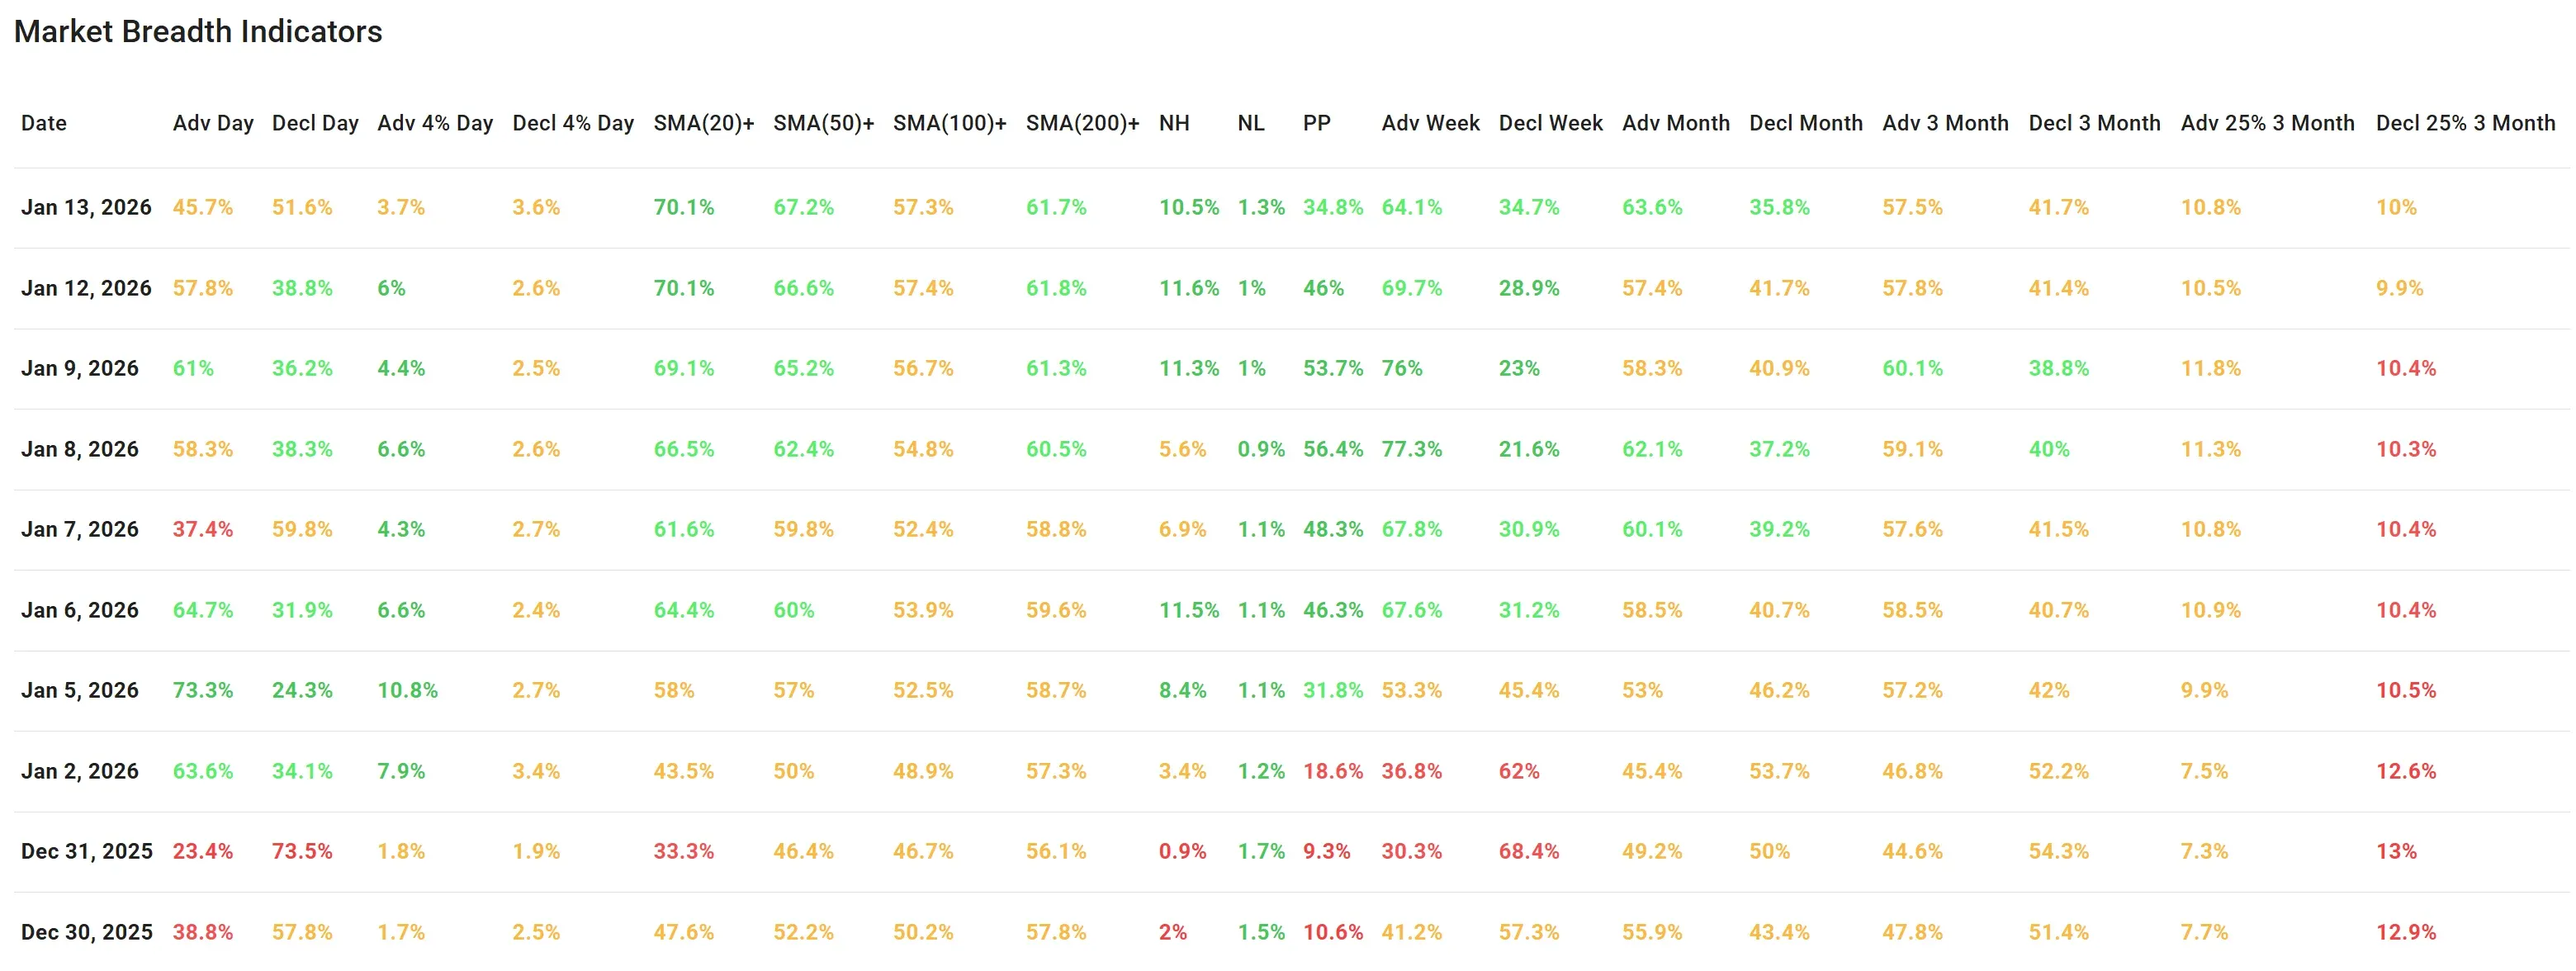
Daily breadth flipped slightly negative
-
Advancers vs decliners: 45.7% / 51.6% → a mild down-day under the surface.
-
Big movers were balanced: Adv >4%: 3.7% vs Decl >4%: 3.6% → volatility exists, but it wasn’t a “panic distribution” type of day.
Compared with Monday (Jan 12), this is a clear cooling: the prior session had a more comfortable advancer skew (57.8% advancers), while Tuesday slipped back toward “mixed-to-soft.”
Participation remains strong across key moving averages
Despite the softer day, the market’s internal structure still looks healthy:
-
70.1% above SMA(20)
-
67.2% above SMA(50)
-
57.3% above SMA(100)
-
61.7% above SMA(200)
That combination matters. A weak day with high percentages above trend measures usually reads as profit-taking / consolidation, not a regime shift.
New highs still comfortably beat new lows
- New Highs: 10.5% vs New Lows: 1.3%
This is one of the cleanest “health checks” in the table. Even with the daily wobble, the market is still producing far more new highs than new lows, which is typically inconsistent with an imminent broad breakdown.
The bigger timeframes remain supportive
Even after Tuesday’s pause, the broader thrust metrics are still favorable:
-
Weekly: 64.1% adv vs 34.7% decl
-
Monthly: 63.6% adv vs 35.8% decl
-
3-month: 57.5% adv vs 41.7% decl
So when I zoom out, the story is: the market may be taking a breath at resistance, but the medium-term breadth backdrop remains positive.
Putting it together: continuation, not contradiction
In the most recent updates, the key theme has been improving participation and a market that’s gradually rebuilding after the late-December softness. Tuesday didn’t really break that narrative, it simply interrupted the short-term momentum.
The indices are still technically constructive (above short-term averages, green long-term trend on weekly charts).
Breadth did cool on the day, but the foundation (moving-average participation + new highs vs new lows + weekly/monthly thrust) remains solid.
Small caps (IWM) continue to look like a leadership candidate, which is typically a healthy ingredient when it persists.
Breadth trend rating (1–7)
5 — Neutral, with a positive bias.

The day-to-day breadth turned slightly negative and QQQ is still dealing with resistance, so I’m not ready to call this “clean acceleration.” But the weight of evidence - strong SMA participation, a very favorable NH/NL spread, and positive weekly/monthly thrust - keeps the broader picture tilted to the upside.
Kristoff
Next to read: Trump’s Iran Tariff Threat Lit a Fuse Under Oil — and Wall Street Still Sold It