

(All data & visualisations by ChartMill.com)
Daily Market Trend Analysis – September 05, 2025 (After Market Close)
US index-ETFs stayed close to home just before the weekend
Short Term Trend
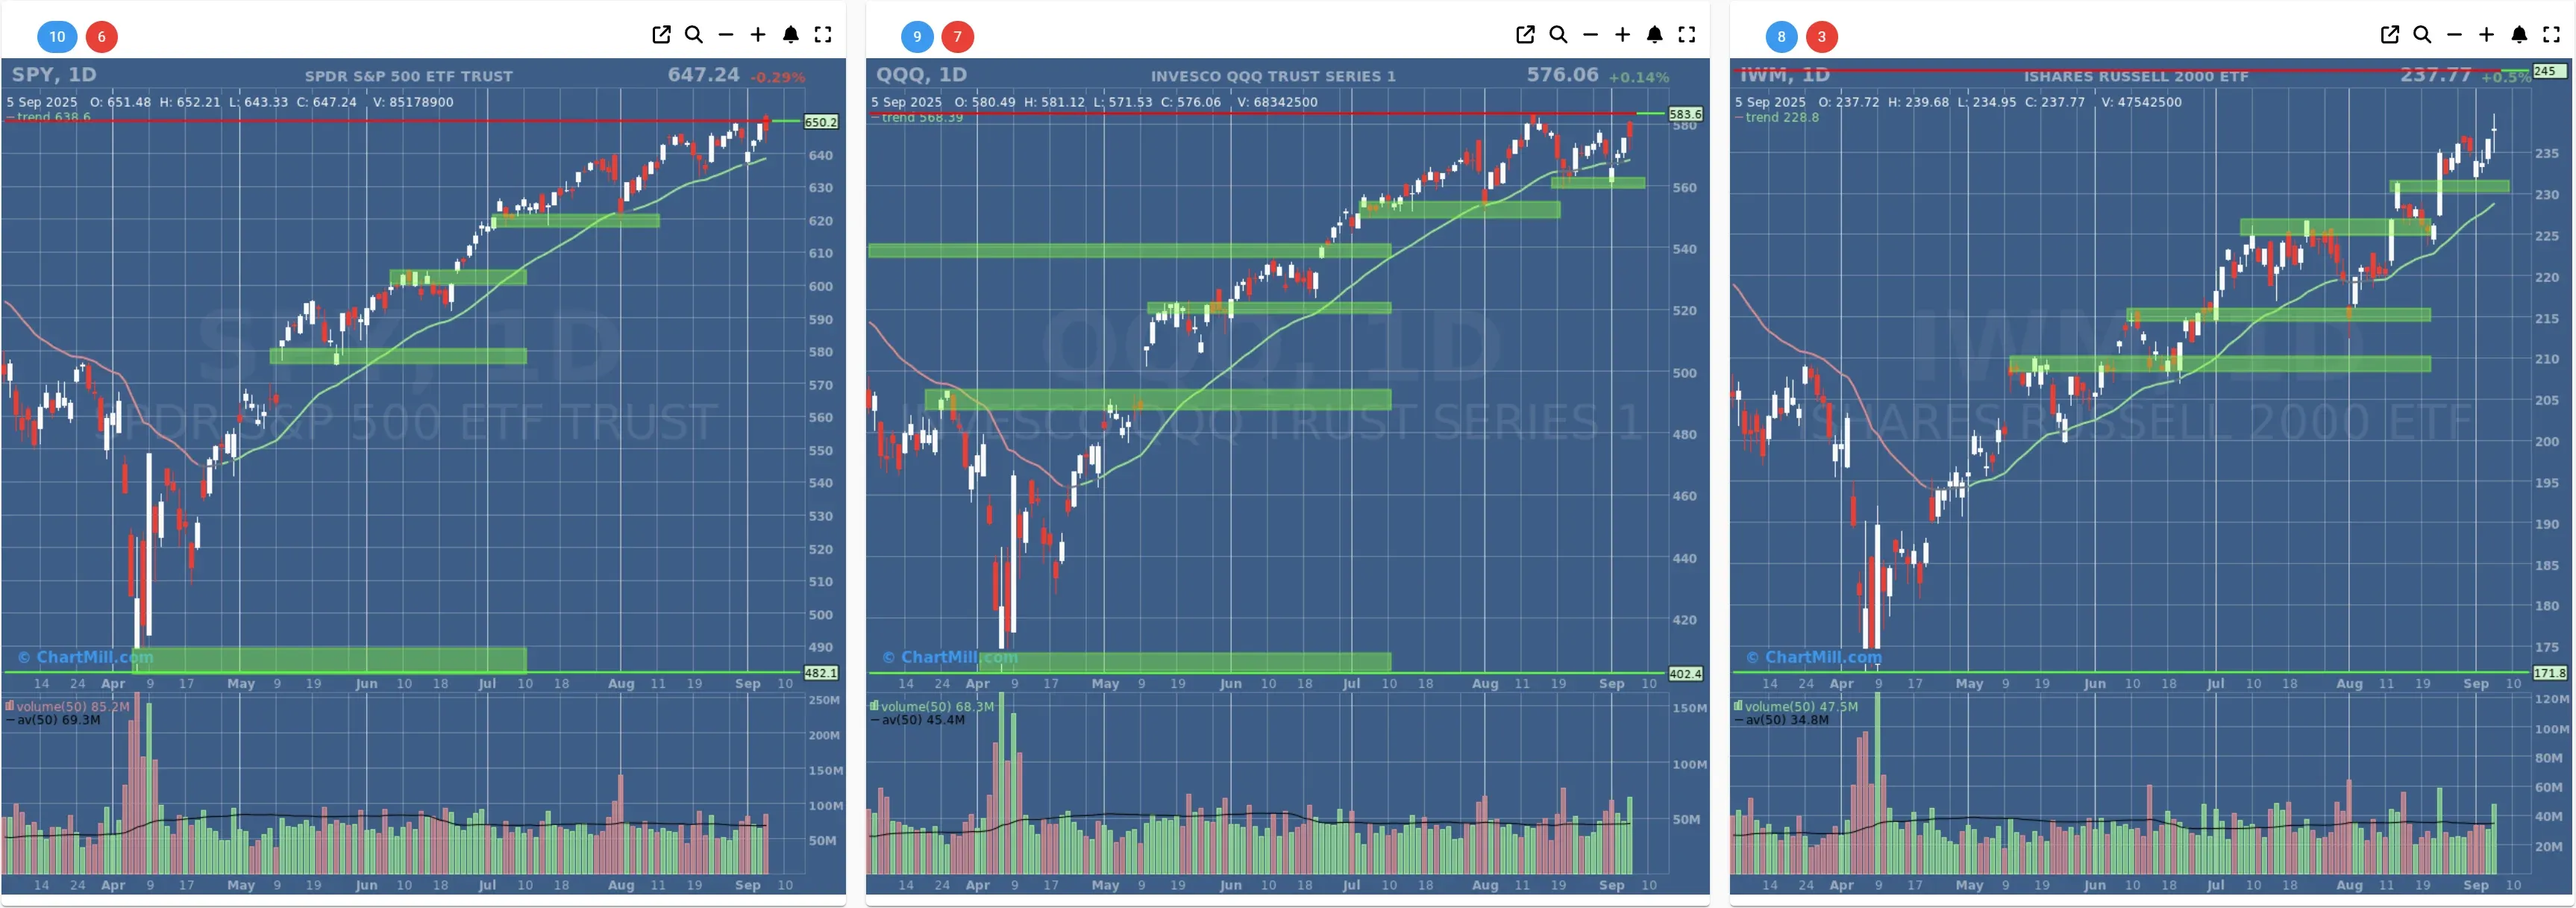
- Short-Term Trend: Positive (no change)
- Next Support at $640 - $630
- Next Resistance at $650
- Volume:Slightly Above Average (50)
- Pattern: Down Day - Gap Up
- Short-Term Trend: Trend Change - Positive (from Neutral)
- Next Support at $560
- Next Resistance at $583
- Volume: Well Above Average (50)
- Pattern: Down Day - Gap Up
- Short-Term Trend: Positive (no change)
- Next Support at $225 - $230
- Next Resistance at $237
- Volume: Well Above Average (50)
- Pattern: Up Day - Doji Candle
Long Term Trend
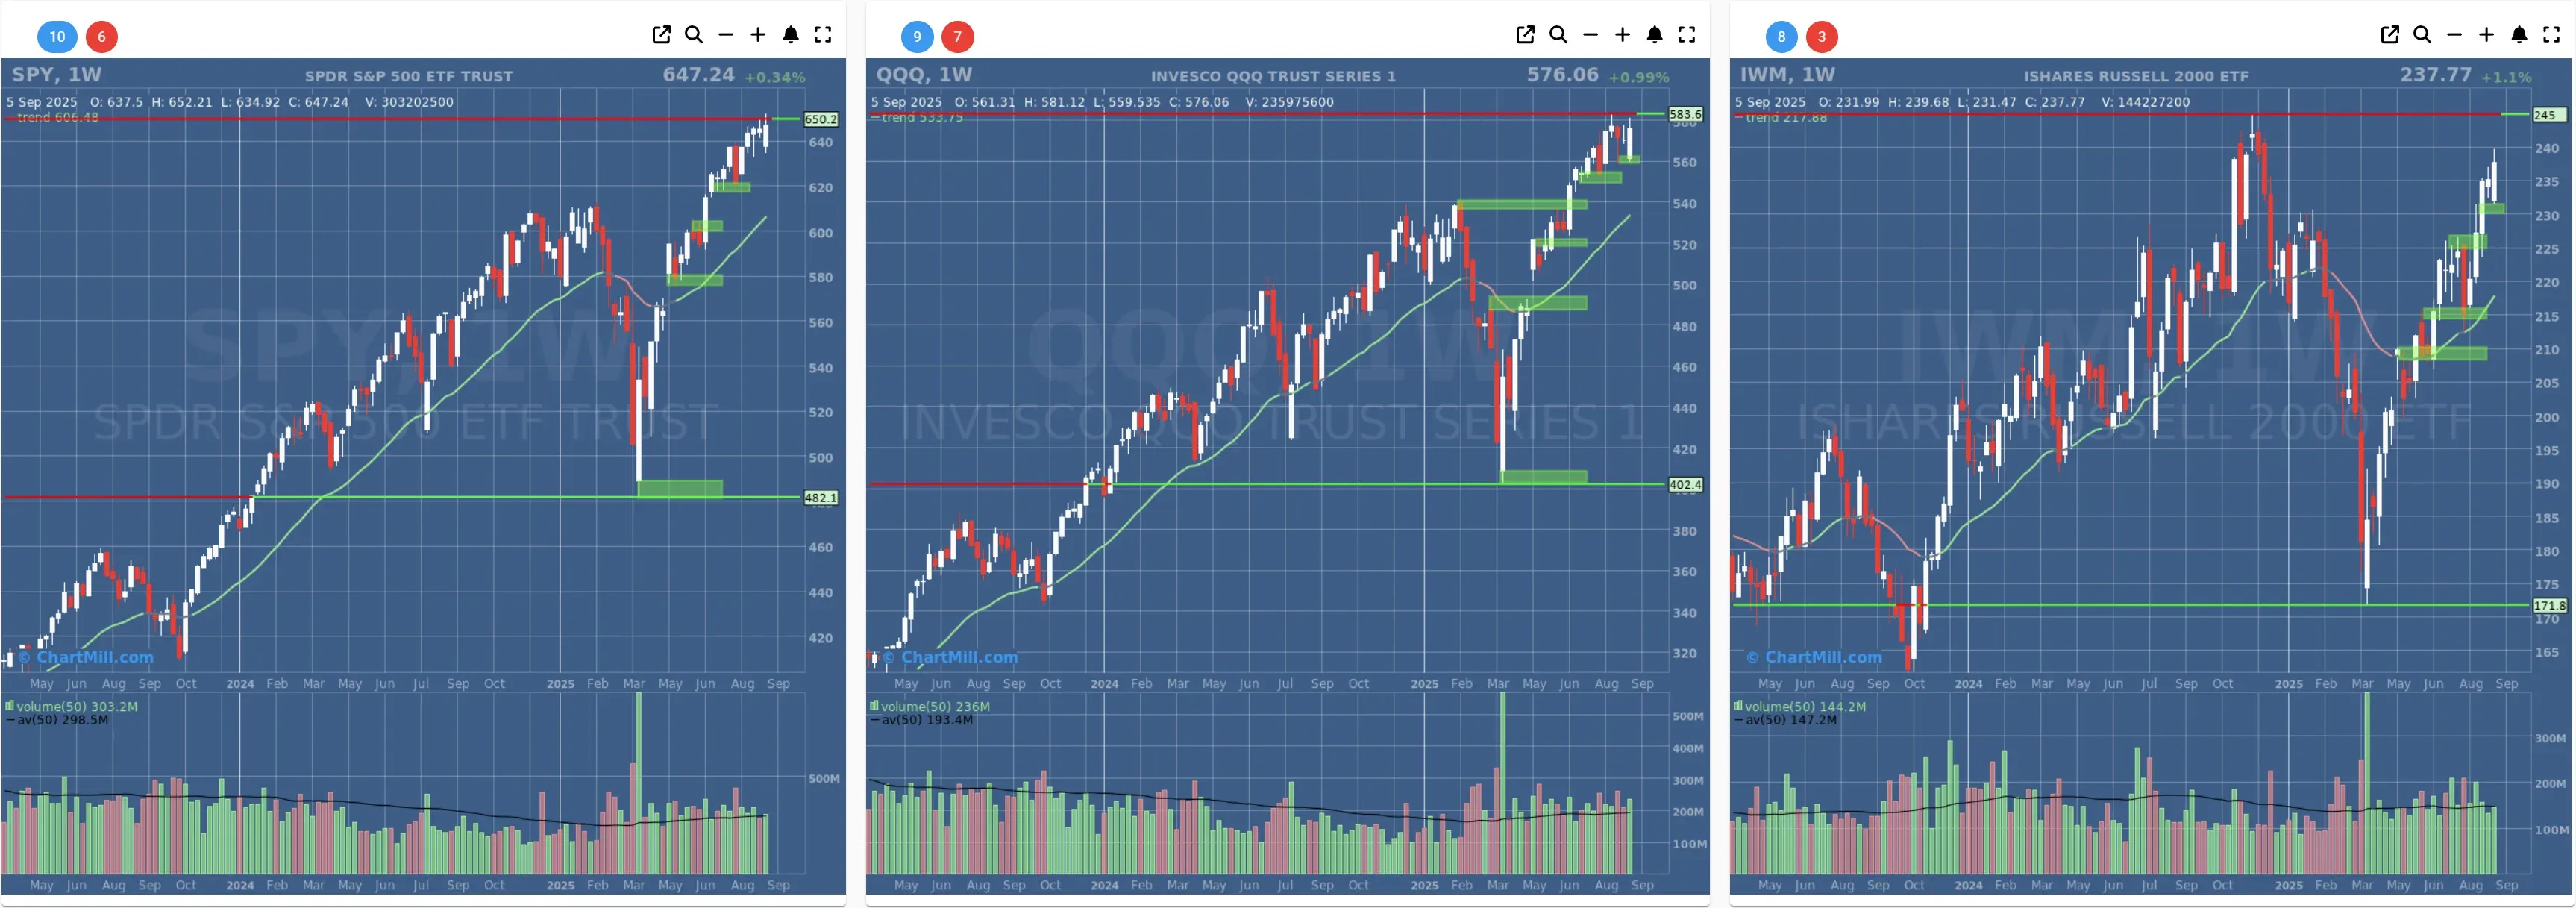
- Long-Term Trend: Positive (no change)
- Long-Term Trend: Positive (no change)
- Long-Term Trend: Positive (from neutral)
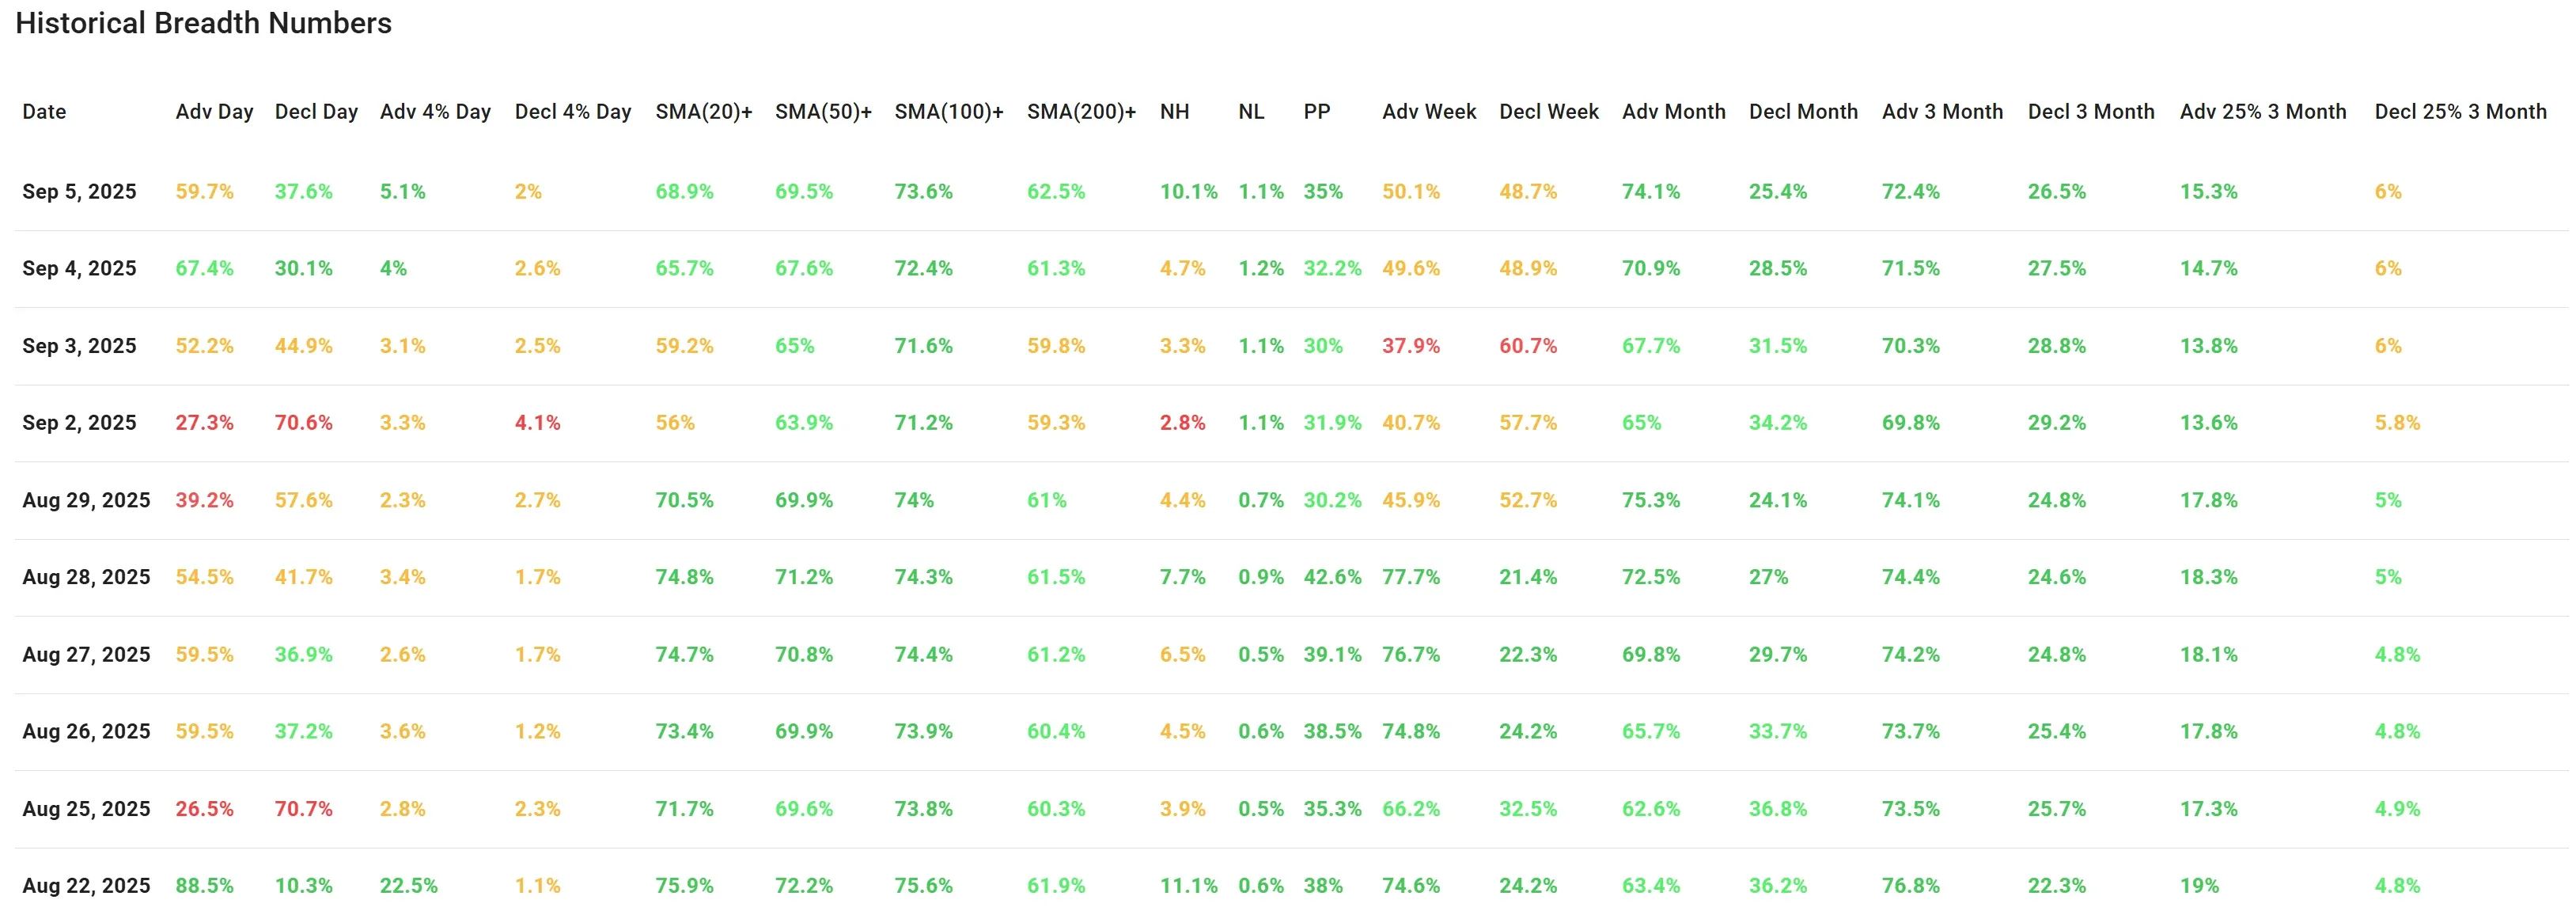
Daily Market Breadth Analysis – September 05, 2025 (After Market Close)
The final session of the week (Friday, Sep 5) maintained relatively solid breadth, though with less conviction than the prior session. Here's a breakdown of the key developments:
Day-over-Day Movements
Advancing vs Declining Stocks
-
Advancers: 59.7% (down from 67.4% on Sep 4)
-
Decliners: 37.6% (up from 30.1%)
A clear cool-down after Thursday’s strong showing, yet still firmly in positive territory.
Strong Movers (±4%)
-
Advancing 4%+: 5.1% (highest in 10 days)
-
Declining 4%+: 2%
The gap favors bulls, though not overwhelmingly.
Medium-Term Breadth Still Healthy
% Above Key Moving Averages:
-
SMA(20): 68.9% (↑ from 65.7%)
-
SMA(50): 69.5% (↑ from 67.6%)
-
SMA(100): 73.6% (↑ from 72.4%)
-
SMA(200): 62.5% (↑ from 61.3%)
These numbers continue to trend upward, confirming broad medium-term support across equities.
New Highs vs New Lows (NH/NL):
-
NH: 10.1% (highest in the series)
-
NL: 1.1%
A very strong internal signal, reflecting expanding leadership.
Longer-Term Breadth Still Solid
-
3-Month Advancers: 72.4%
-
3-Month Decliners: 26.5%
-
Top Quartile 3-Month Gainers (25%+): 15.3%
These figures have stabilized at healthy levels for several sessions now, showing persistent long-term participation.
Short-Term Momentum Wanes
-
Advancing Week: 50.1% (barely holding above parity)
-
Declining Week: 48.7%
This is a sharp slowdown from Wednesday's 77.7% weekly advancers and shows that despite Friday’s uptick, the broader advance has lost steam.
- Percentage of Stocks showing a PP (Pivot Point): 35% (barely up from 32.2% on Sep 4)
This metric still suggests that short-term breakout potential is limited.
Comparison to Previous Analysis
In the previous update (Sep 4), we noted the strong rebound in breadth and short-term momentum, following a period of contraction. That momentum slowed notably on Sep 5, but there was no major deterioration. The pullback is more reflective of a cooling rally than a reversal.
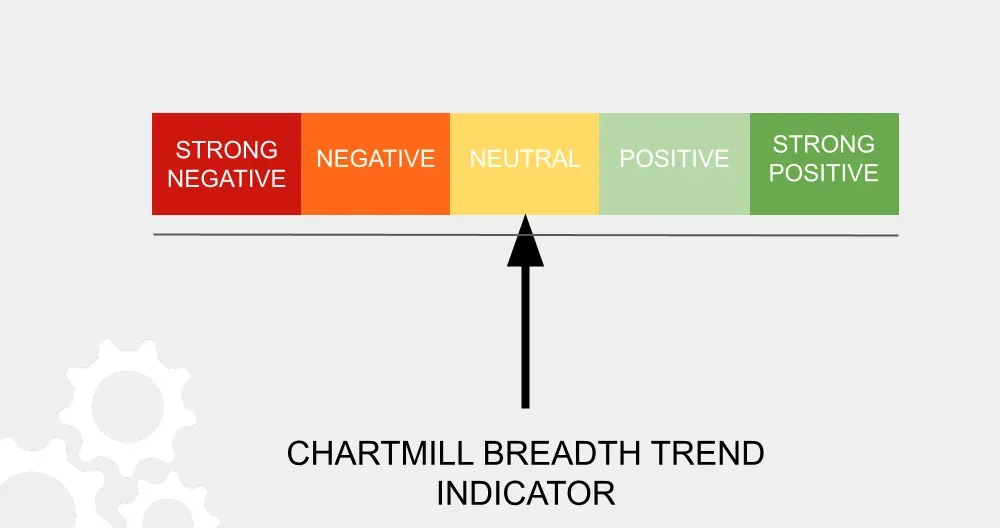
Breadth Trend Rating: 3 – Neutral (with a positive tilt)
Despite a solid week overall, the deceleration on Friday and lack of strong follow-through prevent a more bullish rating.
The medium- to long-term indicators remain broadly positive, but short-term signals are not confirming a sustained breakout yet.
Kristoff - ChartMill
Next to read: Market Monitor News, September 08 BMO