
Technical investors looking for breakout chances often use screening methods that mix trend strength with entry timing. The method centers on finding stocks with solid technical health using custom rating systems, then checking if they offer good risk-reward setups. This two-step filter helps find securities that are both trending well and set for possible continued moves.
Technical Strength Assessment
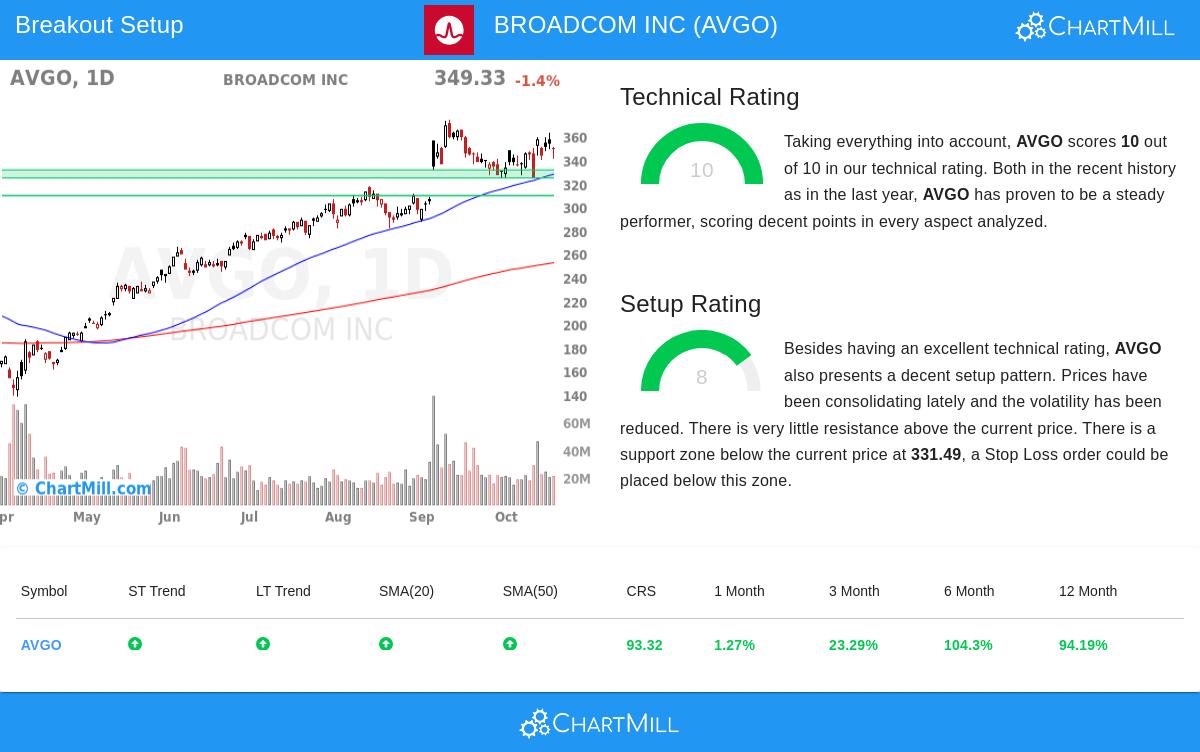
BROADCOM INC (NASDAQ:AVGO) shows very good technical traits based on the ChartMill Technical Analysis report, getting a top rating of 10 out of 10. This highest score shows broad strength across many timeframes and technical indicators. The semiconductor company displays steady results in both short-term and long-term trends, a key point for breakout candidates because lasting momentum often comes before continuation patterns.
Key technical positives include:
- Both short-term and long-term trends seen as positive
- Better relative strength than 93% of all stocks
- Good industry standing in semiconductors, doing better than 83% of similar companies
- Trading in the higher part of its 52-week range
- All main moving averages (20, 50, 100, and 200-day) moving up
The mix of these points shows Broadcom keeps solid technical health, making it fitting for investors searching for stocks with confirmed momentum. The top technical rating implies the stock has shown steady strength across different technical areas, lowering the chance of false breakouts.
Setup Quality Evaluation
Besides technical strength, Broadcom shows a notable setup pattern with a setup rating of 8 out of 10. This high score means the stock has been moving sideways lately with lower volatility, making circumstances good for possible breakout moves. The setup quality measure is especially important because it finds times when stocks are gathering energy for their next big price change.
Notable setup features:
- Price movement between $324.05 and $363.24 over the last month
- Little resistance above the present price levels
- Clear support area between $324.62 and $331.49
- Present trading spot in the middle of the recent range
The lower volatility and sideways pattern give clearer points for entry and exit choices, letting technical traders set clear risk limits. The existence of a firm support area allows for logical stop-loss orders, a vital part of risk control in breakout trading.
Trading Considerations
For investors looking at this setup, the technical analysis indicates a possible entry above $363.25, meaning a break above recent sideways movement. The noted support area gives a sensible spot for stop-loss placement near $324.61. The space between these levels is about 10.64% of the stock's value, letting position size choices depend on personal risk comfort.
The combination of top technical strength and high setup quality makes Broadcom worth noting for technical investors watching for breakout chances. Still, traders should always think about wider market situations and company-specific news before acting on any plan.
Investors searching for similar technical breakout chances can look at other candidates using the Technical Breakout Setups screen, which often updates with stocks matching both technical strength and setup quality needs.
Disclaimer: This analysis uses technical indicators and pattern finding and should not be taken as investment advice. Always do your own research and think about your risk comfort before making investment choices. Technical analysis does not promise future results and should be used as one part of a full investment method.