Why ADVANCED MICRO DEVICES (NASDAQ:AMD) Is a Promising High-Growth Stock in the Midst of Consolidation.
By Mill Chart
Last update: Mar 14, 2025
For growth-minded investors, high revenue and EPS growth are key criteria. Today, we'll examine whether ADVANCED MICRO DEVICES (NASDAQ:AMD) fits the bill for growth investing, particularly as it forms a base and hints at a potential breakout. Remember, due diligence is essential, but ADVANCED MICRO DEVICES has caught our attention on our screen for growth with base formation. It may warrant additional investigation.
ChartMill's Evaluation of Growth
ChartMill assigns a proprietary Growth Rating to each stock. The score is computed by evaluating various growth aspects, like EPS and revenue growth. We take into account the history as well as the estimated future numbers. AMD was assigned a score of 9 for growth:
- AMD shows a strong growth in Earnings Per Share. In the last year, the EPS has been growing by 25.28%, which is quite impressive.
- The Earnings Per Share has been growing by 38.99% on average over the past years. This is a very strong growth
- The Revenue has grown by 13.69% in the past year. This is quite good.
- Measured over the past years, AMD shows a very strong growth in Revenue. The Revenue has been growing by 30.81% on average per year.
- Based on estimates for the next years, AMD will show a very strong growth in Earnings Per Share. The EPS will grow by 37.03% on average per year.
- Based on estimates for the next years, AMD will show a very strong growth in Revenue. The Revenue will grow by 21.87% on average per year.
Deciphering AMD's Health Rating
ChartMill utilizes a Health Rating to assess stocks, scoring them on a scale of 0 to 10. This rating takes into account a variety of liquidity and solvency ratios, both in absolute terms and in comparison to industry peers. AMD has earned a 6 out of 10:
- AMD has an Altman-Z score of 8.90. This indicates that AMD is financially healthy and has little risk of bankruptcy at the moment.
- The Altman-Z score of AMD (8.90) is better than 78.70% of its industry peers.
- AMD has a debt to FCF ratio of 0.72. This is a very positive value and a sign of high solvency as it would only need 0.72 years to pay back of all of its debts.
- The Debt to FCF ratio of AMD (0.72) is better than 82.41% of its industry peers.
- A Debt/Equity ratio of 0.03 indicates that AMD is not too dependend on debt financing.
- A Current Ratio of 2.62 indicates that AMD has no problem at all paying its short term obligations.
What does the Profitability looks like for AMD
ChartMill assigns a Profitability Rating to every stock. This score ranges from 0 to 10 and evaluates the different profitability ratios and margins, both absolutely, but also relative to the industry peers. AMD scores a 6 out of 10:
- The last Return On Invested Capital (2.66%) for AMD is above the 3 year average (1.56%), which is a sign of increasing profitability.
- AMD's Profit Margin has improved in the last couple of years.
- AMD's Operating Margin of 7.90% is fine compared to the rest of the industry. AMD outperforms 62.04% of its industry peers.
- AMD has a better Gross Margin (49.35%) than 63.89% of its industry peers.
- In the last couple of years the Gross Margin of AMD has grown nicely.
How does the Setup look for AMD
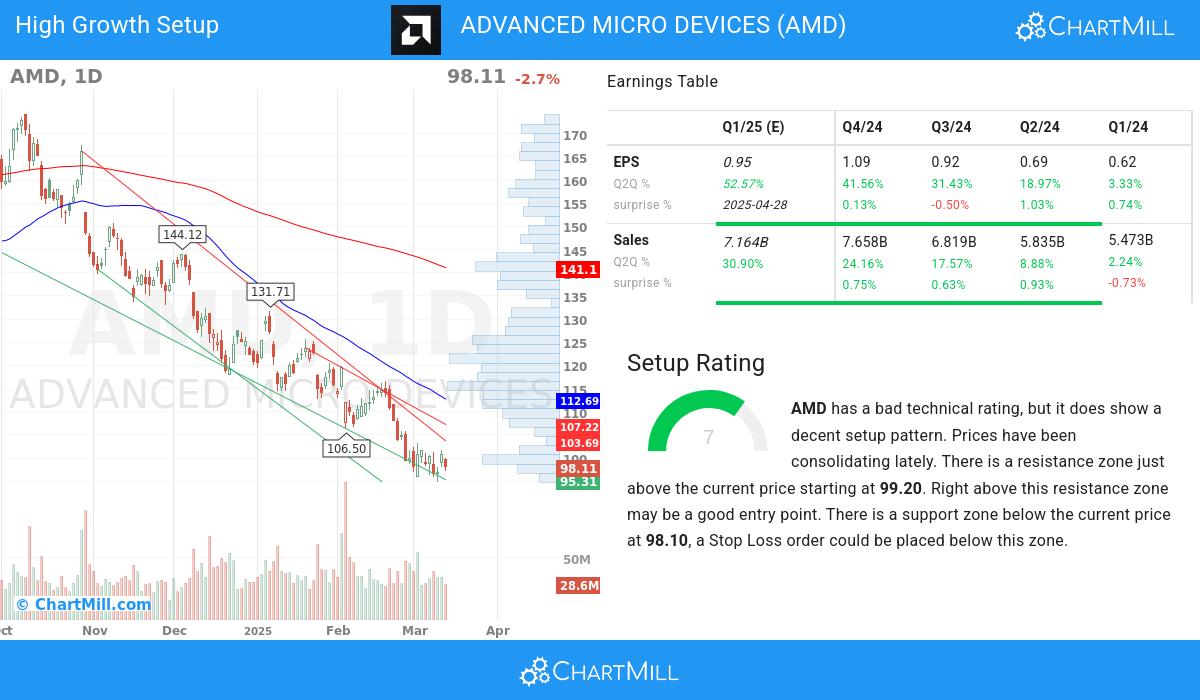
ChartMill assigns a Setup Rating to evaluate the consolidation level of a stock. This rating, ranging from 0 to 10, is updated daily and considers various short-term technical indicators. The current setup rating for AMD is 7:
AMD has a bad technical rating, but it does show a decent setup pattern. Prices have been consolidating lately. There is a resistance zone just above the current price starting at 99.20. Right above this resistance zone may be a good entry point. There is a support zone below the current price at 98.10, a Stop Loss order could be placed below this zone.
Our Strong Growth screener lists more Strong Growth stocks and is updated daily.
Check the latest full fundamental report of AMD for a complete fundamental analysis.
For an up to date full technical analysis you can check the technical report of AMD
Keep in mind
Important Note: The content of this article is not intended as trading advice. It is essential to perform your own analysis and exercise caution when making trading decisions. The article presents observations created by automated analysis but does not guarantee any trading or investment outcomes. Always trade responsibly and make independent judgments.
213.43
+12.37 (+6.15%)
Find more stocks in the Stock Screener
AMD Latest News and Analysis