Trend Following Trading Strategy Guide
WHY TREND FOLLOWING?
Typical trend investors have only three consecutive goals in mind:
- Identify new potential long-term trends
- Stay invested in clear strong trends as long as possible
- Close positions as quickly as possible when it is clear that the trend has ended.
Thus, the purpose of a trend following strategy is not to predict tops or bottoms. The typical trend trader will try to identify the main trend before taking a position and then open a position in the direction of that prevailing trend in order to maximize potential profits.
The difficulty of course is that nobody can predict exactly when a trend will occur or in what order it will happen. So risk management is an indispensable part of this or any other strategy. It is important to be well aware of that and to study it even before you start investing.
TYPE OF TRENDS
Let's start with the distinction between the different types of trends. Regardless of which chart or timeframe you look at, there are only three possibilities:
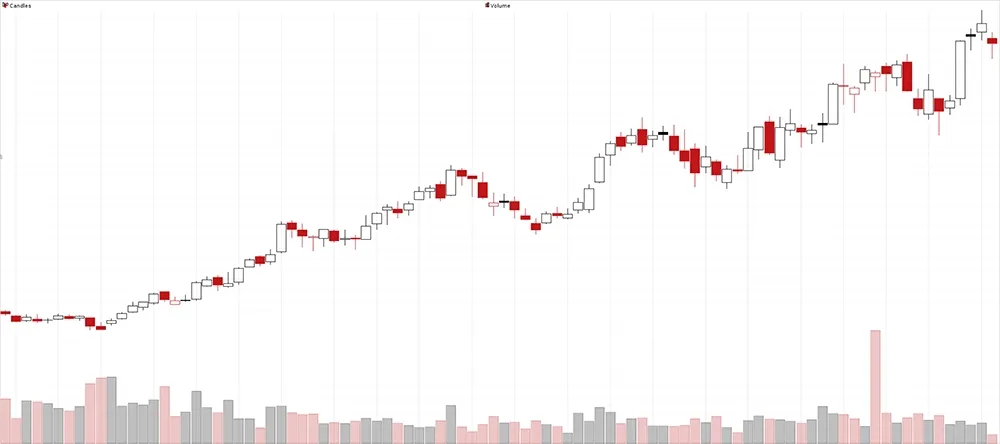
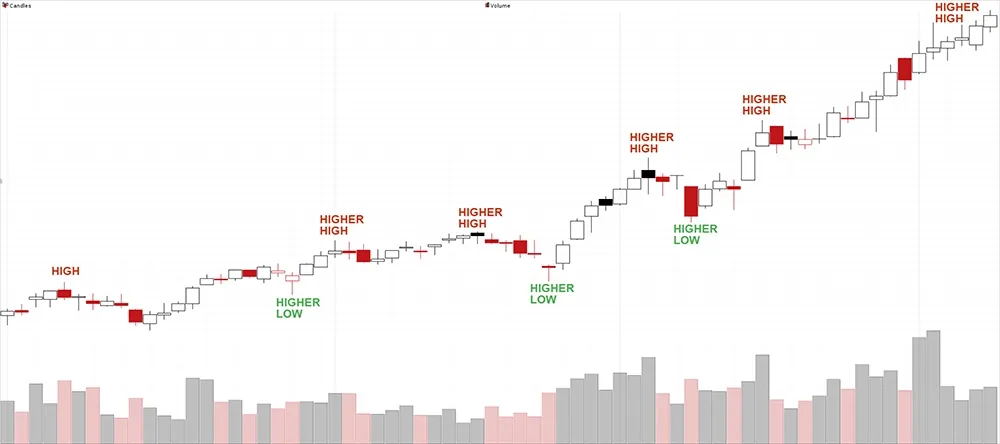
- Rising trend: a rising price trend is characterized by higher tops and bottoms, an uptrend never happens in a straight line.
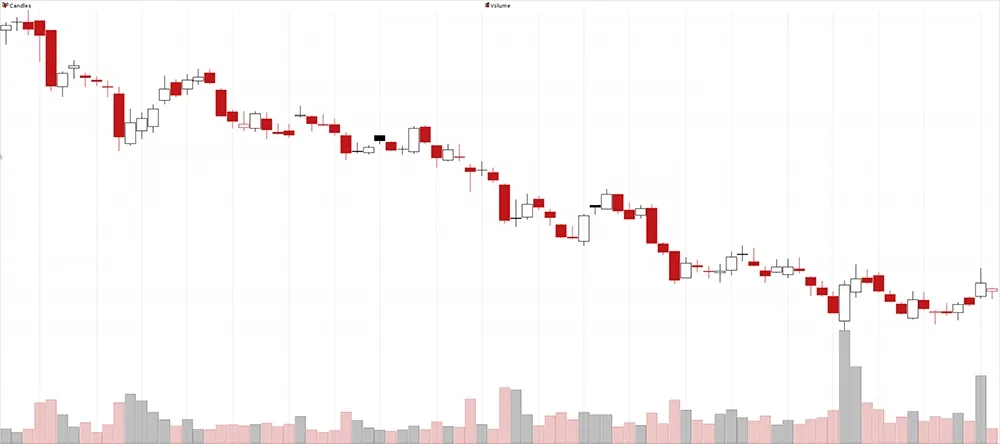
- Downward trend: a downtrend is characterized by lower tops and bottoms.
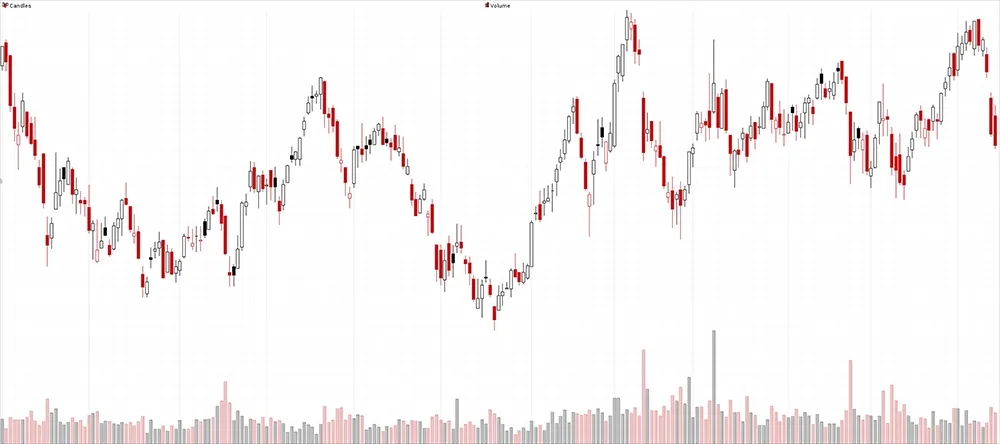
- Sideways trend: In this trend the tops and bottoms are at approximately the same level within which the price moves up and down between a certain range.
Important: A trend is only valid on the timeframe on which it is visible. Indeed, it is perfectly possible that based on the daily chart you are dealing with a rising trend but that the current trend on the monthly chart is still overwhelmingly bearish.
trend down
trend up
trend sideways
HOW TO RECOGNIZE TRENDS?
Because it makes sense for a trend following strategy to take action based on a prevailing trend, it is important to be able to determine the trend of a stock as accurately as possible. This can be done in several ways.
Just take a look at the chart
Clear upward and downward trends are easily recognized by the sequence of higher tops and bottoms in a positive trend and lower tops and bottoms in a negative trend.
However, these kind of perfect price trends rarely occur, rather you will be confronted with charts like this:
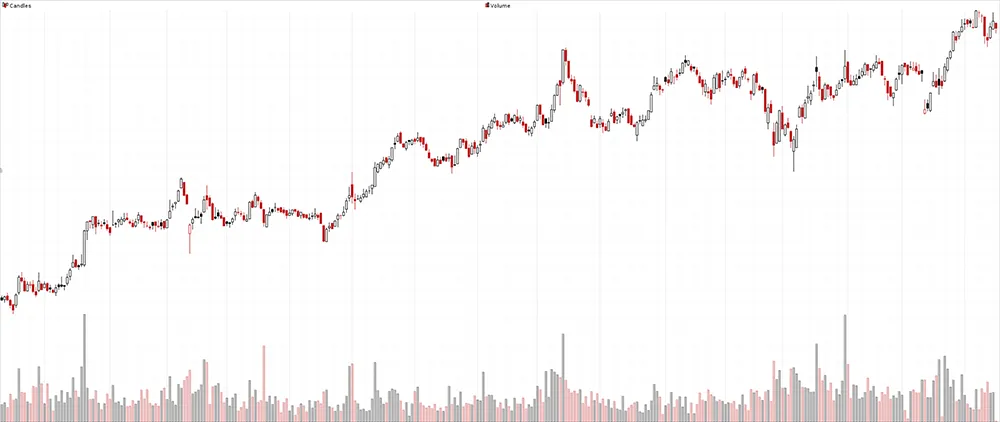
A much more erratic price pattern but when you compare the price on the left with the price on the far right there is indeed a rising price trend. So a more systematic and objective way of determining the trend is needed.
Using Moving Averages
Using Moving Averages is the most popular and also the most appropriate way to determine the trend of a stock, both in the short, medium and long term.
A moving average (MA) is a technical indicator that adds up the price points of an instrument over a period of time and then divides it by the number of points, creating a single trend line. The MA is popular with investors because it helps determine the direction of the current trend and reduces the influence of random spikes.
Calculating a MA requires a certain, sometimes significant amount of data, depending on the chosen length of the moving average. A Simple Moving Average of 10 periods (SMA10) requires data of 10 days, while an MA over a period of a year requires data of 365 days (assuming that 1 period = 1 trading day).
IMPORTANT: an SMA50 can cover either 50 days, 50 weeks or just 50 minutes. It all depends on the timeframe you are looking at the chart and for which the average is shown.
The indicator is called "moving" because new data replaces the oldest data, making the line in the chart move forward. Some commonly used moving averages are the SMA200, SMA50, SMA20 and SMA10.
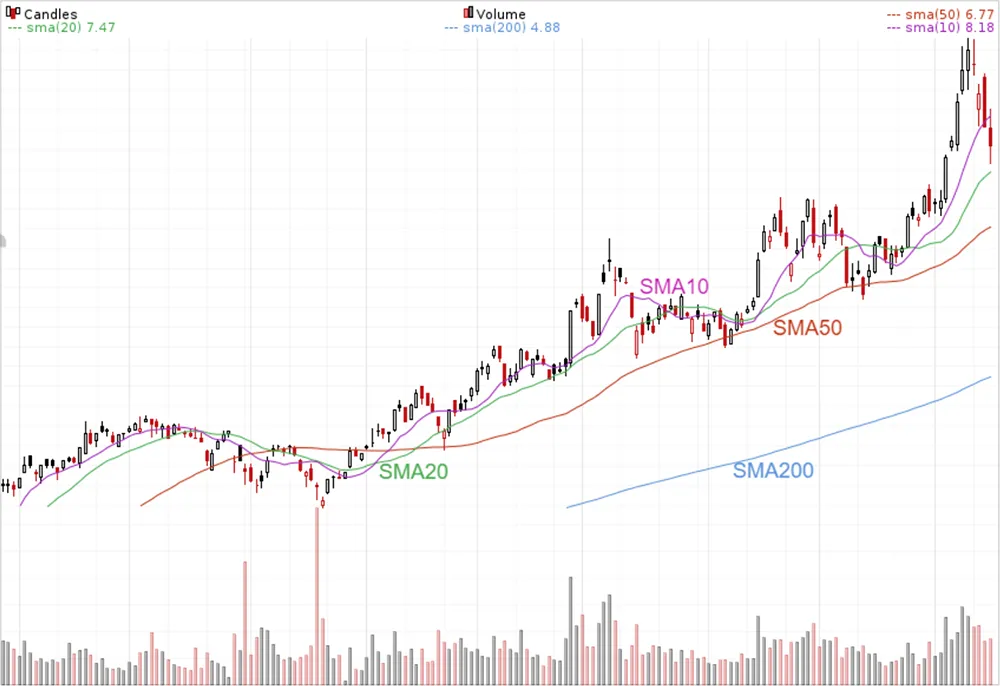
The SMA200 (blue line) represents the average price of the past 200 trading days and is therefore widely used for determining the long-term trend on the daily chart. Stocks whose price is above the 200SMA are considered bullish. If the price is below the 200SMA, it is a sign that the stock is in a downward trend (bearish).
The SMA20 (green) and SMA50 (red) are used to determine the medium-term price trend. If the SMA20 is above the SMA50 the medium term is bullish. The same medium term is bearish if the SMA20 quotes below the SMA50.
To identify the short-term trend, the combination of the SMA10 (purple) with the SMA20 (green) can be used. If the SMA10 is lower than the SMA20, the short-term trend is downward. Otherwise - (SMA10> SMA20) - the short-term trend is bullish. Those who want to be even more concise can use the SMA5 instead of the SMA10.
More in depth info about moving averages can be found in these articles:
- The Simple Moving Average
- The Exponential Moving Average
- The Smoothed Moving Average
- How To Use Moving Averages to Determine the Trend?
Using the ChartMill Trend Indicator
The ChartMill Trend Indicator is a 30-week Moving Average line used on the weekly chart (each bar or candlestick thus represents a full trading week), it serves to visualize the long-term trend of a stock. The line can be red, green or gray:
- Red : falling trend
- Green: rising trend
- Grey : neutral trend or sideways trend
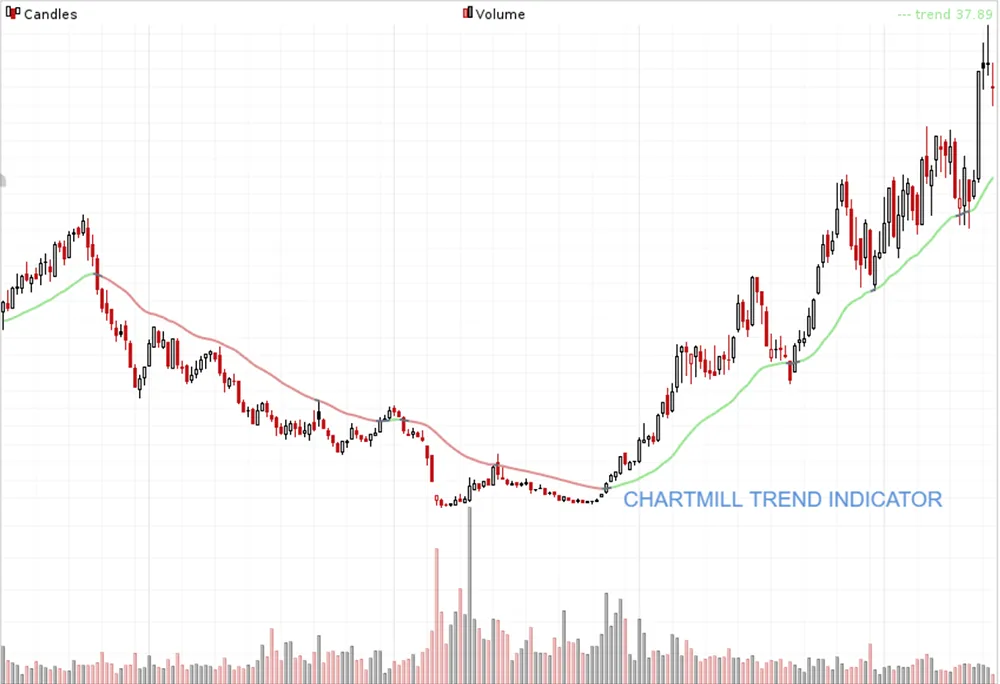
The advantage of this indicator is that a single line can represent the different long-term trend stages. This 30-week average line is also discussed in the book 'Secrets for profiting in Bull and Bear Markets' by Stan Weinstein, technical analyst and trader.
In this article you will find more detailed information about this ChartMill Trend Indicator.
Using the MACD indicator
Specific technical indicators can also be used to determine the trend of a stock:
MACD (Moving Average Convergence Divergence).
For determining the short-term trend, if the MACD (red line) is below the signal line (black), the trend is down. If the MACD is above the signal line, the short-term trend is bullish.
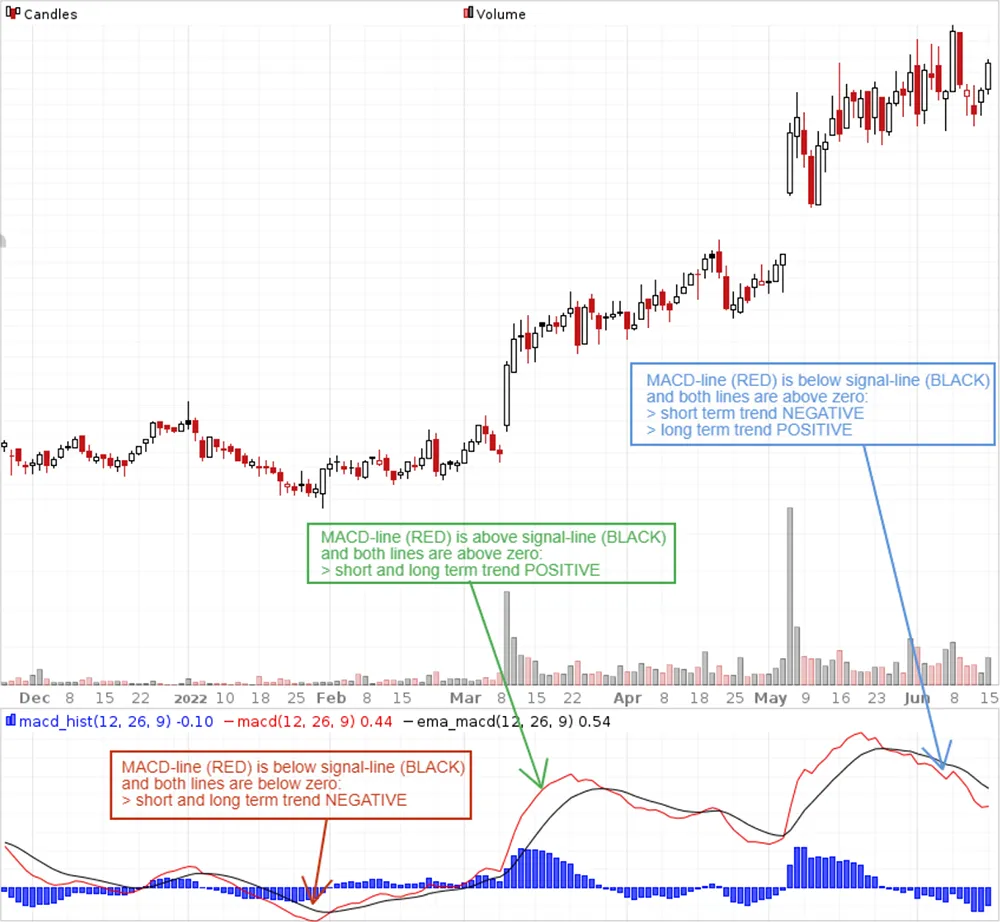
For the medium term we consider the position of the MACD and signal line in relation to the zero line. If they are below the zero line the medium term trend is downward. If both the MACD and signal line are above the zero line the medium term is bullish.
HOW TO USE TRENDS?
The importance of Timeframes
In a trend following strategy, positions are only taken in the direction of the existing long-term trend. Determining the timeframe on which you trade plays an important role because - as we touched on earlier - the observed price trend depends purely on the timeframe on which the stock is being viewed.
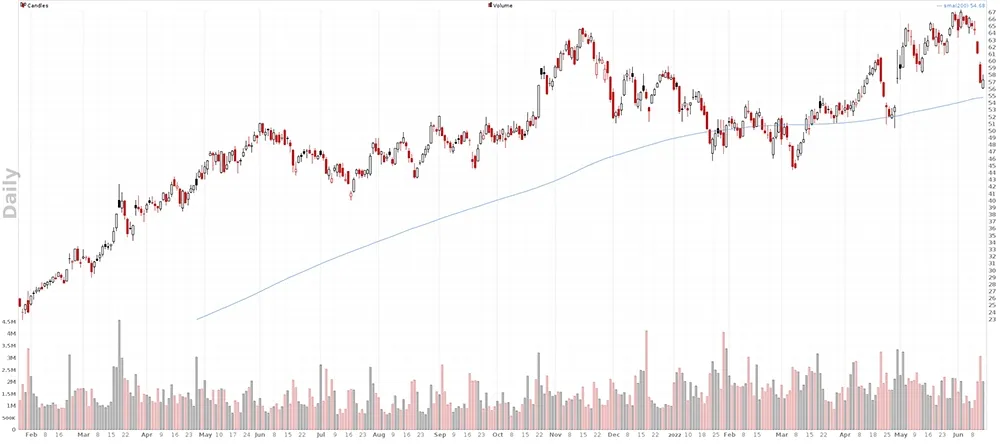
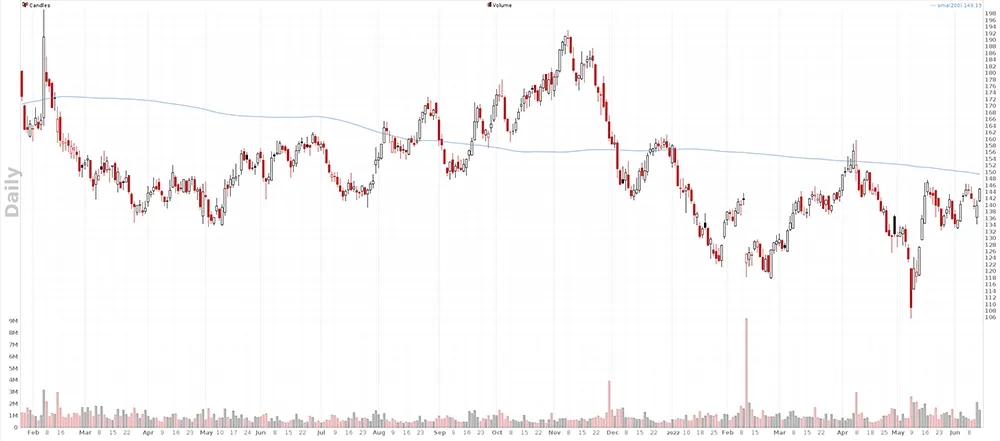
Below is a daily chart showing the SMA200. Since the price is still trading above the SMA200, the trend remains positive.
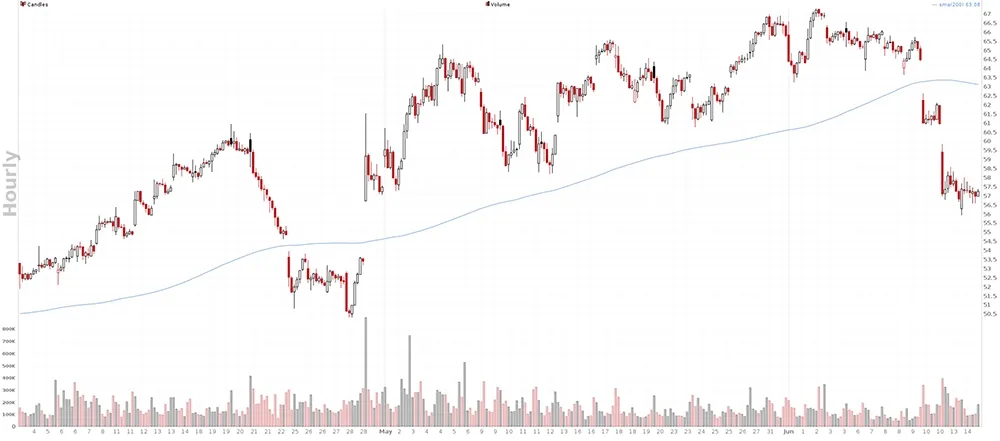
If we take a closer look at the same stock on the hourly chart with the same SMA200, we suddenly notice that the price is below the blue line, indicating that the long-term trend on this chart is downwards.
Another example but now on the daily and weekly chart, using the ChartMill Trend Indicator
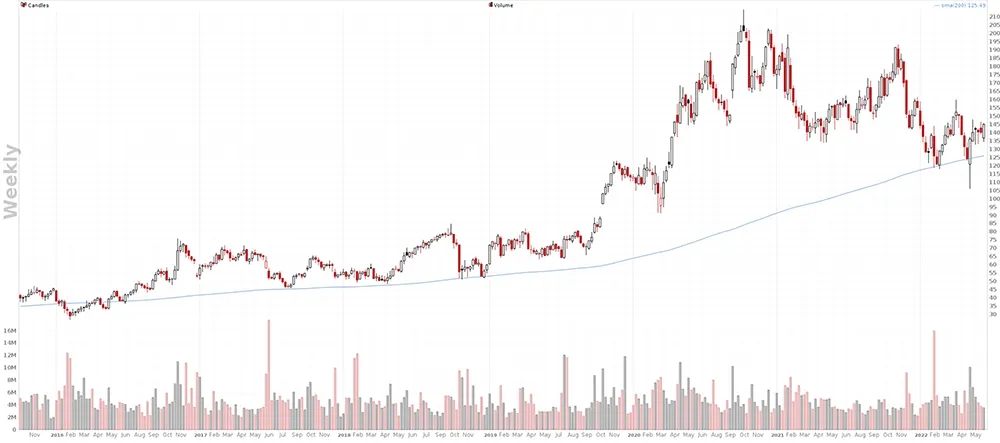
IN the chart above the 200SMA is below the current pricelevel, which means that the trend is upwards.
However, on the daily chart price is already below the SMA200, indicating a downward trend.
The Top/Down Approach
The top/down approach ensures that the decision we are about to make to buy or sell a stock is based on a system that determines the trend as objectively as possible. This means that we always rely on the higher timeframe to determine the main trend.
Why? Quite simply, recognizing trends is easy when you look at charts with past price information. The problem, however, is that to make money you will have to make some assumption about how the trend will evolve in the future.
Take a look at the chart below. The price starts at the bottom left and ends at the top right, a beautiful upward price trend. It is very tempting to imagine how much money you would have made if you had bought at those low pricelevels...
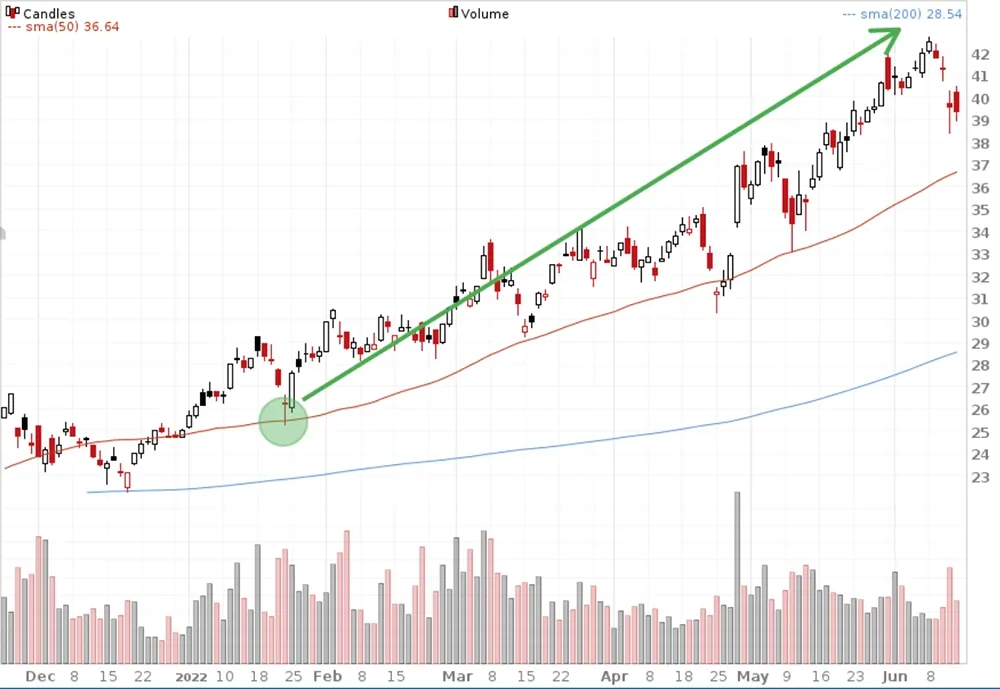
The real question is, what are you going to do if you notice a chart like this one?
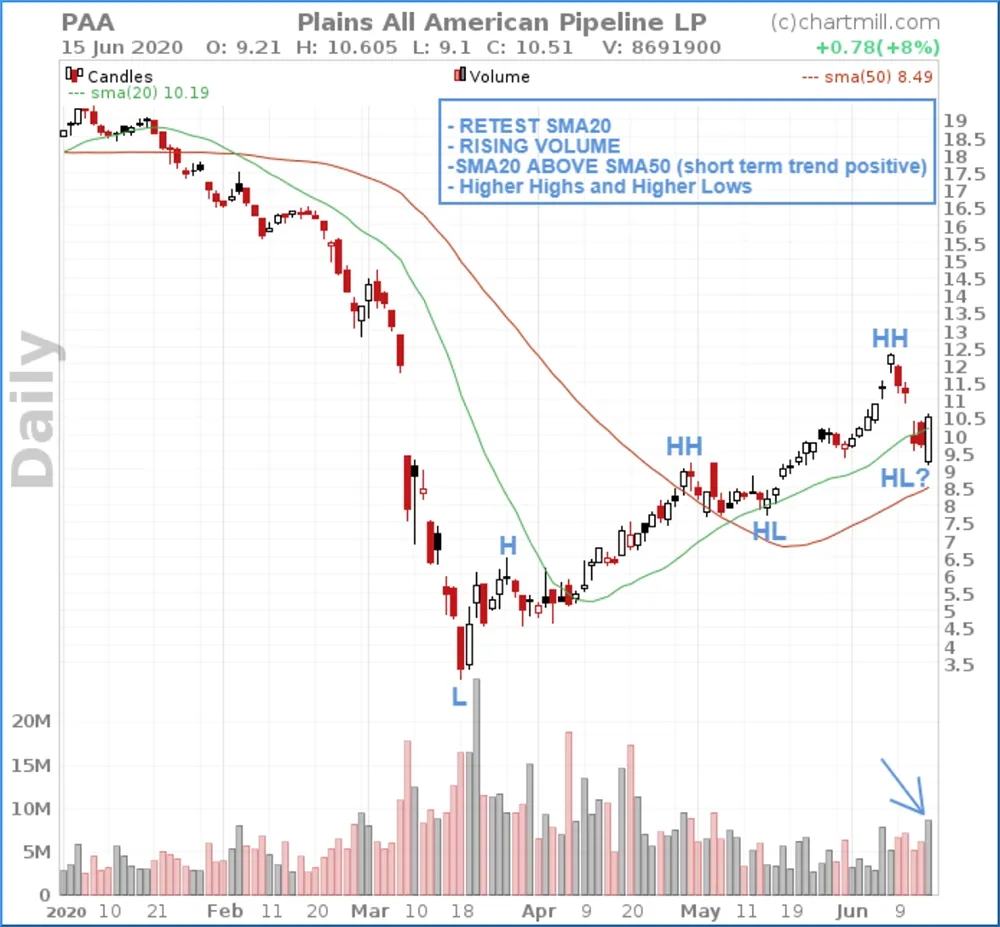
At first glance, this looks like a price retracement in a new bullish trend with the formation of a second higher low since the last price bottom which dates back to mid-May 2020. Also, the position of the SMA20, which crossed the SMA50 upwards in early May is an additional indication of a new bullish price trend.
A price decline near the 50SMA (red line) as visible on the chart could well be the ideal entry point to surf along on a continuation of this new price trend. However, looking at the larger timeframe (the weekly chart) with the same end date as the chart above we get this picture:
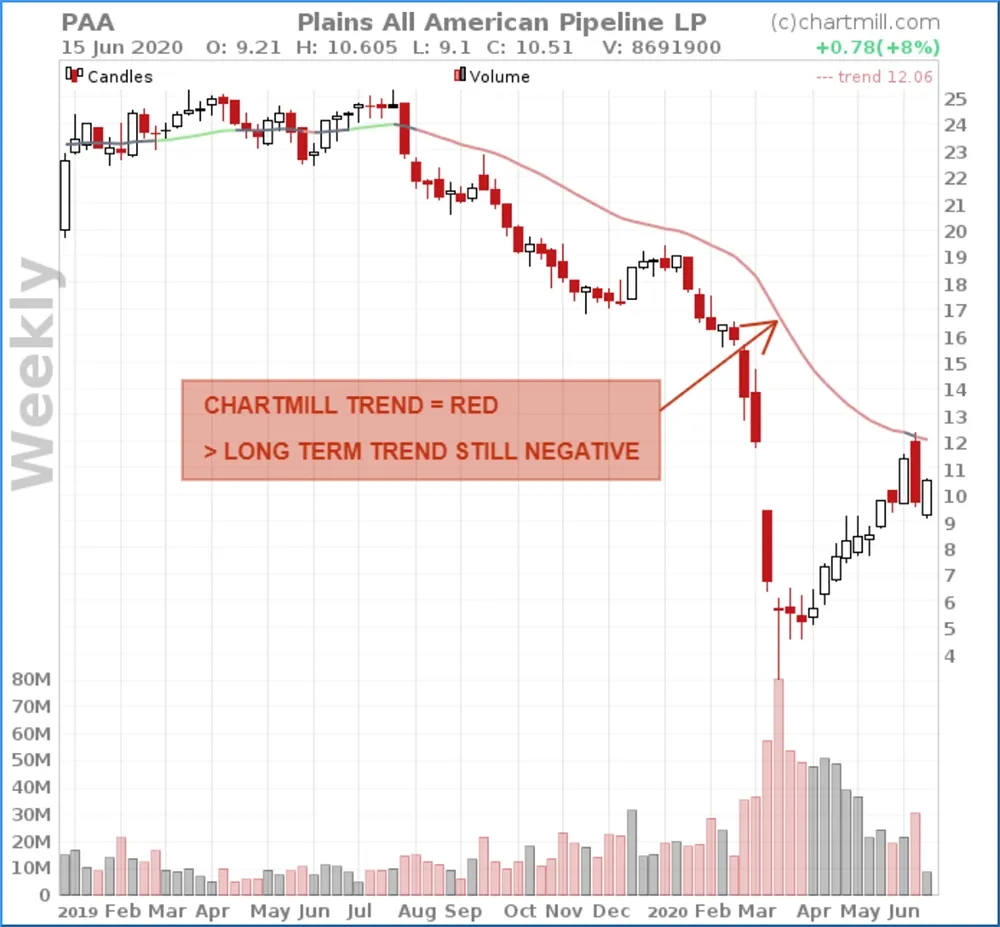
The medium-term trend on the daily chart may be positive, but the long-term main trend based on the ChartMill Trend Indicator on the weekly chart tells a completely different story. It is still red and in strong decline. A negative long-term trend...
Below the further course of the price on the daily chart:
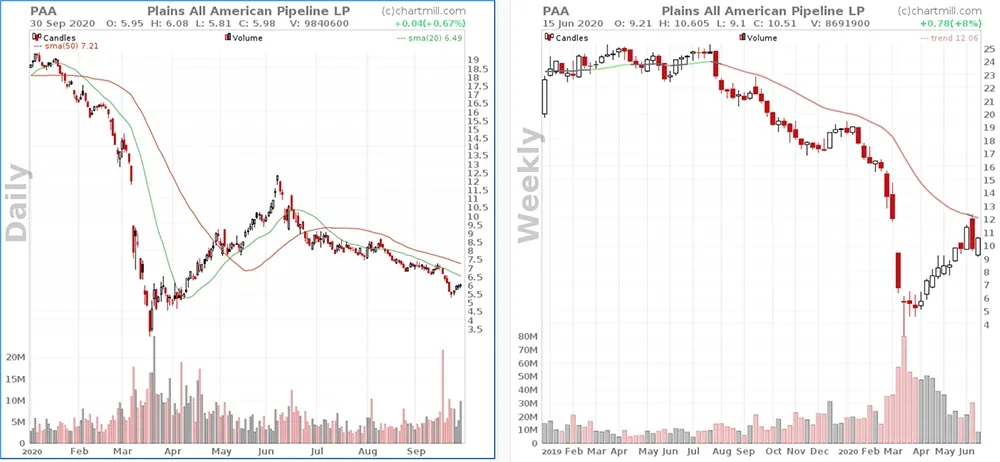
The medium-term bullish trend on the daily chart did not continue and the long-term downward trend was eventually resumed.
Below is an example of a longtrade following a price decline on the daily chart but with the long-term chart still in a clear upward trend.
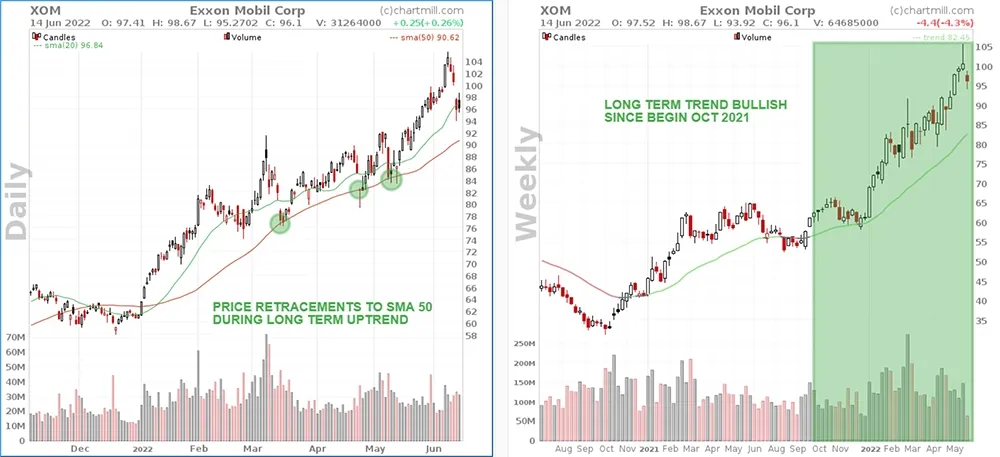
Trading in the direction of the dominant main trend is of utmost importance in a trend following strategy. To be clear, it is not a guarantee of success but it is easier to roll with the tide than go against it.
HOW TO OPEN POSITIONS IN THE DIRECTION OF THE MAIN TREND?
A first important distinction is the choice between a breakout strategy or a retracement strategy.
In the first case, you open a long position if price breaks out above a significant resistance level.
In the case of the retracement strategy you take a position shortly after the price rebounds.
Important: For both strategies it remains important that the direction in which you take a position (long or short) is in line with the current long-term main trend.
Which strategy you use is purely personal, one strategy is not better or worse than the other. The actual setups to effectively open a position can occur in a variety of ways:
Crossing Moving Averages
A commonly used method are the buy signals which occur when moving averages cross. For illustration purposes we will use the 20 and 50 SMA.
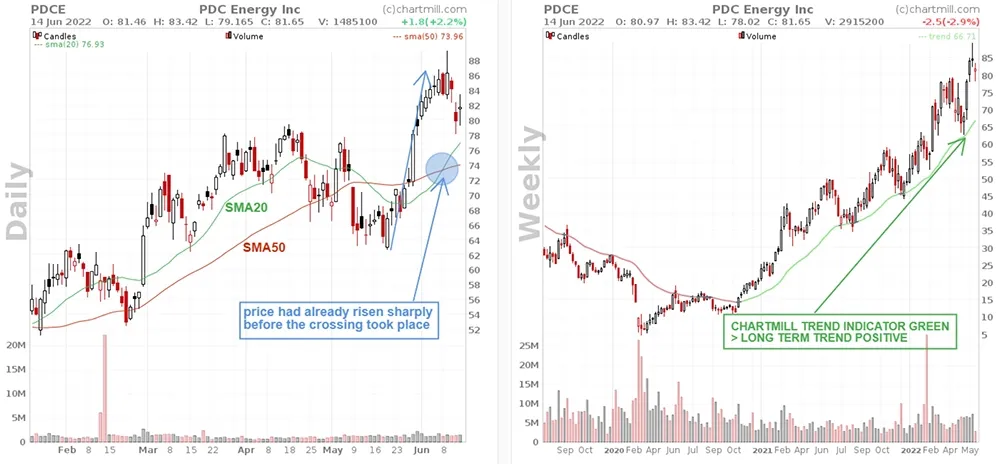
The left-hand chart above shows the moment when the 20SMA crosses the 50SMA upwards. This indicates that the medium term is changing from negative to positive. As the long-term trend on the chart on the right has remained positive throughout this period, the crossing of the two averages can be seen as a confirmation of the long-term trend and is considered a buy signal.
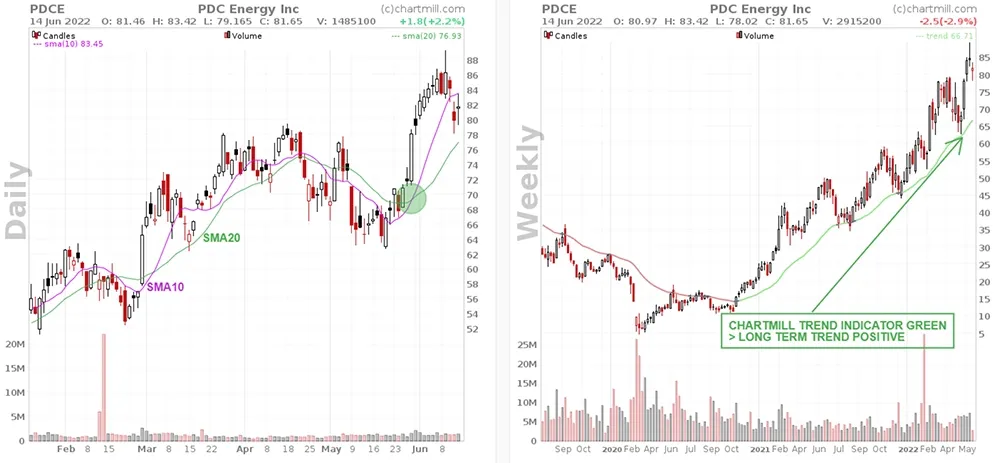
The greatest disadvantage of crossing MA's is that the signal comes rather late. This is logical, moving averages are like many other indicators lagging, after all they are based on prices from the past. You can slightly reduce this by shortening the period of the moving averages and, for example, instead of using a crossing of the 20 with the 50SMA (medium term), to consider the crossing of the 10 with the 20SMA (short term). However, the fact remains that such an entry signal is less suitable if the momentum is very high and the share price is rising rapidly.
The advantage is that such a signal is very objective, there is either a crossing or there is none. No doubt about that and no further interpretation is needed from the trader/investor himself.
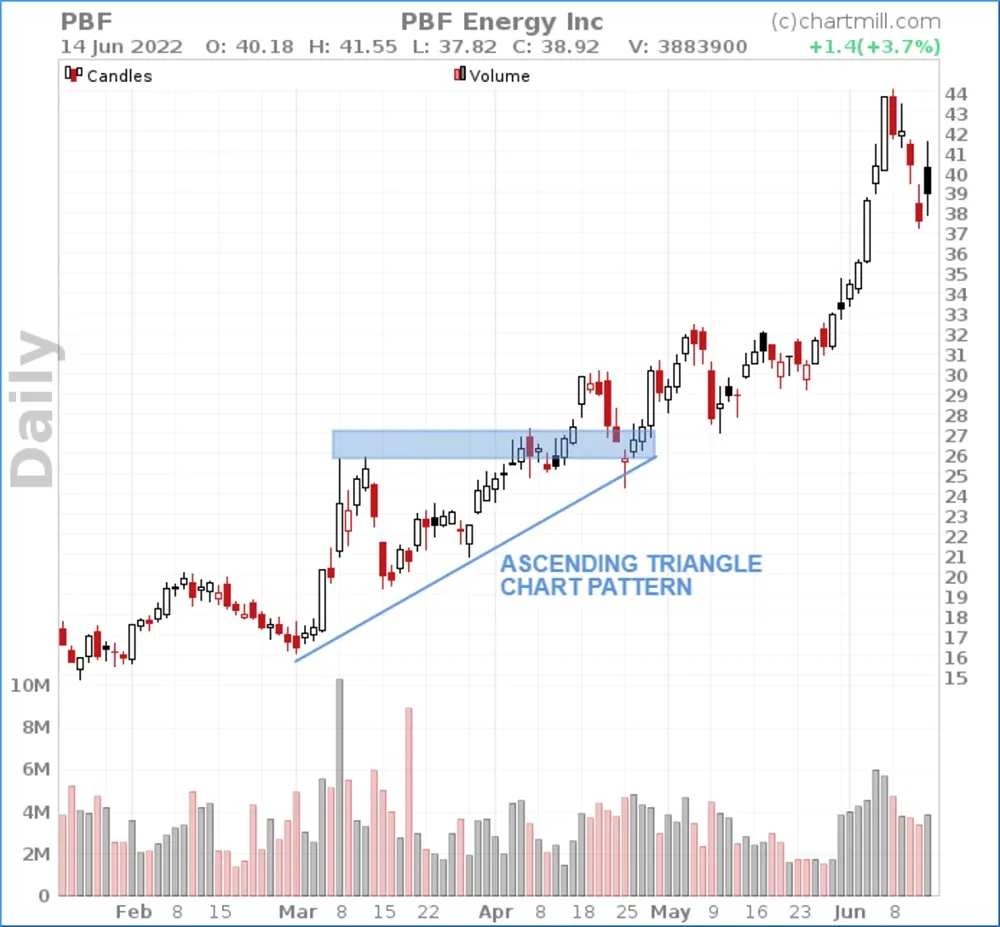
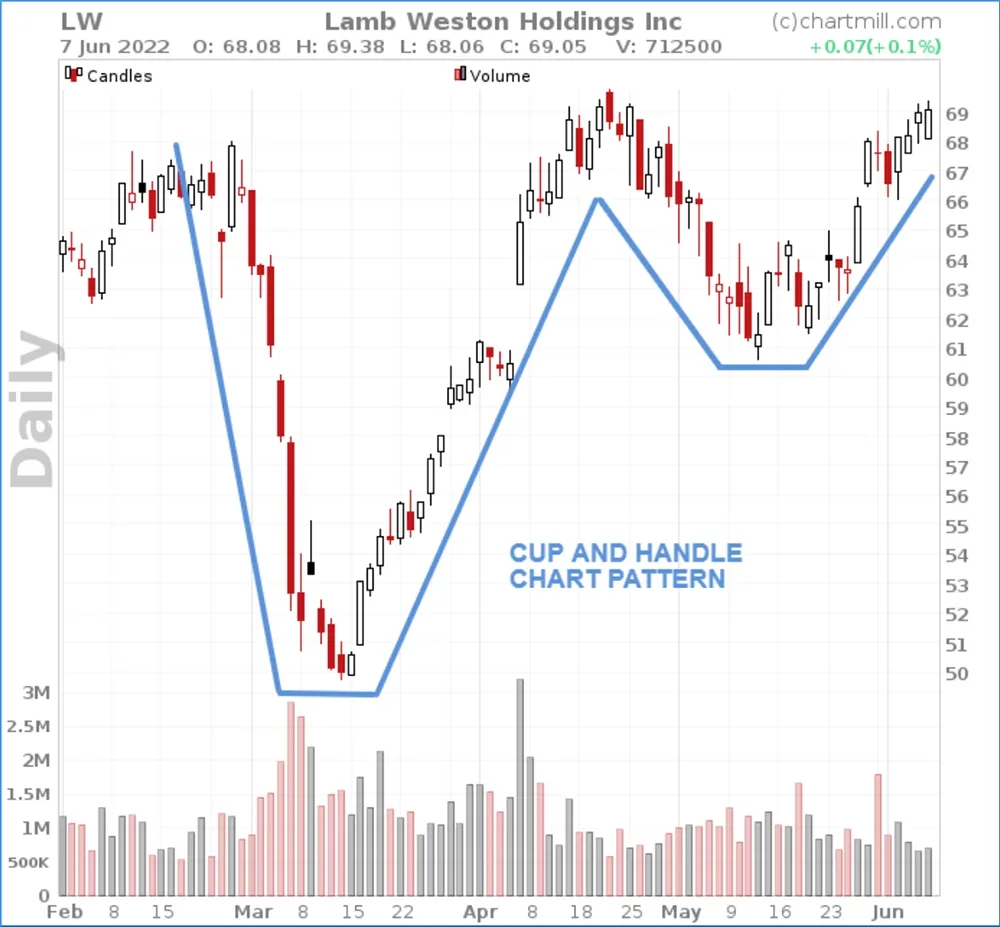
Price patterns and support/resistance zones... (Price Action)
Technical patterns such as ascending or descending triangles, head and shoulders, cup and handle, are all classic price patterns which - when combined with specific support or resistance levels - can form low-risk setups with which to act in the direction of the existing trend.
Technical indicators...
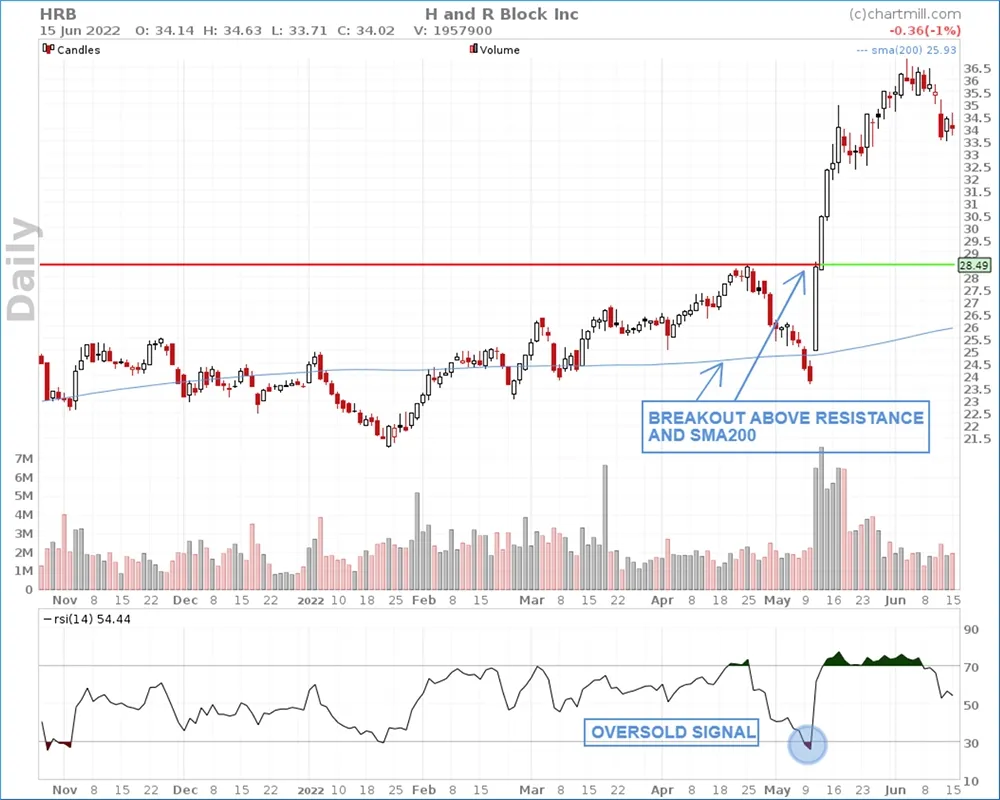
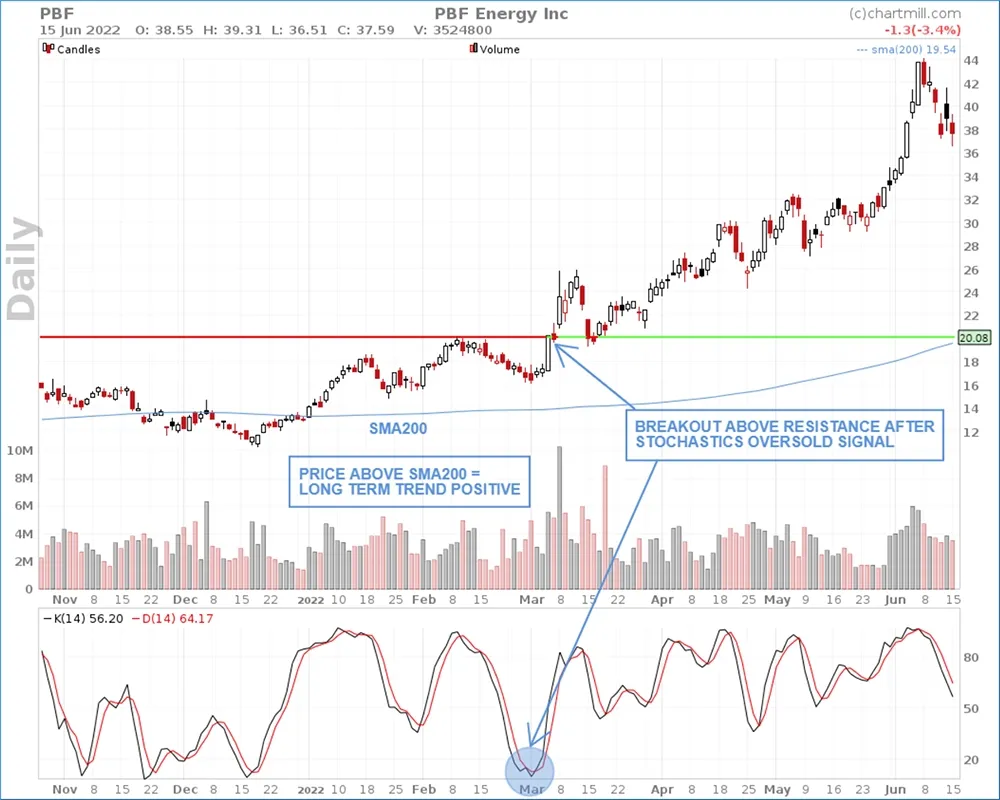
Indicators can also be used to open positions, for example the Relative Strength Index (RSI) and Stochastics Indicator are oscillators that indicate when something is overbought or oversold.
The signals given by such indicators are in themselves not reliable enough to be used as actual buy or sell moments, but if only the signals in the direction of the existing long-term trend are monitored, a lot of false signals can be filtered out.
RSI-signal
Stochastics-signal
It goes without saying that the more of the above elements occur simultaneously, the more reliable the signal will be. So always be very selective when looking for setups and only withhold the best candidates from your list.
FINDING THE BEST SETUPS USING THE CHARTMILL STOCK SCREENER
Finding quality setups among the many thousands of stocks is anything but an easy task. ChartMill, for example, tracks more than 22,000 stocks worldwide on a daily basis.
Fortunately, the software allows you to quickly and efficiently obtain a basic selection of stocks with which you can get started. in the next paragraph I briefly go over a number of screens from the 'Trading Ideas' page which can be used as a basis for trend-following strategies.
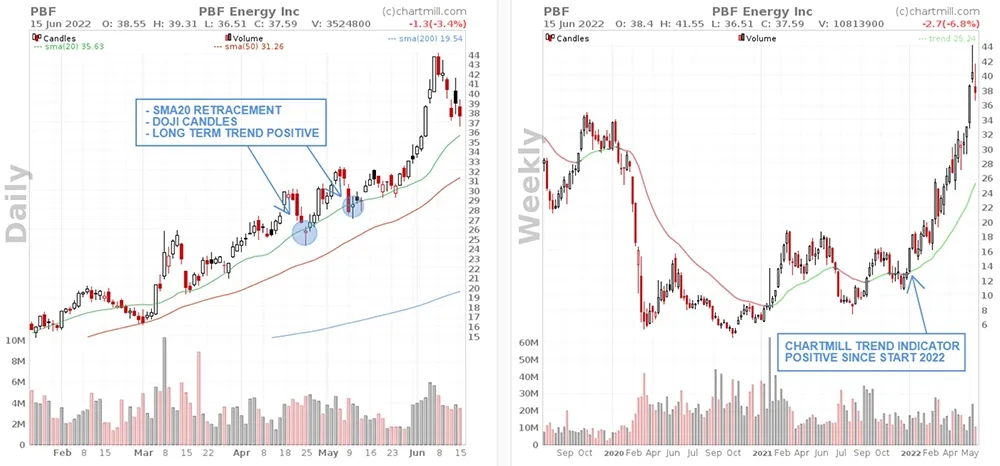
Retracement setups - Price near SMA20 (direct link stocks worldwide)
Retracement setups - Price near SMA50 (direct link stocks worldwide)
A retracement strategy involves looking for stocks in a long-term rising trend whose price has a temporary dip. The easiest way to detect these short drops in a rising trend is to look at the price of the stock in relation to a number of commonly used averages such as the 20 and 50 SMA.
Once such stocks are selected, the price formation around the average is examined and we try to detect clear reversal patterns where a relatively short stoploss is possible.
Example
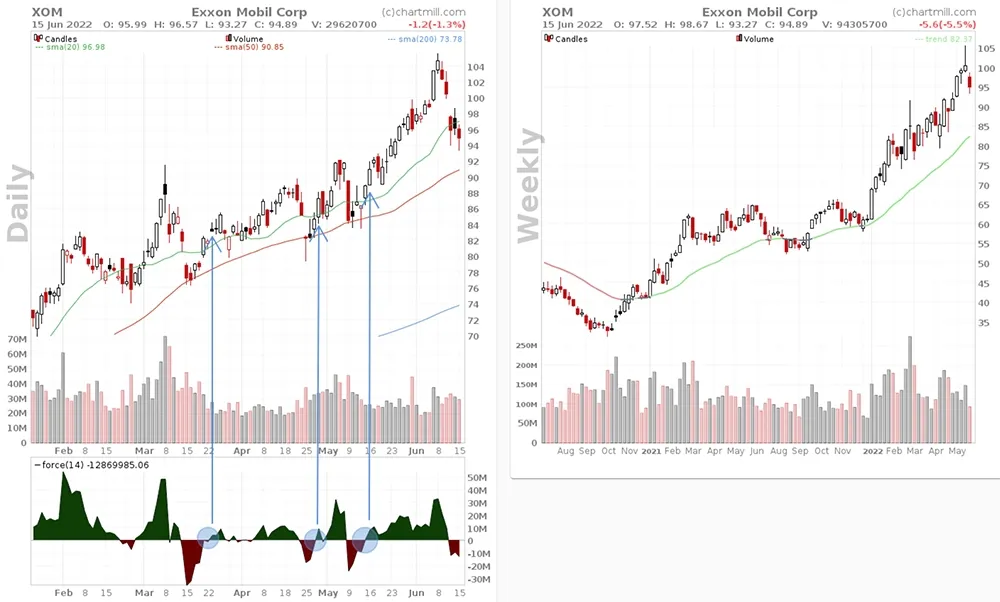
Minor Price retracements using Force Index Indicator (direct link stocks US only)
This is where a technical indicator is specifically used to identify temporary pull backs in long-term rising trends. The Force Index Indicator, developed by Alexander Elder, uses price change in combination with volume to identify the strength of a price movement.
Example
More infomation about this indicator is available in this Force Index article and this video.
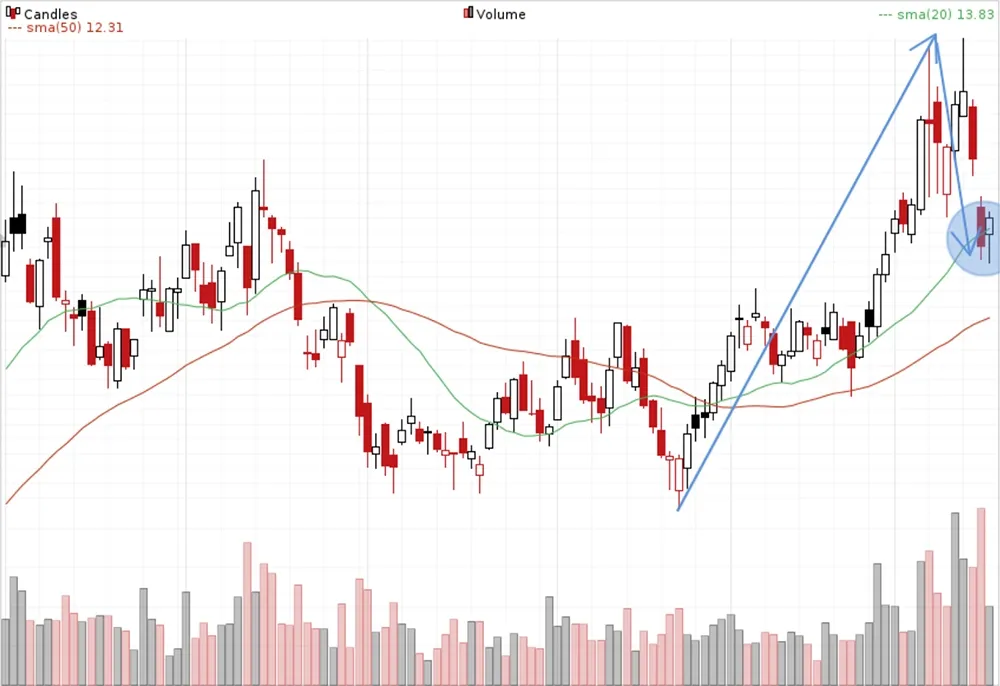
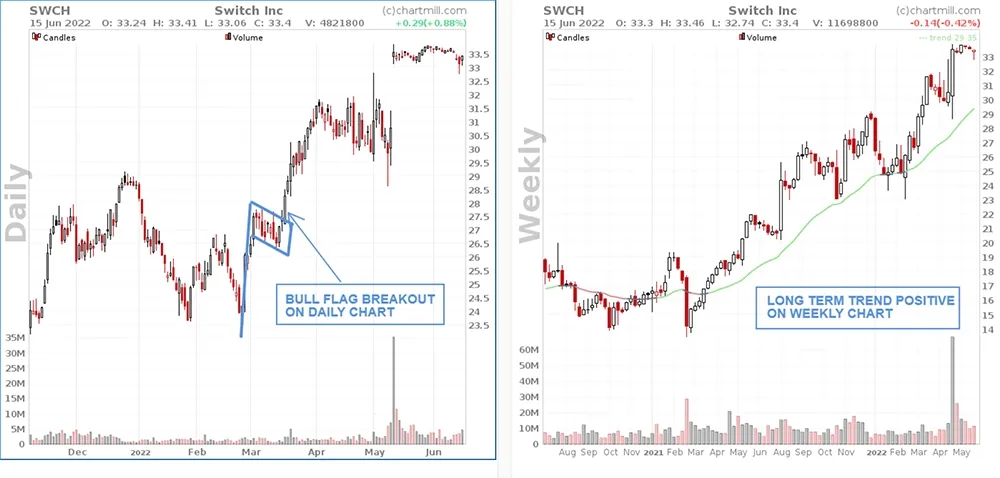
Bull Flags (direct link stocks worldwide)
Positions can also be taken based on technical price patterns. A bull flag is a technical continuation pattern which can be observed in stocks with strong uptrends. The pattern takes shape when the stock retraces by going sideways (or by slowly declining) after an initial big rise in price. We have extended the standard trading idea with an additional trend filter to ensure that the long-term trend for the stock is bullish.
Example
There is a separate article and video available that goes into more detail about the flag formation.
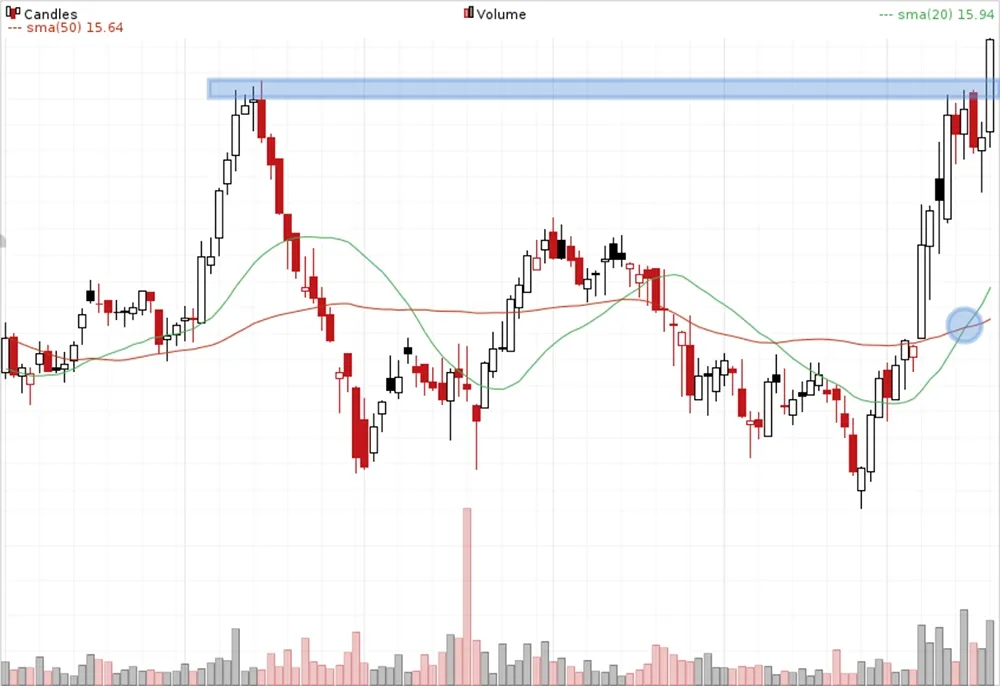
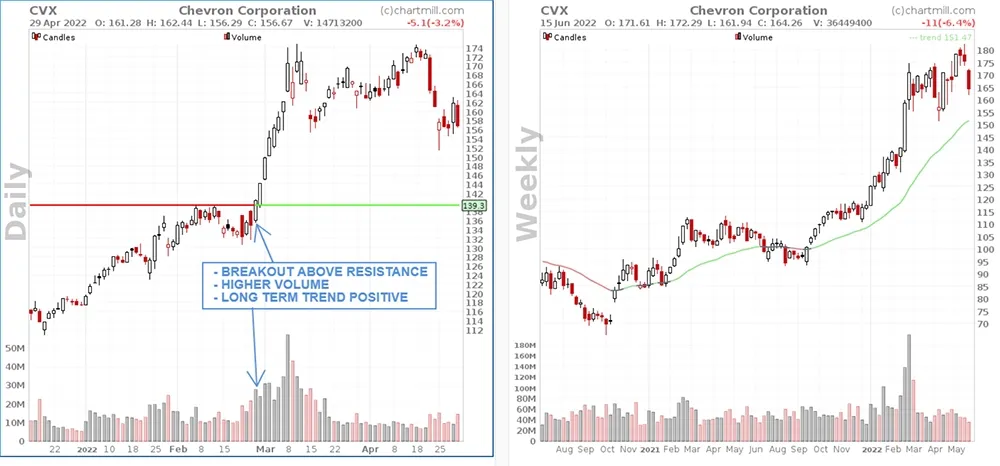
Breakout setups (direct link US stocks only)
Breakout screen filters are used to detect stocks which, after a period of consolidation, break out of their existing trading range on heavy volume. In this case there may also have been a price retracement before the actual breakout, but this strategy is used primarily for stocks which have been close to resistance for some time. In any case, the long-term trend must also be positive.
Example
You'll notice that there are many other possibilities, you'll have to do some testing yourself to see which (combination of) filters give you the best results. The general market conditions play an important role here. A specific filter combination that produces hardly any setups today can suddenly produce dozens of setups tomorrow!
So make sure to test enough filter combinations, over time, together with the experience gained you will eventually be able to predict which filters in which specific circumstances give good setups! Finetune the basic screens and trading ideas to your own wishes and save them in your personal account. Depending on the market conditions you can quickly switch between your different filter screens to find the best setups!
How to create and store your own screens can be seen in this video.
ADDITIONAL POINTS OF INTEREST
Choosing a strategy alone will not get you there. There are numerous other elements that also need to be considered in order to become and remain successful in the long term. Below is an overview of topics that require further attention:
- What type of orders do you use to enter the market? Why are limit orders a better choice than standard market orders? Read more about it in this article.
- I already wrote it at the beginning but I'm repeating it once again because it's so extremely important... Good risk management and correct position sizing are the backbone of your strategy. Why that is, you'll read in this article series.
- When and how do you exit the market? Taking profits too quickly is one of the biggest pitfalls of a trend following strategy. At the same time you want to avoid losing too much of your accumulated profits. This video shows some possible exit strategies that can help you stay in the market as long as possible: 2 Simple and Effective Exit Strategies to Boost your Profits in Trading
- Without any doubt the biggest disadvantage of a trend following strategy is the profit/loss ratio. You'll regularly be confronted with a succession of losing trades as a result of which you'll sometimes have to deal with considerable drawdowns in your portfolio. Mentally this is for many investors a (too) heavy price to pay. So don't just start with a trend following strategy if you're not 100% sure that you can stick to your strategy even in difficult circumstances.
- Changing social trends, macroeconomic indicators, the decisions of central banks and the sometimes very erratic market sentiment are just a few examples that influence financial markets. They determine to a large extent whether a trend is made or broken. So look beyond the charts when it comes to identifying new opportunities and which technologies or sectors are more likely to be at the end of their cycle. Be sure to follow our market updates which are published regulary in our blog section.