How to Use Moving Averages to Determine the Trend?
MOVING AVERAGES - How to use moving averages to determine the trend?
Moving averages can be used in many ways in different types of trading strategies.. Perhaps one of the best known and easiest way is to determine the trend using a specific moving average. In its simplest form you could say that when a price is above a specific moving average the trend is bullish and when that price is below the moving average, the trend is declining.
An example is shown below with the 20EMA on the AAPL chart below.
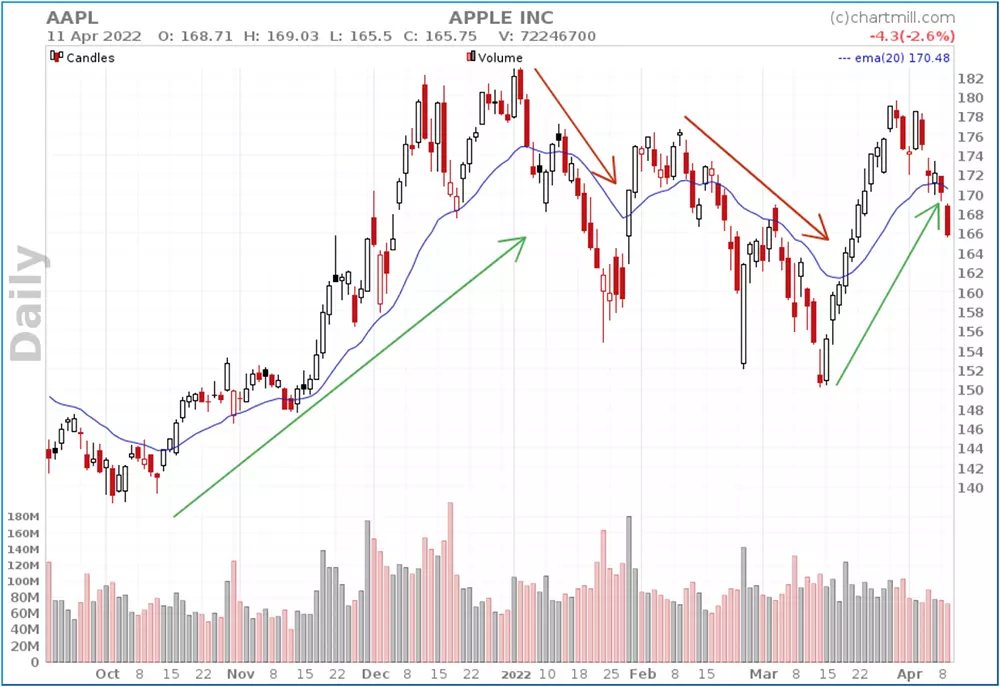
The reason that an EMA is used for the 20-day average is related to the relatively short term. More information on this subject can be read in this basic article on the Exponential Moving Average.
At first sight this might seem a good way to determine the trend, but at the end of the chart you can already see where the problem lies if the price does not choose a clear direction. The price is moving below and above the moving average quite quickly and traders are being misled in this way.
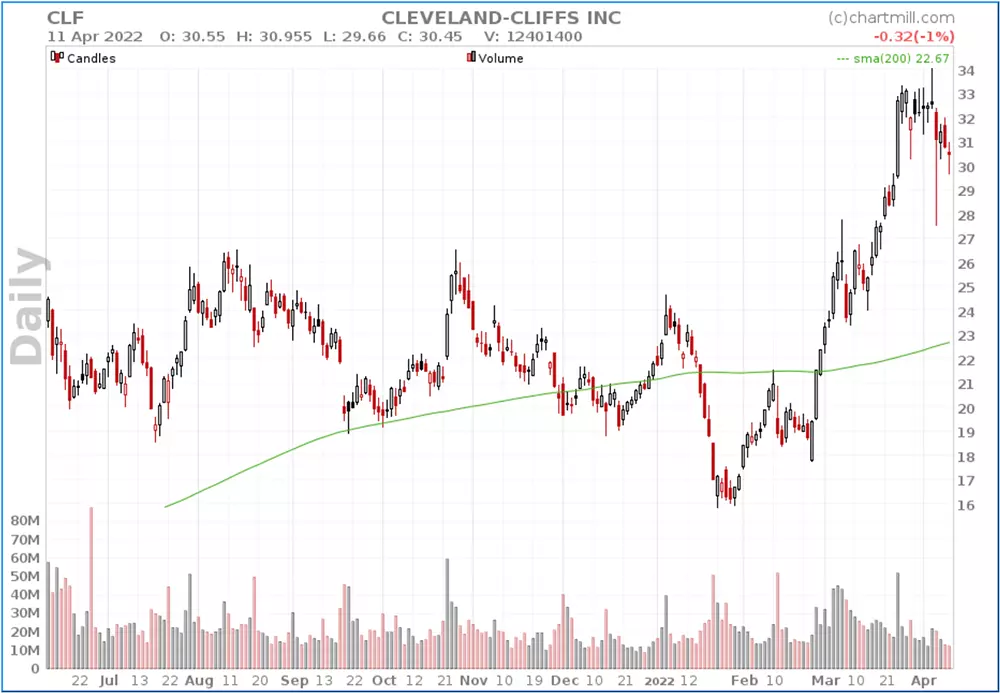
By the way, this problem doesn't only occur with short term averages. Also for the longer term (when for instance an SMA200 is being used) you'll be confronted with the same problem of false trend changes if you only take into account the price in relation to the moving average in order to determine the trend. However, the problem does occur less often than with short term averages.
Solution?
Unfortunately, it is not possible to completely rule out false trend changes in the price evolution. But by combining two moving averages you will succeed in avoiding a large part of false signals.
Have a look at Apple's chart below, now provided with a 10EMA and 20SMA.
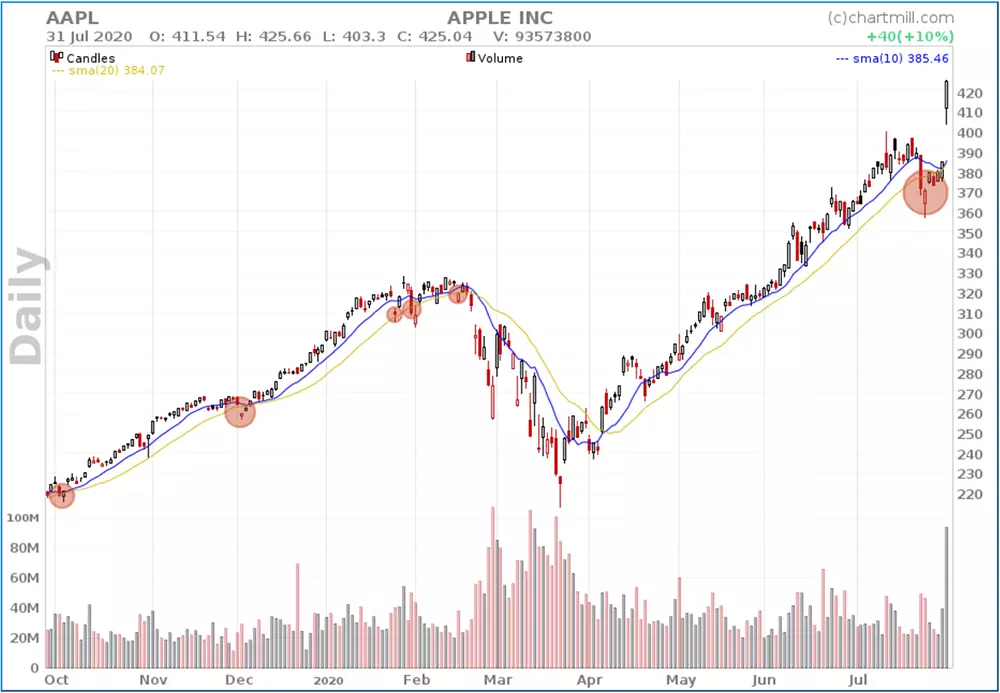
The red circles in the chart above correspond to the time when the price falls below the yellow line (20SMA) and therefore there is a change in the price trend based on only this one SMA.
However, if we also take into account the shorter averaging line (10EMA) and consider that there is only a trend change if the shorter EMA (blue line) crosses the longer SMA (yellow line) up or down, we avoid the false trend changes indicated by the red circles.
Again, this method is certainly not infallible. After all, averages can also cross up and down shortly after each other if the price is in a sideways range. However, the method of combining two moving averages is very useful to avoid reacting too fast during a small opposite movement in a clear main trend and thus speculating too fast on a trend reversal.
Which MAs to use when?
In general we distinguish three trend periods. The short, medium and long term. Different time intervals are used for each of the periods. Frequently used periods are the 5, 10, 20, 50, 100 and 200-day averages.
- Short term : combining 10EMA with 20SMA
- Medium term : combining 20EMA with 50SMA
- Long term : combining 50SMA with 200SMMA
Short term trend chart
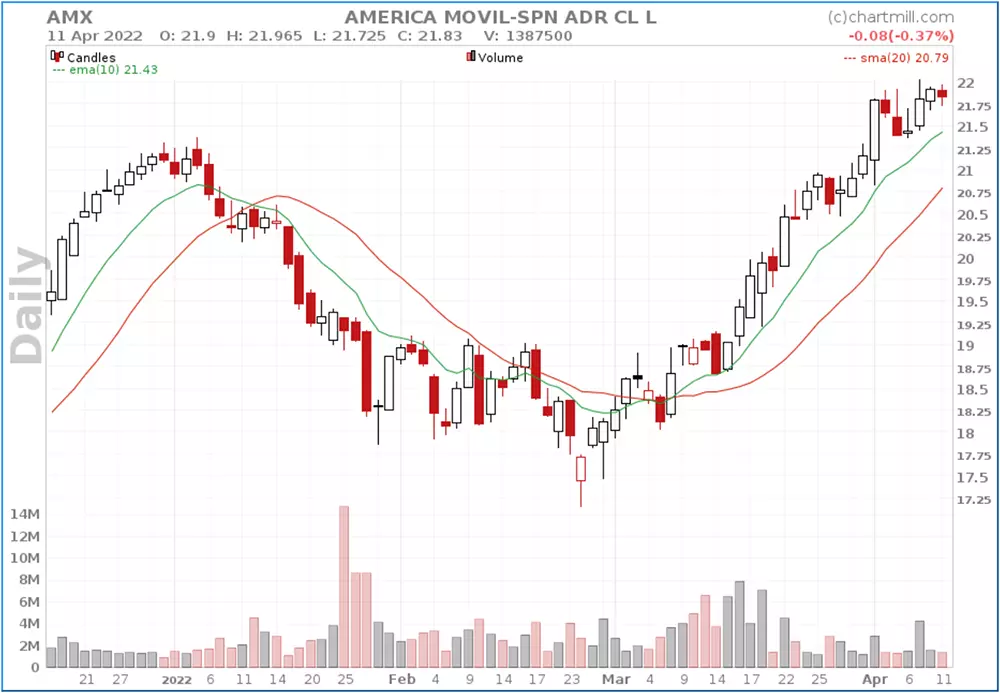
10EMA above 20SMA : bullish trend
10EMA below 20SMA : bearish trend
Medium term trend chart
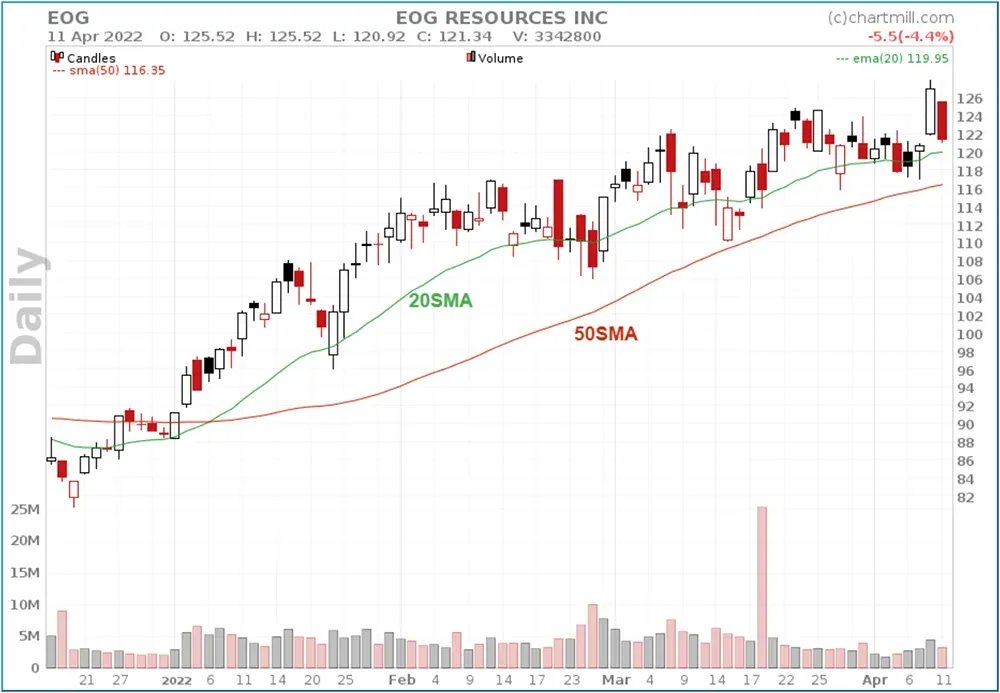
20EMA above 50SMA : bullish trend
20EMA below 50SMA : bearish trend
Long term trend chart
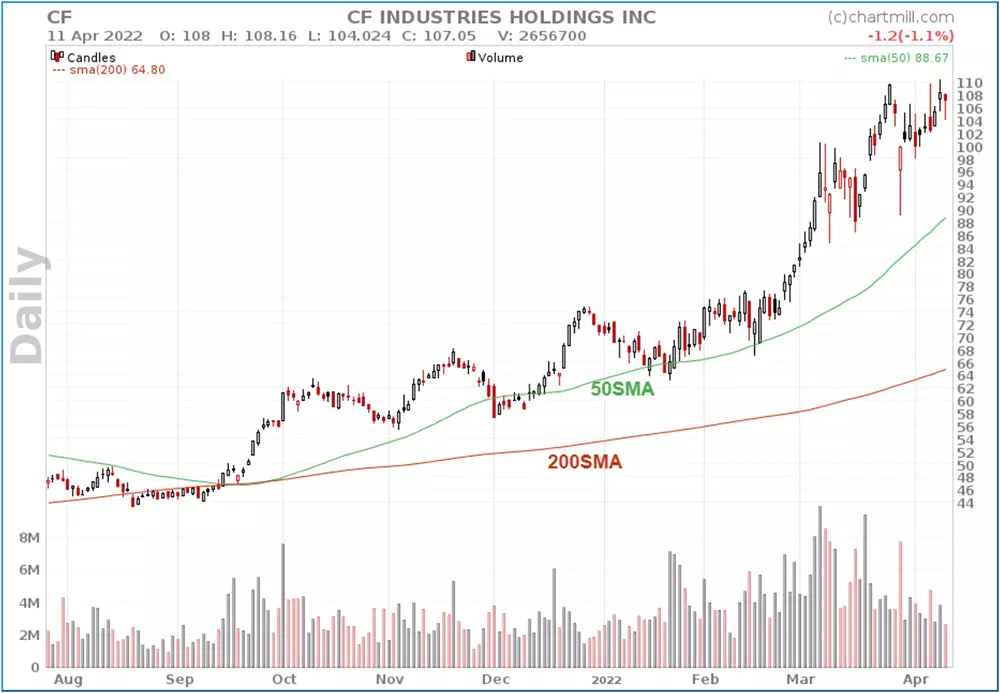
50SMA above 200SMA : bullish trend
50SMA below 200SMA : bearish trend
When determining the trend on a smaller timeframe, it is recommended to look at the trend on a higher timeframe. The charts below are respectively the daily and weekly charts of the same stock.
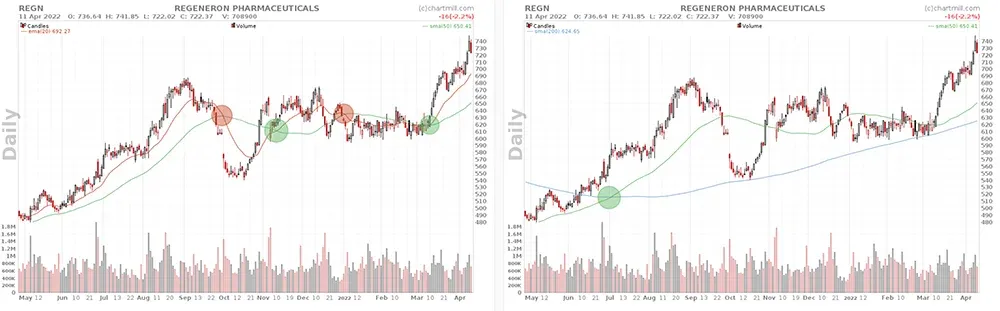
The chart on the left is the daily chart of the ticker REGN (EMA20 and SMA50), the red and green circles show the trend changes on that specific timeframe. When the red line crosses the blue line downwards, the trend changes from bullish to bearish. When the red line crosses the blue line upwards, the trend changes from bullish to bearish.
However, taking into account the right chart - with the SMA50 and SMA200 - we notice that since Julu 2021 the trend has been continuously bullish (green circle where the green line crosses the purple line upwards) based on a different combination of moving averages.
False Trend Changes
If the used moving averages are flat, this is a sign that the trend is rather neutral. The two moving averages will cross each other several times in a fairly short period of time. These are the typical false signals you are confronted with in a sideways market. In those situations it is better to wait until the picture is becoming clearer again. You can do this for example by waiting until a support or resistance level in that sideways range is broken.
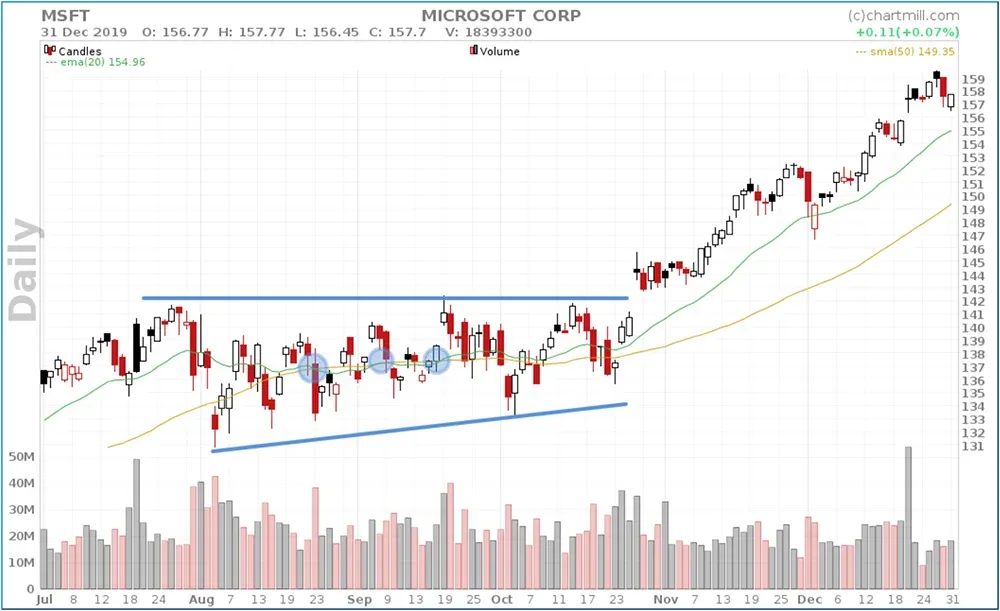
In Microsoft's chart above, we notice that the price trend changes twice shortly after each other (the green line goes twice below and above the yellow line). At the same time the price moves sideways while a kind of ascending triangle is formed. At the moment the resistance is broken, the bullish trend resumes.
Summarized
By using moving averages to determine both the short, medium and long term trend, the trader can form a fairly accurate and above all objective picture of the current trend on the chosen timeframe. Taking this trend into account, the trader can then focus on long or short positions. It is important to pay attention if the average lines are rather flat, this indicates a neutral trend.
Related Articles
